Software-based data acquisition system for Level-1
end-cap muon trigger in ATLAS Run-3
KosukeTakeda∗, on behalf of the ATLAS collaboration ∗Kobe University, Japan
Abstract.In 2019, the ATLAS experiment at CERN is planning an upgrade in order to cope with the higher luminosity requirements. In this upgrade, the installation of the new muon chambers for the end-cap muon system will be carried out. Muon track reconstruction performance can be improved, and fake triggers can be reduced. It is also necessary to develop readout system of trigger data for the Level-1 end-cap muon trigger.
We have decided to develop software-based data acquisition system. There-fore, we have implemented SiTCP technology, which connects a FPGA with the network, on the FPGA of new trigger processor boards.
Due to this implementation, the new DAQ system can take advantage of the latest developments in computing industry. This new readout system architec-ture is based on multi-process software, and can assemble events at a rate of 100 kHz. For data collection, the 10 Gbit Ethernet network switch is used. Moreover, we have optimized these processes to send data to the following sys-tem without any error. Therefore, the built events can be sent with an average throughput of approximately 211 Mbps.
Our newly developed readout system is very generic and it is flexible for modi-fications, extensions and easy to debug. This paper will present the details of the new software-based DAQ system and report the development status for ATLAS Run-3.
1 Introduction
The ATLAS experiment [1] is a multi-purpose experiment at Large Hadron Collider (LHC) [2]. The Run-2 beam energy is 13 TeV and the instantaneous luminosity is 2×1034cm−2s−1. ATLAS has been recording data successfully, and the expected integral luminosity will be 150 fb−1by the end of 2018 (Run-2).
There will be a long shutdown between 2019 and 2020 for the next Run-3 [3]. During this long shutdown, the LHC beam energy will be upgraded from 13 TeV to 14 TeV, and the luminosity is expected to be up to 3×1034cm−2s−1. Under these conditions, the total expected integrated luminosity will be 300 fb−1by the end of Run-3. The expected levels of pile-up also increases due to such high luminosity, reaching more than 60 interactions per bunch crossing in Run-3. Furthermore, there is a known large beam-induced background since Run-1. This background is primarily caused by particles emanating from the end-cap toroid magnet or shielding, which results in a large background trigger rate. However the
∗e-mail: [email protected]
c
Level-1 trigger rate will be limited up to 100 kHz in Run-3. Hence we have to reconsider the hardware of the end-cap first level muon trigger.
(a) Small Wheel (b) Big Wheel
Figure 1: Muon chambers in the end-cap region. Small Wheel [4] (a) and Big Wheel [5] (b) located at 7 m and 13 m from the interaction point respectively.
There are two types of structures in the end-cap region. Figure 1 shows these chambers. One is a Big Wheel (BW), and the other is a Small Wheel (SW) [6]. The BW is located outside the end-cap toroidal magnetic region and the SW is located inside it, namely SW is the innermost muon detector. These structures are composed of various muon detectors. In particular, the SW consists of a layer of muon trigger chambers, namely Thin Gap Chambers (TGC), and two layers of muon precision chambers with Monitored Drift Tubes (MDT) and Cathode Strip Chambers (CSC).
The higher background rate will cause degradation of the MDT position resolution. As a result the muon reconstruction efficiency will be decreased. Therefore the SW will be
re-placed with new muon chambers, assembled into the so-called the New Small Wheel (NSW) [7]. The NSW also has new muon trigger detectors and precision detectors. The NSW covers theη1region 1.3 <|η|<2.7, and we can use the NSW in theηregion up to 2.4 as the first level end-cap trigger system. The design values of eta and phi resolutions for the end-cap trigger system will be 0.005 and 10 mrad respectively. This improved can reject the back-ground in the end-cap region from using NSW will maintain the current trigger rate in the higher luminosity environment without any changes of trigger thresholds.
2 The ATLAS trigger system
The LHC beam crossing frequency is 40 MHz, thus we cannot record all of these events. Moreover most of these events are not what we are interested in. We adopt the multi-level trigger system to make the event rate acceptable to record. The trigger system consists of the Level-1 trigger [8] and High Level Trigger (HLT) [9]. The Level-1 trigger is the first level trigger, which is a hardware-based system of special trigger electronics boards to calculate the trigger decisions. These trigger decisions are sent to Central Trigger Processor (CTP) to form the Level-1 trigger accept signal. Upon a trigger accept signal, the HLT system starts to
Level-1 trigger rate will be limited up to 100 kHz in Run-3. Hence we have to reconsider the hardware of the end-cap first level muon trigger.
(a) Small Wheel (b) Big Wheel
Figure 1: Muon chambers in the end-cap region. Small Wheel [4] (a) and Big Wheel [5] (b) located at 7 m and 13 m from the interaction point respectively.
There are two types of structures in the end-cap region. Figure 1 shows these chambers. One is a Big Wheel (BW), and the other is a Small Wheel (SW) [6]. The BW is located outside the end-cap toroidal magnetic region and the SW is located inside it, namely SW is the innermost muon detector. These structures are composed of various muon detectors. In particular, the SW consists of a layer of muon trigger chambers, namely Thin Gap Chambers (TGC), and two layers of muon precision chambers with Monitored Drift Tubes (MDT) and Cathode Strip Chambers (CSC).
The higher background rate will cause degradation of the MDT position resolution. As a result the muon reconstruction efficiency will be decreased. Therefore the SW will be
re-placed with new muon chambers, assembled into the so-called the New Small Wheel (NSW) [7]. The NSW also has new muon trigger detectors and precision detectors. The NSW covers theη1 region 1.3 <|η|<2.7, and we can use the NSW in theηregion up to 2.4 as the first
level end-cap trigger system. The design values of eta and phi resolutions for the end-cap trigger system will be 0.005 and 10 mrad respectively. This improved can reject the back-ground in the end-cap region from using NSW will maintain the current trigger rate in the higher luminosity environment without any changes of trigger thresholds.
2 The ATLAS trigger system
The LHC beam crossing frequency is 40 MHz, thus we cannot record all of these events. Moreover most of these events are not what we are interested in. We adopt the multi-level trigger system to make the event rate acceptable to record. The trigger system consists of the Level-1 trigger [8] and High Level Trigger (HLT) [9]. The Level-1 trigger is the first level trigger, which is a hardware-based system of special trigger electronics boards to calculate the trigger decisions. These trigger decisions are sent to Central Trigger Processor (CTP) to form the Level-1 trigger accept signal. Upon a trigger accept signal, the HLT system starts to
1ATLAS uses a right-handed coordinate system with its origin at the nominal interaction point (IP) in the centre
of the detector and thez-axis along the beam pipe. Thex-axis points from the IP to the centre of the LHC ring, and they-axis points upward. Cylindrical coordinates (r, ϕ) are used in the transverse plane,ϕbeing the azimuthal angle around thez-axis. The pseudorapidity is defined in terms of the polar angleθasη=−ln tan(θ/2).
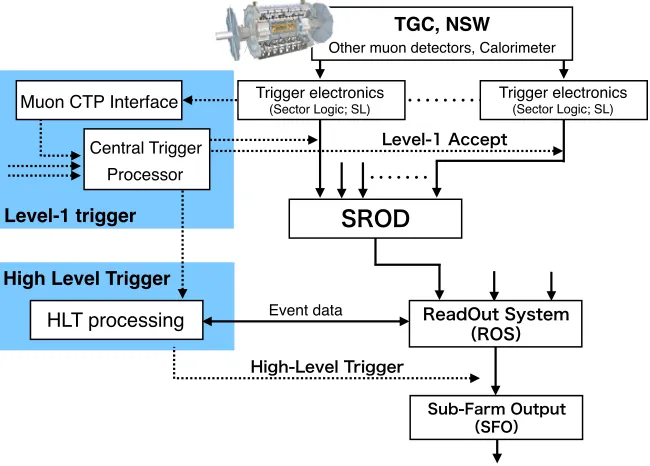
process the event. HLT is a software-based system, and calculates the final trigger decisions using more precise information than the Level-1 trigger. If an event passes these two trigger levels, it is sent to the CERN central storage to be permanently recorded. In order to achieve a wide range of physics goals, we prepare a trigger menu composed of many signatures. We can use the electrons, muons, taus, photons, hadronic jets, and missing energy. In particular, the muon is very important as one of the trigger signature. For example many new physics models are predicted with final states accompanied by muons. Furthermore a muon can be identified easily because it can pass through all the ATLAS sub-detectors, reaching the muon chambers. As part of the recorded trigger decision data there is additional data for monitoring the trigger performance in real time, to allow any problem to be fixed immediately. Therefore it is very important to collect the trigger data at the ATLAS experiment.
Muon CTP Interface
Level-1 Accept
Level-1 trigger
HLT processing Event data
High-Level Trigger
Sub-Farm Output (SFO)
ReadOut System
TGC, NSW
Other muon detectors, Calorimeter
Central Trigger Processor
SROD
2008 JINST 3 S08003
Figure 1.1: Cut-away view of the ATLAS detector. The dimensions of the detector are 25 m in height and 44 m in length. The overall weight of the detector is approximately 7000 tonnes.
The ATLAS detector is nominally forward-backward symmetric with respect to the interac-tion point. The magnet configurainterac-tion comprises a thin superconducting solenoid surrounding the inner-detector cavity, and three large superconducting toroids (one barrel and two end-caps) ar-ranged with an eight-fold azimuthal symmetry around the calorimeters. This fundamental choice has driven the design of the rest of the detector.
The inner detector is immersed in a 2 T solenoidal field. Pattern recognition, momentum and vertex measurements, and electron identification are achieved with a combination of discrete, high-resolution semiconductor pixel and strip detectors in the inner part of the tracking volume, and straw-tube tracking detectors with the capability to generate and detect transition radiation in its outer part.
High granularity liquid-argon (LAr) electromagnetic sampling calorimeters, with excellent performance in terms of energy and position resolution, cover the pseudorapidity range|h|<3.2. The hadronic calorimetry in the range|h|<1.7 is provided by a scintillator-tile calorimeter, which is separated into a large barrel and two smaller extended barrel cylinders, one on either side of the central barrel. In the end-caps (|h|>1.5), LAr technology is also used for the hadronic calorimeters, matching the outer|h|limits of end-cap electromagnetic calorimeters. The LAr forward calorimeters provide both electromagnetic and hadronic energy measurements, and extend the pseudorapidity coverage to|h|=4.9.
The calorimeter is surrounded by the muon spectrometer. The air-core toroid system, with a long barrel and two inserted end-cap magnets, generates strong bending power in a large volume within a light and open structure. Multiple-scattering effects are thereby minimised, and excellent muon momentum resolution is achieved with three layers of high precision tracking chambers.
– 4 –
Trigger electronics
(ROS)
High Level Trigger
Trigger electronics
Trigger electronics
(Sector Logic; SL) Trigger electronics(Sector Logic; SL)
Figure 2: The overview of part of the TDAQ system.
communication between ROD and ROS uses the S-LINK protocol [11], which is developed by CERN. After sending data to ROS, these fragments will be used by the HLT processors. The HLT rate is limited to an average of 1 kHz, and finally these fragments are sent to storage via Sub-Farm Output (SFO).
3 The software-based data acquisition system
The ROD is not performant enough to be used in Run-3. This is because the data transfer rate to the ROD system will be increased due to the new muon chambers sending more precise hit information, i.e. larger fragments. Furthermore, the current ROD is not a flexible system because of its hardware-based structure. In order to solve these problems, a new system has been developed using software-based technology. The new, software-based data acquisition system, referred to as Software-based ROD (SROD), can benefit from recent IT technologies and offers the possibility to freely modify the trigger logic. We use SiTCP [12]
which can connect FPGA and Ethernet so that SROD can run on a normal commercial PC. The SiTCP is implemented on the trigger electronics boards for the Level-1 end-cap muon trigger. These boards can send the fragments to SROD via normal ethernet cable with a bandwidth of up to 1 Gbps, meeting our requirements. Thus SROD does not need to use any special techniques to collect fragments. All we have to do is to implement TCP/IP techniques
to allow communication between the boards.
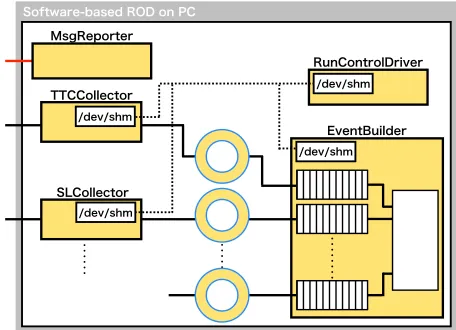
There are two ways to realize such DAQ system. One is the multi-thread architecture, and the other is the multi-process architecture. The multi-process architecture is adopted to make the SROD more robust and it suits well the types of processes to be used. In addition this removes any of the potential risks involved with using a multi-thread architecture (especially for recovering from crashes). There are four types of processes. These areCollector, EventBuilder, RunControlDriverandMsgReporter. The overview of this system is shown in Figure 3.
Software-based ROD on PC
EventBuilder
ROD Buffer RunControlDriver
SLCollector TTCCollector MsgReporter
/dev/shm
/dev/shm
/dev/shm
/dev/shm
Figure 3: The SROD process overview. The total number of processes is 16.
The Collectorprocess receives data from each board via TCP/IP. There is a total 13
communication between ROD and ROS uses the S-LINK protocol [11], which is developed by CERN. After sending data to ROS, these fragments will be used by the HLT processors. The HLT rate is limited to an average of 1 kHz, and finally these fragments are sent to storage via Sub-Farm Output (SFO).
3 The software-based data acquisition system
The ROD is not performant enough to be used in Run-3. This is because the data transfer rate to the ROD system will be increased due to the new muon chambers sending more precise hit information, i.e. larger fragments. Furthermore, the current ROD is not a flexible system because of its hardware-based structure. In order to solve these problems, a new system has been developed using software-based technology. The new, software-based data acquisition system, referred to as Software-based ROD (SROD), can benefit from recent IT technologies and offers the possibility to freely modify the trigger logic. We use SiTCP [12]
which can connect FPGA and Ethernet so that SROD can run on a normal commercial PC. The SiTCP is implemented on the trigger electronics boards for the Level-1 end-cap muon trigger. These boards can send the fragments to SROD via normal ethernet cable with a bandwidth of up to 1 Gbps, meeting our requirements. Thus SROD does not need to use any special techniques to collect fragments. All we have to do is to implement TCP/IP techniques
to allow communication between the boards.
There are two ways to realize such DAQ system. One is the multi-thread architecture, and the other is the multi-process architecture. The multi-process architecture is adopted to make the SROD more robust and it suits well the types of processes to be used. In addition this removes any of the potential risks involved with using a multi-thread architecture (especially for recovering from crashes). There are four types of processes. These are Collector, EventBuilder, RunControlDriverandMsgReporter. The overview of this system is shown in Figure 3.
Software-based ROD on PC
EventBuilder
ROD Buffer RunControlDriver
SLCollector TTCCollector MsgReporter
/dev/shm
/dev/shm
/dev/shm
/dev/shm
Figure 3: The SROD process overview. The total number of processes is 16.
TheCollectorprocess receives data from each board via TCP/IP. There is a total 13
Collectorprocesses, equal to the number of boards. This process move fragments to the subsequent shared memory, which we call RingBuffer. Arrival delays can be absorbed
using these shared memories. Some information is stored in their memories to control writing and reading data from the buffers, andCollectorchecks these parameters to write data into this buffer.
The EventBuilder process reads data from each RingBuffer, and builds an event. This process also checks whether the ID information of each fragment is consistent with each other. After building the event, this process sends data to ROS via S-LINK. However, there was no commercial device to use the S-LINK protocol. Therefore we have also developed a new PCI-Express card, which we call a S-LINK card.
In addition, SROD has two more processes to control and monitor the whole SROD sys-tem,RunControlDriverandMsgReporter. The former uses shared memories to synchro-nize the processes running locally with the central system. The latter collects messages from each process and post them to the ATLAS message reporting system. All process can output messages, in particular, error messages if something unexpected occurs. These are sent by the MsgReporter to the ATLAS global monitoring system via the Error Reporting Service (ESR).
4 The performance of the DAQ systems
In Run-3, there will be a total of 6 SROD PCs, and each SROD PC will communicate with 12 SL boards and 1 TTC-Fanout board. SROD handles two types of data from SL boards and TTC-Fanout board.
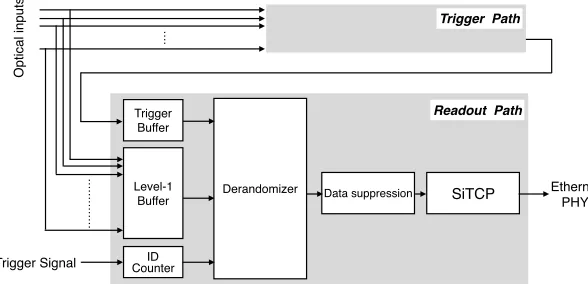
The overview of the SL firmware is shown in Figure 4. The SL firmware has two main parts, the trigger path and readout path. Figure 4 shows mainly the readout path. SL boards re-ceive data from muon chambers and store it in each buffer. The size of the data in input to the
Level-1 buffer is not fixed since it depends on the number of hits. The subsequent processing
part, derandomizer, changes the clock frequency and outputs data to the suppression logic. SL boards can suppress data using a suppression technique, which we call Zero-Suppress logic [13]. This logic reads data in every eight bits, and judge whether the eight bits are zero or not. If the eight bits are zero, these bytes are discarded. This suppression logic is very efficienct for this environment, because our data from muon chambers is almost empty. After
the suppression, a SL board attaches header and footer to the fragment, and writes data to SiTCP logic.
SiTCP
Derandomizer Data suppression
ID Counter Level-1 Buffer Trigger
Buffer
Trigger Signal
Trigger Path
Readout Path
Optical inputs
Ethernet PHY
SL boards also send the trigger decision data. The trigger data is not suppressed, therefore the input data size is mainly dependent on the size of header, footer and trigger decision results. The average size is estimated about 2000 bit per board per event. On the contrary, the input data from TTC-Fanout board is fixed-length because this is ID information. The data size is 160 bit per a board per an event. Accordingly the total input data rate to SROD is about 2.56 Gbps. After collecting these fragments, SROD builds a ROD fragment and sends data at less than 1.0 Gbps. Since the input data size is mainly dependent on the ID information, the output data transfer rate can be less than the input data transfer rate.
We have measured the performance of the SROD system using the CERN test-bench environment. The setup used: 12 SL boards, 1 TTC-Fanout board, 1 SROD PC, 1 ROS PC, 1 SFO PC and the basic trigger systems. This setup reproduces the ATLAS Level-1 end-cap muon trigger system. The performances are shown in Figure 5. The first test measured the performance without using the ROS and SFO system. This test can show the SROD system limitation. In Figure 5 (a), the Level-1 trigger rate was fixed to 100 kHz and the input data size was changed. The x-axis means the input data transfer rate per a SL board. The SROD system works fine below about 800 Mbps because the SiTCP design bandwidth is about 1 Gbps. Hence the SROD system has enough power to process events with larger data size than the expected value. In Figure 5 (b), the Level-1 trigger rate was changed and the input data size was fixed. The x-axis means the Level-1 trigger rate, and the y-axis means the SROD processing rate. The SROD can withstand up to about 200 kHz input rate.
CHEP2018 Kosuke Takeda (Kobe University)
❖
The SROD performance has been measured.
■
In Run-3:
•The average Level-1 trigger rate is 100 kHz.
•The average event size is ~ 2000-bit.
❖
SROD has good performance.
■
The processing speed is higher than the requirement.
•This bottleneck is coming from the network switch.
SROD performance
15
SROD
L1A publising rate [kHz] 0 20 40 60 80 100 120 140 160 180
SROD Speed [kHz]
0 20 40 60 80 100 120 140 160 180
Software-besed ROD Data Size Fixed (96 bit)
Data transfer rate [Mbps] 0 200 400 600 800 1000 1200 1400 1600
SROD Speed [kHz]
0 20 40 60 80 100
Software-besed ROD L1A rate Fixed (100 kHz)
ATLAS TDAQ Preliminary ATLAS TDAQ Preliminary
(a)
CHEP2018 Kosuke Takeda (Kobe University)
❖
The SROD performance has been measured.
■
In Run-3:
•The average Level-1 trigger rate is 100 kHz.
•The average event size is ~ 2000-bit.
❖
SROD has good performance.
■
The processing speed is higher than the requirement.
•This bottleneck is coming from the network switch.
SROD performance
15
SROD
L1A publising rate [kHz] 0 20 40 60 80 100 120 140 160 180
SROD Speed [kHz]
0 20 40 60 80 100 120 140 160 180
Software-besed ROD Data Size Fixed (96 bit)
Data transfer rate [Mbps] 0 200 400 600 800 1000 1200 1400 1600
SROD Speed [kHz]
0 20 40 60 80 100
Software-besed ROD L1A rate Fixed (100 kHz)
ATLAS TDAQ Preliminary ATLAS TDAQ Preliminary
(b)
Figure 5: These plots show the SROD performance at the CERN test bench [14]. (a) Mea-sured output rate is shown as a function of the input data size. (b) MeaMea-sured output rate is shown as a function of the Level-1 trigger rate.
SL boards also send the trigger decision data. The trigger data is not suppressed, therefore the input data size is mainly dependent on the size of header, footer and trigger decision results. The average size is estimated about 2000 bit per board per event. On the contrary, the input data from TTC-Fanout board is fixed-length because this is ID information. The data size is 160 bit per a board per an event. Accordingly the total input data rate to SROD is about 2.56 Gbps. After collecting these fragments, SROD builds a ROD fragment and sends data at less than 1.0 Gbps. Since the input data size is mainly dependent on the ID information, the output data transfer rate can be less than the input data transfer rate.
We have measured the performance of the SROD system using the CERN test-bench environment. The setup used: 12 SL boards, 1 TTC-Fanout board, 1 SROD PC, 1 ROS PC, 1 SFO PC and the basic trigger systems. This setup reproduces the ATLAS Level-1 end-cap muon trigger system. The performances are shown in Figure 5. The first test measured the performance without using the ROS and SFO system. This test can show the SROD system limitation. In Figure 5 (a), the Level-1 trigger rate was fixed to 100 kHz and the input data size was changed. The x-axis means the input data transfer rate per a SL board. The SROD system works fine below about 800 Mbps because the SiTCP design bandwidth is about 1 Gbps. Hence the SROD system has enough power to process events with larger data size than the expected value. In Figure 5 (b), the Level-1 trigger rate was changed and the input data size was fixed. The x-axis means the Level-1 trigger rate, and the y-axis means the SROD processing rate. The SROD can withstand up to about 200 kHz input rate.
CHEP2018 Kosuke Takeda (Kobe University)
❖
The SROD performance has been measured.
■
In Run-3:
•The average Level-1 trigger rate is 100 kHz.
•The average event size is ~ 2000-bit.
❖
SROD has good performance.
■
The processing speed is higher than the requirement.
•This bottleneck is coming from the network switch.
SROD performance
15
SROD
L1A publising rate [kHz] 0 20 40 60 80 100 120 140 160 180
SROD Speed [kHz]
0 20 40 60 80 100 120 140 160 180 Software-besed ROD Data Size Fixed (96 bit)
Data transfer rate [Mbps] 0 200 400 600 800 1000 1200 1400 1600
SROD Speed [kHz]
0 20 40 60 80 100 Software-besed ROD L1A rate Fixed (100 kHz)
ATLAS TDAQ Preliminary ATLAS TDAQ Preliminary
(a)
CHEP2018 Kosuke Takeda (Kobe University)
❖
The SROD performance has been measured.
■
In Run-3:
•The average Level-1 trigger rate is 100 kHz.
•The average event size is ~ 2000-bit.
❖
SROD has good performance.
■
The processing speed is higher than the requirement.
•This bottleneck is coming from the network switch.
SROD performance
15
SROD
L1A publising rate [kHz] 0 20 40 60 80 100 120 140 160 180
SROD Speed [kHz]
0 20 40 60 80 100 120 140 160 180 Software-besed ROD Data Size Fixed (96 bit)
Data transfer rate [Mbps] 0 200 400 600 800 1000 1200 1400 1600
SROD Speed [kHz]
0 20 40 60 80 100 Software-besed ROD L1A rate Fixed (100 kHz)
ATLAS TDAQ Preliminary ATLAS TDAQ Preliminary
(b)
Figure 5: These plots show the SROD performance at the CERN test bench [14]. (a) Mea-sured output rate is shown as a function of the input data size. (b) MeaMea-sured output rate is shown as a function of the Level-1 trigger rate.
The above test doesn’t include the ROS and SFO system, and we have also confirmed that the full-chain performance meets the specification, namely the SROD system can run at 100 kHz while handling data acquisition. However, it is understood that further optimization is needed to measure the precise performance. We will also modify the input and output data format. Further studies are needed to define the optimal use of the S-LINK protocol. The S-LINK users can communicate via the protocol by using up to two fibers, with a bandwidth of 1 Gbps each. When the protocol is used, one or two fibers can be selected. Our SROD uses only one fiber to realize the communication with ROS. If two fibers are used, we have to split a fragment into two parts and attach a header and trailer to each fragment. The ROD fragment size is mainly occupied by the header and trailer. For the moment we concluded that
it is not efficient for the system to use two fibers, but there may be some room to improve the
performance by reconsidering this choice. We will measure the full-chain test performance after such optimization, and continue to tune the SROD system to be more robust.
5 Summary
The SROD has been developed for the coming higher luminosity and energy conditions of Run-3. Data will be recorded at the same Level-1 trigger rate as in Run-2 in spite of the higher luminosity and the bigger size of the data produced by the new muon detectors in the end-caps. We will install new trigger electronics and new trigger decision logics. Furthermore, we will replace the current hardware-based data acquisition system with the software-based one (SROD). The developed SROD will be a flexible system because of the software-based structure, and it will be easier to improve and maintain the system performance. We have measured the performance using the CERN test-bench environment, and we confirmed that SROD meets the performance figures requested for Run-3. Further optimization work will take place before the installation of the system for data taking.
References
[1] L. Evans and P. Bryant, The ATLAS Experiment at the CERN Large Hadron Collider,
JINST 3(2008) S08003.
[2] ATLAS Collaboration, LHC Design Report Volume I : The LHC Main Ring, CERN-2004- 003, 2004.
[3] ATLAS Collaboration, Technical Design Report for the Phase-I Upgrade of the ATLAS TDAQ System, CERN-LHCC-2013-018, ATLAS-TDR-023.
[4] ATLAS Collaboration, The two ATLAS small wheels, last big pieces to descend the ATLAS cavern, are ready at building 181 on CERN site.,CERN-EX-0801014, https://cds.cern.ch/record/1082464.
[5] ATLAS Collaboration, Installation of the first of the big wheels of the AT-LAS muon spectrometer, a thin gap chamber (TGC) wheel. ,CERN-EX-0609016, https://cds.cern.ch/record/986163.
[6] ATLAS Collaboration, ATLAS Muon Spectrometer Technical Design Report, CERN-LHCC- 97-22, 1997.
[7] T.Kawamoto et al, New Small Wheel Technical Design Report, CERN-LHCC2013-006, ATLAS-TDR-020.
[8] ATLAS Collaboration, Level-1 Trigger Technical Design Report, ATLAS TDR-12, 1998. [9] ATLAS Collaboration, ATLAS High-Level Trigger, Data Acquisition and Controls,
AT-LAS TDR-016, 2002.
[10] ATLAS Collaboration, The raw event format in the ATLAS Trigger & DAQ, 14 Febru-ary 2008.
[11] ATLAS Collaboration, The S-LINK 64 bit extension specification:S-LINK64, 4 August 2003.
[12] Uchida Tomohisa, Hardware-Based TCP Processor for Gigabit Ethernet,IEEE transac-tions on nuclear science,55(2008) 1631-1637.
[13] Hiroshi Nomoto, Star Switch Spec, September 11, 2009. [14] ATLAS Collaboration, L1 Muon Trigger Public Results,
![Figure 1: Muon chambers in the end-cap region. Small Wheel [4] (a) and Big Wheel [5] (b)located at 7 m and 13 m from the interaction point respectively.](https://thumb-us.123doks.com/thumbv2/123dok_us/7995809.1327703/2.482.79.420.106.226/figure-chambers-small-wheel-wheel-located-interaction-respectively.webp)
![Figure 5: These plots show the SROD performance at the CERN test bench [14]. (a) Mea-sured output rate is shown as a function of the input data size](https://thumb-us.123doks.com/thumbv2/123dok_us/7995809.1327703/6.482.67.425.323.477/figure-plots-srod-performance-cern-bench-output-function.webp)
