ISOLATION B Y DISTANCE*
SEWALL WRIGHT
The University of Chicago'
Received November 9, 1942
important
S
line of attack on the evolutionary problem. While such differences can only rarely represent first steps toward speciation in the sense of the splittingof the species, they are important for the evolution of the species as a whole. They provide a possible basis for intergroup selection of genetic systems, a process that provides a more effective mechanism for adaptive advance of the species as a whole than does the mass selection which is all that can occur under panmixia.
TUDY of statistical differences among local populations is
RANDOM DIPPERENTIATION UNDER THE ISLAND MODEL
Mathematical consideration requires the use of simple models of population structure. The simplest model is that in which the total population is assumed to be divided into subgroups, each breeding a t random within itself, except for a certain proportion of migrants drawn a t random from the whole. Since this situation is likely to be approximated in a group of islands, we shall refer to it as the island model.
The gene frequency (4) of a subgroup tends to vary about a certain equi- librium point
(q)
in a distribution curve (+(q)) determined by the net sys- tematic pressure (measured by Aq, the net rate of change of gene frequency per generation from recurrent mutation, immigration, and selection) in con- junction with the cumulative effects of accidents of sampling (random devia- tion aq, variance per generation U:,) (WRIGHT 1929, 1931, 1942).Let N be the effective size of the subgroup, m the effective proportion of its population replaced in each generation by migrants, and qt the gene frequency in the total population. The rate of change of gene frequency per generation in a subgroup, taking account only of immigration pressure, is Aq= -m(q- qt). In a random breeding population U&= q(1 -q)/2N. Substitution in (I) g;ves the following, choosing C so that J&$(q)dq= I (WRIGHT 1931, 1942).
* A portion of the cost of composing the mathematical formulae is borne by the Galton and
Acknowledgment is made to the DR. WALLACE C. and CLARA A. ABBOTT MEMORIAL FUND Mendel Memorial Fund.
of the UNIVERSITY OF CHICAGO for assistance in connection with the calculations.
ISOLATION BY DISTANCE 115
1
(4)
4
=Jo
(q - iI24(q)dq = qt(1-
qt)/(4"+
1).I n the derivation of (I), i t was assumed that Aq is sufficiently small that terms involving (Aq)2 might be ignored. A more accurate value of c: may be obtained directly. The deviation of a local gene frequency from the average, (9-qt), tends to be reduced to (I-m)(q-qJ in the next generation. The mean sampling variance of (q+Aq) is
= [qt(I
-
qt)-
(I-
m)2a:]/zN. Thus with a steady balance between the effects of immigration and of the accidents of sampling(6)
(7)
U: = ( I
-
m)%;+
[qt(I-
qt) - (I-
m)%:]/zN U: = qt(I-
qt)/[zN-
(zN-
I)(I-
m)*].This is approximately the same as (4) for small values of m but becomes qt( I
-
qt)/aN, the sampling variance, in the limiting case of no isolation what-ever ( m = I). This is about twice as great as given by (4) in this extreme case. The variance, excluding the immediate sampling variance may be obtained by multiplying (7) by (I -m)2 as indicated in (6). Formula (4) lies between the values with and without the immediate sampling variance.
Under exclusive uniparental reproduction, whether vegetative or by self- fertilization, the distribution of alternative genotypes may be treated by the same theory except for replacement of zN by N. Immigration pressure is the same but the sampling variance is q( I - q)/N.
THE INBREEDING COEFFICIENT
Departures from panmixia may be expressed in terms of the average in- breeding coefficient of individuals, relative to the total population under con- sideration. This coefficient has been defined as the correlation between uniting gametes with respect to the gene complex as an additive system. It has been shown that its value can be found for any pedigree by finding all paths by which one may trace back from the egg to a common ancestor (A) and thence forward to the sperm along a wholly different path. According to the theory of path coefficients, the correlation between uniting gametes is the sum of
contributions from all such paths (WRIGHT 1921, 1922b). F = [ ( I / Z ) " ~ + ~ ~ + ~ ( I
+
F A ) ]where F and F A are the inbreeding coefficients of the individual and of a
The inbreeding, measured by F, may be of either of two extreme sorts: sporadic mating of close relatives with no tendency to break the population into subgroups, and division into partially isolated subgroups, within each of which there is random mating. The latter is the case in which we are primarily interested here. Assume that there are K subgroups each of size N. The pro- portion of heterozygotes within a subgroup is zq’(1-q’) where q‘ is the gene frequency in the parental generation, including immigrants.
The variance of the gene frequencies of the subgroups, not allowing for accidents of sampling in the last generation, is
U
(1 2)
(13) u:t = q t ( I
-
q t ) F from (9) and (12).yt = 2qt(1
-
qt)-
2u$ from (IO) and (11)This formula does not allow for the contribution t o variance due t o acci- dents of sampling in the last generation. Thus it gives u$=o instead of a;=qt(1-qt)/aN f o r ~ F = o . To compare with (7) it must be divided by
(14) (15) (16)
U: = qt(I
-
qt>F/(I-
m)’F = (I
-
m)2/[2N-
(2N-
I ) ( I-
m>2] m = I-
d 2 N F / [ ( 2 N-
I ) F+
I ]from (14) and (7)
(17) 0: = q,(I
-
qt)[(2N-
1)F+
I ] / ~ N .The formula F = 1/[4Nm+1] given in a preceding paper (DOBZHANSKY and
WRIGHT 1941) is a satisfactory approximation if m is small.
ISOLATION BY DISTANCE 1 1 7
LOCAL INBREEDING I N A CONTINUOUS AREA
A t the opposite extreme from the island model is that in which there is com- plete continuity of distribution, but interbreeding is restricted to small dis- tances by the occurrence of only short range means of dispersal. Remote popu- lations may become differentiated merely from isolation by distance (WRIGHT
Each individual has its origin a t a particular place. Assume that its parents originated a t distances from this place with a certain variance both in longitude 1938, 1940).
Go
metes
Zyqotes
Gamete3
Pro
ba
bif
i t y
0
0
(N-1)
/
CJ
and in latitude. If the same condition held in preceding generations, the grand- parents originated a t distances with twice this variance in longitude and in latitude and the ancestors of generation K originated a t distances with K times this variance in both directions. The parents may be considered as if drawn a t random from a territory with a certain radius R and effective popu- lation size N. The ancestors of generation K may then be considered as drawn similarly from a territory of radius
d E
R and effective population size KN. We shall use the term parental group for the population (effective size N) from which the parents of an individual may be considered to be drawn; the term random breeding or panmictic unit will be used for any local population of the same effective size as the parental group.rate [(N+ I )
-
d m ] / 2 N either in a population of size N equally divided between males and females or in a population of N monoecious individuals in which self fertilization does not occur. As the latter formula may be written[1-(1/2N).
. .
]/zN the difference is ordinarily negligible (WRIGHT 1931).The inbreeding coefficient of individuals in such a population can be cal- culated from its definition as the correlation between uniting gametes. Let F,
be the correlation between random gametes drawn from a population of size
xN and use primes to indicate preceding generations as in the text figure (p. I 17).
The inbreeding coefficient itself would be Fl in this terminology. The values of these coefficients can be expressed in terms of coefficients for preceding generations by tracing all connecting paths and noting that the path coeffi- cient b, relating gamete to parental zygote, has the value d(1+F‘)/2 and that the path coefficient, a, relating offspring zygote to one of the gametes that produced it, has the value .\/I/[z(I+F)]. The compound coefficient ba’=+ (WRIGHT 1921). It may easily be seen that (8) can be deduced a t once from these considerations.
I n the case of continuity
gN
-
IF,”‘ etc. I
+
F”’[F,” =
-&-)
+
gN
(19) Thus
F = I
+
F’2N
+E{
N
+ . . .
I>
* If the same population structure has continued indefinitely, primes may be dropped.
F=(G)[I+~(F)+~(Y)(I~I;~~_~)
+L(y)(y)(y)...].
4ISOLATION BY DISTANCE
(21) F
='Et/
1 [zN-
'gt](X
-
I ) N-
Itx = t (x-1).
xN ( 2 2 )
Let t(x-0.5)= (t,+t(,-l))/z and A t ( x - ~ . 5 ) = tx- t(x--l) At(x-o,6) 2(N
+
11
- = -
t (x-0.6) N ( Z X
-
I)-
I (23)If the values of t are treated as ordinates of a curve with abscissas x, we may write t and x in place of t(x-0.5) and ( x - o . ~ ) , respectively. The following then hold approximately
2(N
+
11
_ -
d t
(24) -
Z N X
-
It = C x - -
( 2 5 )
(
:N)(N+l)'N a( 2 6 ) t = tdx approximately
K2-1 K2-0.5
K -0.6
1
The value of the constant C can be obtained by equating actual and esti- mated values of t. Estimates for all but the first few terms in the series are in close agreement. Thus if N = I O
Actual series [1+.45+.285+.206625+ * *
.
]Estimated series C[1.05805+.47969+.30423+.22067+ * * ]
The estimated value of C from the first term is .9451, from the second term .9381, from the third term .9363. The limiting value is .935774. The value of
C approaches I as N increases. Thus for N = 100, C = .994157.
Estimates of
C?-'t
directly from (27) are not good approximations, but most of the error is in the first few terms. Good estimates can be made by using the actual values f r o m ( 2 2 ) for these terms and the estimates from ( 2 7 ) for thelater terms. For N = IO
Actual ( 2 2 ) Estimate ( 2 7 ) Error of Estimate
5t
1 * 73500 I . 86782+.
13282kt
.79002 79250+
.00248Ft
*99511 * 99541+
.000301u
E t .57228 .57228
+
.
00000A priori, one would expect F to approach I as a limit as the size of population
is increased without limit. This requires that C T t approach N. Trial for values of N from I O to IO,OOO indicates that this is actually the case and thus gives a
good check on the theory. Following are examples:
N = I O
N = 20 N = s o N= IO039 9
t from ( 2 2 ) 3.52013 3.86519 4.09266
Et
2.7971 1
m m
t from ( 2 7 ) 6.47987 '16.13481 45.90734 t 97.203
10.0c000 2o.occco 50.00000 IC0 .coo
10 P
40
LOCAL INBREEDING ALONG A LINEAR RANGE
I n a species with an essentially one dimensional range (parents drawn from the whole width) the extent along the range from which the ancestors of generation K , a r e drawn is proportional to
v%
as with area continuity, but the effective size of the corresponding population is N instead of KN. By analogous reasoning(28)
F
= t / ( z N - t) whereE t = [ I + 2 ( y ) + -& -)
( N - I
G N - 1
d/zN
)-.I
At(=-0.6) z N ( v ' F T
-
d:)
-
2_ .
(30) ~ =
t(x--0.6) N(v'=
+
t/X)
-
ITreating this expression as the slope a t the mid-interval and replacing (x-0.5) by x
= -
Z N X [ I
-
1/(32x2)+
e-
] -
d
F
Ignoring 1/(32x2) and smaller terms in the brackets, this yields
( 3 2 ) t = Ce-2'/z/N[d/x
-
(I/~N)]-~~+(~/N)*I.
This seems to be as accurate an approximation as is warranted after replace- ment of A t / t by dt/tdx.
Comparisons of actual and calculated values of t indicate that estimates of
ISOLATION BY DISTANCE 1 2 1
40th terms). For N = 100, C = 1.01465 (from 9th and 10th terms). For larger
values of N, especially if x is I O or more, it may be sufficiently accurate to take
dt/tdx as
-
(N+z&)/zNx, C = I(33) t = e-24X/N/d\/x approximately.
I n this case
(34)
The value of can be approximated by finding actual x y t from ( 2 9 ) ,
estimating
xk-’
from (34) and multiplying the latter by the mean ratio of t from (32) to that from (33). Calculation ofZTt,
N = IO, by this method (by steps) gave 10.008 (instead of theoretical IO) and for N = I O O gave 100.07 instead of theoretical 100. These theoretical values are on the assumption thatthe limiting value of F is I which again is seen to be verified.
CORRELATION BET WEEN ADJACENT INDIVIDUALS UNDER
UNIPARENTAL REPRODUCTION
The effect of isolation by distance on the frequencies of two alternative types in a population with exclusive uniparental reproduction can be treated simi- larly, again assuming that there are no complications from other factors. The treatment, however, cannot be in terms of the inbreeding coefficient. Let E be the correlation between adjacent individuals, and assume that there is short range dispersion in each generation such that individuals are derived from a parental group of effective size N . With area continuity, the ancestors of the Kth generation are drawn from a population of effective size KN. The correlation between adjacent individuals can be analyzed into two compo- nents, that due to the chance, I/N, of derivation from the same parent and that due to the chance ( N - I)/N, of derivation from different individuals of the group, the correlation between which may be represented by E2’ in analogy with Fz’ in the case of biparental reproduction. This in turn can be analyzed into a component due to the chance 1/2N of derivation from the same in- dividual of the second preceding generation and that due to the chance
(2N- 1)/2N of derivation from different individuals of this group, the cor- relation between which may be represented by E:’.
I N - I
I
E = y + - - - - E2’ N(35)
I 2 N - I
1
E 2 ’ =%+--
E3” 2NI
I 3 N - II
E,”-
-3~
+-
E4’” etc.1.00 I 1
1.00
.40
.20
0
&/K; I
I I O I 0' I o3 IO'
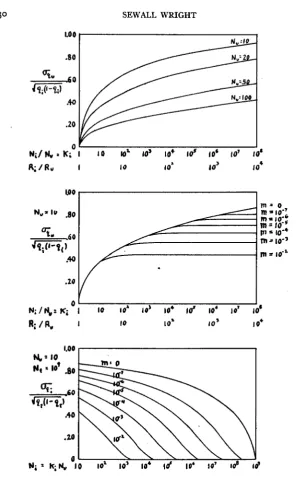
Figures I to 3. Variability of gene frequencies of local populations within a continuously inhabited
area that extends indefinitely in all directions. It is assumed that there is no appreciable long range dispersal or mutation. Each curve applies to a particular size (Nu) of random breeding unit and thus to a certain amount of short range dispersal. Variability is measured by
. Y J ~ G G )
where qx represents the gene frequencies of the subgroup in question and qy that of the compre- hensive population.ISOLATION BY DISTANCE 123
Again we may drop primes if the same population structure has continued for a large number of generations.
E =
N [I
+
(y)
+
(?)(?!$.)
(37)
+
L(y)(%-L)(!Fg). .
.I.
4
E =
E
t / NThe series
xt
is the same as encountered in the case of biparental reproduc- tion, but the formula for E differs from that for F. I t resembles it in approach- ing I a s a limit, as is to be expected a priori, but for a given N, E is about twice as great as F for small values ofEt,
and the difference from the limit is only about half as great ifEt
is close to I . These relations are illustrated in figures 7 and I dealing with uniparental and biparental reproduction, respectively. I n the case of linear continuity and derivation of individuals from a parental population of N, the effective size of the population of the Kth ancestral gen- eration is -\rK N, again as under biparental reproduction. By analogous reason- ing E = x t / N whereEt
is the same series as in the biparental case. The relation of E to F for the same N is similar to that described above in the case of area continuity.RANDOM DIFFERENTIATION OF PANMICTIC UNITS I N A CONTINUUM
Returning to biparental reproduction, the situation in a random breeding unit imbedded in a continuous population of defined size may be compared in some respects with that in an “island” whose population is replaced to such an extent in each generation by migrants representative of the whole that the inbreeding coefficient of individuals is the same. There is the important differ- ence that adjacent groups should be closely similar in the former but uncor- related in the latter. Nevertheless the amount of differentiation among groups taken a t ravzdom from the whole should be the same in both cases since equa- tions (9) to (I 7) apply in both. It is most convenient to use &= gq/.\/qt(I -qt)
(from (13)) to measure this differentiation. It should be noted that this ex- cludes the variability due to the immediate effect of sampling.
The theoretical variabilities of random breeding units of various sizes (IO
t o 10,000) within populations up to 108 times the size of the units (or 104 times
the radius), continuous in all directions, are compared in figure I . I n interpret- ing this variability, it may be noted that if q t = & , a value of
&
(ordinate)K , is the average number of generations of separate ancestry of random individuals of the popula- tion Ni.
FIGURE z (middle).-The variability of gene frequencies (q,) of populations of a given size, NI=1o4, within areas up to 104 times their radius (Rt/Ri) or ro8 times their population size (Nt/Ni). Note the similarity to Figure I .
124 SEWALL WRIGHT
greater than .577 means a U-shaped distribution of gene frequencies and thus very great differentiation. The situation is similar to that found where Nm is less than 0.5 in the island model. There is important differentiation down to a t least
a=
. 2 2 (equivalent to N m = 5). There is only slight differentiationif
4%
is less than .07 (equivalent to N m = 50) ( c j . fig. I , WRIGHT 1940).It is apparent from figure I (this paper) that there is a great deal of local
differentiation if the random breeding unit is as small as IO, even within a
territory the diameter of which is only ten times that of the unit. If the unit has an effective size of 100, differentiation becomes important only a t much
greater relative distances. If the effective size is 1000, there is only slight
differentiation a t enormous distances. If it is as large as 10,000 the situation
is substantially the same as if there were panmixia throughout any conceivable range.
The situation is very different as may be seen from figure 4 in a species whose range is essentially one dimensional (for example, a shore line). Different alleles may approach fixation in different parts of a range only IOO times the
length of the random breeding unit if the effectivc size of the latter is less than
100. The range must be about 1000 times the length of the unit if the latter
has a size of 1000 and about 10,000 times its length if the size of the unit is
10,000 to give this result. This difference between area and linear continuity
has been suggested on a priori grounds by THOMPSON (1931) in connection with a study of the correlation between water distance and amount of differ- entiation within species of fish.
RANDOM DIFFERENTIATION I N A HIERARCHY OF SUBDIVISIONS
The attempt to apply these conclusions to actual cases is hampered by the difficulty of determining what are the random breeding units and their effective sizes. To obviate this, we should find how groups of any arbitrary size vary within a more comprehensive population.
Consider a total population, size Nt, subdivided into H groups of intermediate size Ni and these in turn subdivided into K random breeding groups of size Nu. The inbreeding coefficient of individuals is zero relative to the unit groups, Fi relative to the intermediate groups and Ft relative to the total. Both H and K, in contrast with Nu, will be treated as large numbers.
The variance of the gene frequency (qu) of unit groups within the inter- mediate groups is given by (17) using the proper subscripts. The average value of this variance will be represented by ui.i. The variance of the mean gene frequencies of the intermediate groups in the total will be represented by
ISOLATION BY DISTANCE
1.00
.so
-60
5"
Jp,(l-gi)
40
.20
0
K;
N;": L: / L , I I O I oA I 0' I os
.40 I I
Figures 4 to 6. Similar to figures I to 3, respectively, except that a linear range (such as a shore
line) is postulated.
FIGURE 4 (top).-The variability of gene frequencies (qu) of the random breeding units them- selves, within ranges up to 104 times their length (Li/L,) or population (Ni/Nu).
FIGURE 5 (middle).-The variability of gene frequencies (si) of populations of a given size, Ni= 104, within ranges up to 104 times their length (Lt/Li) or population (Nt/N,). Note the dis-
similarity to figure 4 in contrast with the similarity of figures I and 2.
I 26 SEWALL WRIGHT
2
(43) Equating (40) and ( 4 ~ ) ui.t=qt(I-qt) [Ft-Fi]/[1-Fi].
This demonstration involves the assumption that there is inbreeding rela- tive to the intermediate groups because these are subdivided. It may be noted that the same value of u:.~ may be derived as follows without this assumption. (44) From (9) Y t = 2qt(1
-
qt)(I-
Ft).But yt is also the average heterozygosis of the intermediate groups
H
Yt = [2qi(1
-
qi)(I - Fi)]/H (45)I
2
(47) From (45) and (46)
(48) From (44) and (47) uy.t = qt(I
-
qt)[Ft-
Fi]/[1-
Fi]. Yt = 2 [I-
Fi] [qt(I-
qt) - u i . t ] .I n neither demonstration is there any-assumption as to the geographic dis- tribution of the values of the mean gene frequencies, qi, within the total. They may be distributed a t random as implied in the island model or there may be gradients as expected with continuity.
The quantity
ui.t
= -\/qt(l - qt)
may be used as an index of the amount of differentiation among populations of any size Ni within a more comprehensive population (Nt). The variabilities of populations of effective size Ni= 10,000 are considered in figure 2 (area con-
tinuity) and figure 5 (linear continuity). I n the case of area continuity the curves are somewhat similar to those shown in figure I for unit groups. It
appears that populations of 10,000 (or any other size) exhibit about the same
amount of differentiation within a whole whose population is a certain multiple
of their own as the unit groups exhibit in a population that is the same multiple of their size. Whatever t'he size of the subpopulations considered the varia- bility depends on the size of the inbreeding unit. There is an important amount of differentiation among large regions if the unit group is as small as IO, appre-
ciable differentiation if the unit group is as large as IOO but little if it is as large
as 1000. It should be said that there are important qualifications if there are
ISOLATION BY DISTANCE 1 2 7
The situation differs considerably in the case of linear continuity. Groups of size Ni= 10,000 approach the limiting amount of differentiation within popu-
lations only three times their length of range if Nu= IOO or less. There must be
virtually complete fixation of one allele or the other over long distances with only short regions of transition. If Nu= 1000 there is relatively little differ-
entiation within Io-fold lengths (that are heterallelic a t all) but an approach t o
IOO percent differentiation in Ioo-fold lengths. Thus transition regions are of
the order of I O lengths. If Nu = 10,000, the transition regions are of the order
of 103 lengths, and such groups approach IOO percent differentiation within 104
lengths.
The interpretation of figures I , 2 , 4, and 5 is somewhat complicated by the
fact that these do not measure variability on a constant scale. The denomi- nators of the ordinates (namely,
4-
in 2 and 5 ) increase with the abscissas. The tendency toward fixation of large populations means that a t the lower abscissas the average value of qt must be close to o or I , making\/qt(I-qt) small. The structure of a population is exhibited in perhaps the most easily interpreted form by considering a constant comprehensive pop- ulation Nt and showing how much differentiation there is among subdivi- sions of all sizes from the random breeding units up to major subdivisions ( g q i / d q t ( I - q t ) plotted against Ni). Here the denominator is constant so that variability is always on the same scale.
Figure 3 shows that with area continuity, the amount of differentiation falls
off slowly with the size of the subdivision considered. If Nu= I O and Nt is 109
(or any other size in the absence of other factors) there is marked differentia- tion among populations that are I O percent of the total, although much less
than among subdivisions of smaller sizes. If N u = 100, there is only moderate
differentiation among the smaller subdivisions and very little among ones that are as large as I O per cent of the total. I n the case of linear continuity (fig. 6)
there is virtually complete fixation of all subdivisions up to I O percent of the
total if Nu is 100 or less. If, however, Nu is 1000 there is a considerable propor-
tion of these unit groups that are not fixed ( u Q u / d q t ( I -qt) = .87). The differ- entiation among larger populations up to N ~ = o . I N, is not appreciably less than among the unit groups. If N u = 10,000,
u q u / d G )
is only .IO, butthis index is practically as great among larger populations up to I O percent of
the total. Thus with linear continuity most of the differentiation is that among large subdivisions of the total (of the order of I O percent of its size). With area
continuity, differentiation is more uniformly distributed a t all levels.
28 SEWALL WRIGHT
COMPLICATING EFFECTS OF MUTATION AND LONG RANGE DISPERSAL
The foregoing theory indicates the possibility of an approach to fixation of different alleles in large areas of the same continuous population without the help of any differential action of selection. It is obvious, however, that this very slow process would be greatly affected by other factors that change gene frequency. The very fact of persistence of more than one allele over a long period of time tends to indicate that such factors are present in some sort of balance. Thus there may be reversible mutation, selection opposed by muta- tion or selection against both of two homozygotes. Moreover, the short range means of dispersal that have been postulated are likely to be supplemented by occasional long range dispersal. All of these tend to prevent fixation of one type even locally. On the other hand, selection may favor one allele in some places and others in other places. This would tend to increase local differentia- tion. It is necessary to consider how such processes affect the situation.
It will be well to review first the joint effects of recurrent mutation and long range dispersal in the case of the island model (WRIGHT 1931). The rate of change of gene frequency under recurrent reversible mutation varies linearly with the gene frequency: Aq=v(I-q)-uq= -(u+v)(q-$) where v is the mutation rate to the allele in question, U is the rate of mutation from it and $( =v/(u+v)) is the value of q a t equilibrium, which is the same in this case as
9
the mean value of q. This is similar in form to the expression for the effects of long range dispersal: Aq= -m(q-q,).If both processes are occurring, the expressions merely need to be added: (49) Aq =
41
-
q)-
uq-
m(q-
qt) = - (m+
U+
v)(q-
$1
where
;1
=4
= (mqt+
v)/(m+
U+
v)for a local population in which
9
is not necessarily the same as gene frequency for the whole species (qt), since other factors may be a t work in other localities. The long time distribution for such a population is approximately( 5 0 ) 4(q) = Cq4N(mqt+v)--l (I --q)4Nb(l-qt)+ul--l
( 5 1 ) uq2 = q(1
-
4)/[4N(m+
U+
v)+
I].
If conditions are the same in all islands, q=qt=v/(u+v) and the variance qt(I-qt)/[qN(m+u+v)+1] is not only the long time variance for a single island but also the variance of q, a t any time, among the islands.
The variance of subpopulations (inbreeding coefficient Fi) in a total rela- tive to which the inbreeding coefficient is Ft has been given (43, 48) as qt( I
-
qt)[Ft- F~]/[I - Fi] applicable t o any case, including both the island model and that of a continuous population with only short range dispersal. The effective value of the immigration index in the latter may be obtained by equating with the expression for uq2 given in ( S I ) .ISOLATION BY DISTANCE 129 A t first sight it might appear that the rate of change of gene frequency in cases in which there is long range dispersal and reversible mutation (joint coefficient ml) in addition to predominant short range dispersal (coefficient m2 from (52)) might be obtained by simply adding the contributions from these sources a s calculated from their effects by themselves. This, however, overlooks the likelihood of an important interaction effect. It is necessary to
go back t o the formula for the correlation between uniting gametes (IS) and determine how it is affected by mutation and long range dispersal.
Assume that the proportion ml of the gametes represent a random sample from the whole species. The identity of the theories of long range dispersal and mutation make it possible to let ml here represent (m+u+v) of preceding formulae. Cases in which one or both of the uniting gametes are included in this proportion make no contribution to the correlation between uniting gametes. The proportion which makes a contribution is ( I -ml)z. Equations
(IS) are accordingly to be modified as follows: F = ( I - mJz - _ _
I
Fz’ = ( I-
ml)P[i(_-)+
~ F3”] etc.[
;(
I’)
+
(v)
FI’]I
+
F” 2N-
IzN zN
(5.3)
Again primes may be dropped, if the same situation has held for a long time.
I + F ( I
-
ml)4 N-
IF =
I
[?
[(I-
m1>2+
2(
7
)
( I
-
m ~ ) ~ N-
I Z N-
I(54)
+
3(&T)
-
*-
1
( 5 5 )
(56) t = C s ( I
-
m,)2x[x-
( ~ / z N ) ] - ( ” + ’ ) / ~ d x approximately. t = C ( I - m1)2x[x - ( 1 / 2 N ) ] - ( ~ + l ) / ~Kz-0.5
K i Kl-0.6
This is a less convenient expression than obtained where m l = 0, but approxi-
mate values can be obtained by taking values of K a t short enough intervals, finding
1
K2--0.5
[
sK+r5(1 - mJ2“dx][
Cs
[x-
( ~ / z N ) ] - ( ~ + l ) / ~ d xK1-0.6
and correcting according t o the percentage error where both factors are of; the form [S,legxdx] with the R’s chosen so as to give the same ratios of terminal ordinates.
1.00
.so
9"
6 o.Ip,o
.w
.20
0
N;/N, * K; I I O ioa IO' IO+ io5 IO' IO' IO'
& / R " I IO IO' IO' 10'
.60
Jq,LI-9(
1.U
0
N;/%: K;
m
I 1
I IO IO' IO' IO+
rd
IO' IO' IO'& / A , 1 IO 10% 10' I 0'
1.00 r
FIGWEE 7 (top).-Similar to figure I except that exclusive uniparental reproduction is assumed.
N. is the population size of the group from which the parents of adjacent individuals are drawn a t random and thus measures the extent of dispersal. The curves show the variability of gene frequencies (4) of such unit groups within areas up to IO* times their radius (Ri/RU) or 1 0 s times
their population (Ni/Nu). Each curve applies to a particular extent of short range dispersal.
ISOLATION BY DISTANCE 131
Figure 8 shows how rqu/dqi(i-qi)=.\/Fi, for parental populations of size N u = IO, rises with the size of the population ( N i = KN,) in the presence of
random replacement (ml) in the proportions IO-’ to IO-^. The variability of
the unit population is substantially the same as if there were no mutation or long range dispersal if Ni is less than I/ml, but rather abruptly approaches a limit in larger populations. Instead of approaching I as when ml=o,
d E
approaches 0.81 if ml=lo-’, 0.76 if m l = ~ o - 6 , 0.70 if m l = ~ o - s , 0.63 if ml
= IO-^, 0.55 if m l = IO-^, and 0.44 if m l = IO-^.
Figure 9 shows how the variability of subpopulations of any size Ni within a total population of size 109 is affected by the value of ml. I t is again assumed
that short range dispersal is such as to give N u = IO. There is very little differ- entiation in this case of subpopulations larger than 30/ml. I t is clear that it requires only a small amount of long range dispersal or mutation to prevent the differentiation of large populations.
The amount of differentiation of populations, that are a given multiple (Ki) of the unit population, falls off rapidly with increase of Nu. But the multiple beyond which differentiation virtually ceases is largely controlled by the factor (1-m1)~ and is thus nearly the same for all values of Nu under which there is any appreciable differentiation a t any level. The value of ( 1 - m 1 ) ~ ~ is reduced
t o approximately I O per cent of its value each log,Io/aml generations (assum-
ing ml to be small).
Among populations of a given absolute size (Ni) there is, therefore, a certain range of dispersal (determining Nu) that is most favorable to differentiation in a continuous population. On the one hand, if the range of dispersal is such that Nu is larger than 1000, there is very little differentiation, but on the other
hand, if Nu is so small that there are more than 3/”1 random breeding units in the population under consideration, there is also virtually no differentiation. Linear continuity may be treated similarly, by multiplying the terms of
Under exclusive uniparental reproduction, the chance that an individual is derived from the parental population without mutation is (I-ml), instead of (I -ml)2. Each term in the series t is accordingly to be multiplied by ( I
-
ml)x.The formula for the distribution of gene frequencies among subpopulations of a given size, Ni, in the total Nt, may be written approximately as follows: (32) by (1 -mdZx.
( 5 8 ) 4(q) = Cq[(l-Pt)/(Ft-Fi)lst--l ( I - q) [(l-Ft)/(Ft-Fj)I(l-st)-l.
Here the F’s incorporate the effects of mutation and long range dispersal as
up to 104 times their radius or IO* times their population size. The highest curve (m=o) is the same as the highest curve in figure I .
RGURE 9 (bottom).-The effect of occasional long range dispersal or mutation (rates up to
10-3 on the variability of gene frequencies of populations of any size, Ni, within a region with
a population of a given size, N L = 108. The random breeding unit is assumed to be N u = IO. The
132 SEWALL WRIGHT
well a s of short range dispersal. This distribution has the mean qt and the variance qt(1- qt)[Ft- F~]/[I
-
Ft] derived above. It differs considerably from the distribution(59)
if m2 is the estimate of effective m from ( 5 2 ) based on the value of Fi and Ft
under short range dispersal in the absence of other factors. It is legitimate, however, if ml is known, to write +(q) in the form of (59) with the under- standing that m2 measures the effect of short range dispersal in the presence of the other factors measured by ml with full allowance for the interaction effect. Indeed this seems to be the only practicable method to use in analyzing data from actual populations in view of the fact that no ideal model such as area or linear continuity is likely to be exactly realized.
THE EFFECTIVE SIZE O F INBRED POPULATIONS
The effect of inbreeding on the effective size of populations is a matter that requires some consideration. Size of population enters into the formulae for the distribution of gene frequencies principally through the sampling variance which is q( I
-
q)/2N in a random breeding diploid population. Assume thatindividuals have an inbreeding coefficient Fi relative to an island population. It makes a difference in the sampling variance whether this is due to mating of relatives, not resulting in any territorial subdivision, or whether it is due t o partial isolation of subdivisions that breed a t random within themselves. I n the former case, the increased frequency of homozygotes causes an in- creased sampling variance of the whole island. If there were nothing but homo- zygotes, (qiAA+(I
-
qi)aa), as under long continued self-fertilization, the sampling variance would be qi(1 -qi)/Ni, twice that under random mating. With random bred and inbred components in the array of equations (9) in the proportions ( I-
Fi) to Fi, the sampling variance would be the weighted aver-age.
If on the other hand, the island population is subdivided into partially iso- lated groups that breed a t random within themselves and if each group tends to maintain its numbers (that is, there is’no intergroup selection) the sampling variance of the total island population is less than if there were random mating throughout. I n each subgroup, the sampling variance is q,’(I
-
q,’)/2Nu, aver- age U26q,=c~qu’(I -qu’)/2N,K. The sampling variance for the mean gene fre- quency of the island would be u2aqi = a26,,/K = x y q u ’ ( I-
qu’)/zNiK if NiISOLATION BY DISTANCE I33 The situation in an arbitrarily delimited region in a continuum resembles the second. Effective N in such a formula as (59) is thus KN,/(I -Fi).
COMPLICATING EFFECTS OF SELECTION
Consider next the complications introduced by selection. The effects of vari- ous kinds of selection on gene frequency (contributions to Aq) and the form taken by +(q) on substitution in (I) have been discussed in previous papers
(WRIGHT 1931, 1942). These are applicable directly to the island model. The case of arbitrarily delimited portions of a continuum can be treated in the same way, but if so, m2 of formula (59) includes the interaction effect of selection as well as of mutation (and of long range dispersal if this can be dis- tinguished from the short range dispersal). The index m2 is to be interpreted as the effective amount of replacement of the subpopulations in question by representatives of the species as a whole under the conditions of mutation and selection that actually hold. As noted in connection with the complications in- troduced by mutatipn and long range dispersal, this seems t o be the most practicable method of dealing with concrete data. I t is important, however, to determine the theoretical relations between the values of m among subdivi- sions of different sizes under various ideal population structures.
For such theoretical consideration of the interaction of selection with the effects of short range dispersal, it is necessary to return to the derivation of F by path coefficients (IS) in analogy with the treatment of the complications due to mutation and long range dispersal (53). But in attempting to carry out the analogy we encounter a serious difficulty.
Long range dispersal (by definition) and mutation may be treated as intro- ducing a random admixture into the local population in constant proportion ml. Selection may also be treated as introducing a certain random admixture, but it is not in constant proportion. The amount of such admixture in the case of mutation and long range dispersal may be represented as
(62)
[-
Aq/(q -411
= (m+
U+
v) =m.
This formula may be applied where Aq also involves selection pressure. Con- sider the case of a balance between opposing pressures of mutation and selec- tion in the simplest case, that of no dominance, and assume that the same situation holds throughout the species.
(63) Aq = V ( I
-
q)-
sq(1-
q) =-
s( I - q)(q-
4)
where;1
= v/s (64)The joint effect of mutation and selection in this case is equivalent to im- migration of a random sample, but to an extent that is a function of the local gene frequency. A rough idea of the effect may be obtained by substituting
4
for q and treating ml=s(1--)=s-v as a constant. If s is much larger than v we may indeed simply take m l = s and use (I - s ) ~ in place of (I -m# in the theory developed for mutation and long range dispersal. Inspection of figures 8I34 SEWALL WRIGHT
would occur within the continuous population under the specified conditions if there were no complication of this sort.
As another example consider the case of selection against both of two homo- zygotes. Representing the relative selective values of AA, Aa and aa by
I
-
SAA, I and I-
saa respectivelyWhile selection does nothing to local populations that have become fixed and the equivalent immigration index ml is accordingly o if q is either o or I , the average value may well be such as to severely restrict differentiation of even rather small subdivisions of a continuous population. Again a rough idea of the effect may be obtained by substituting i$ for q. It should be noted that
if there are numerous alleles and selection for heterosis is general, selection tends to increase differentiation.
I n a recent paper (WRIGHT, DOBZHANSKY and HOVANITZ 1942) an attempt was made to interpret the frequencies of lethals in a continuous population of
Drosophila pseudoobscura on Mt. San Jacinto. The following formula was ar- rived a t for the rate of change of the frequency of a typical lethal gene.
where is the mean mutation rate per generation,
s
the mean selective dis- advantage of heterozygotes,9
the mean gene frequency, F the inbreeding coefficient, and m the effective immigration coefficient of the territory under consideration. It was shown that approximately the same variance of gene fre- quencies was reached by replacing the above expression by one in which the component of Aq, measuring the tendency toward increase of gene frequency- namely, (V+mq) (I-q), is balanced by the linear expression that gives the same mean a s the correct expression namely, - (v+mq) (I-
@q/q(68)
(69)
Aq =
-
(m+
V/q>(q-
q)
approximatelyml = (m
+
?/q)
approximately.DIFFERENTIATION O F SUBDIVISIONS BY SELECTION
If selection acts differently in different regions, it is obvious that none of the formulae given here apply t o the distribution of values q among these re- gions, but only to the long term distribution within single ones. As a basis for discussion consider the following simple case, which refers to rate of change of gene frequencies in an island as affected by the local conditions of selection measured by s (assuming no dominance) and the amount of immigration meas- ured by m (WRIGHT 1931, 1940).
ISOLATION BY DISTANCE I35 I n a local population in which s (whether plus or minus) is smaller in abso- lute value than m, gene frequency can depart only slightly from the average of the species ( q = qt+(s/m)qt(I
-
qt)) approximately. Crossbreeding here swamps the tendency toward selective differentiation. On the other hand, local gene frequency tends to be dominated by the local conditions of selection in populations in which s is larger than m in absolute value q= I-
(m/s)( I-
qt)or q= (-m/s)qt approximately, depending on whether s is positive or nega- tive.
The effectiveness of selection here is not related directly to the size of the island population. .However, there is likely to be indirect relationship. This may be illustrated by considering three situations.
First, consider islands with various populations but the same absolute amount of immigration (as might well be the case if the areas are the same but population densities differ). Among such islands, Nm is constant. All have the same amount of nonadaptive differentiation (measured by 1/(4Nm+ I) but a given selection pressure is more effective on the islands with larger population (and hence smaller m) than among those with smaller populations.
A second situation is that in which size of population is proportional to area and the number of immigrants is proportional to the extent of boundary (Nm o(
dN).
Here there is more nonadaptive differentiation on the smaller islands and more adaptive differentiation of the larger ones, although the latter effect is less marked than in the preceding case.Finally, if both size of population and amount of immigration are propor- tional to the area (m constant), there is markedly more nonadaptive differ- entiation on the smaller islands but no relationship between adaptive differ- entiation and size of population.
Summing up, any sort of differentiation is favored by small m, but the large populations tend on the whole to exhibit predominant adaptive differentiation, while the smaller ones exhibit predominantly nonadaptive differentiation.
The situation in a continuous population is similar in that nonadaptive differentiation should be most conspicuous locally and adaptive differentiation among larger subdivisions. The most significant thing, however, given a cerz tain amount of differential action of selection, is the size of the random breed- ing unit. If this is large-for example, over 1000, very little nonadaptive
differentiation is to be expected and only rather strong differences in the action of selection avoid swamping. If on the other hand, there is only short range dispersal-for example, N u = IO , large regions tend to become adaptively dif-
ferentiated under the influence of slight differences in selection, and superim- posed on this should be a large amount of nonadaptive differentiation of small regions. The maximum amount of nonadaptive differentiation among popula- tions of a given size however, is not found with the smallest Nu, but a t a certain optimum value.
136 SEWALL WRIGHT
ing on the model that is most appropriate. With such differentiation occurring simultaneously but more or less independently in all series of alleles, each local- ity would have a slightly different genetic system from every other locality. These systems may be expected to differ in their success in meeting the en- vironmental conditions. Among those which are relatively successful, adapta- tion is likely to have a slightly different basis in each case. The populations with such systems tend to become denser and to send out more than their share
of migrants and thus enlarge in extent. Each would tend to perfect the line of adaptation on which it had started. Thus permanent differential action of selection would soon be brought into play in spite of the postulated uniformity of the conditions.
The expansion of centers of population characterized by certain genetic sys- tems and contraction of those characterized by other systems is the process of intergroup selection referred to in the opening paragraph. The genetic system, including its state of heterogeneity as well as its central type, is the basis of selection instead of merely the net favorable or unfavorable effect of each single gene, which is the only basis for selection under panmixia; or the single geno- type, which is the most probable basis under self-fertilization or vegetative multiplication. The present analysis indicates that this most favorable basis for evolutionary advance of the species as a whole may be present under certain conditions in a continuous population a s well as in one consisting of partially isolated groups.
SUMMARY
Formulae are derived relating the variance of the gene frequencies of sub- groups (ut) to the effective population number of these (N), the effective proportion of replacement per generation by immigrants (m), the inbreeding coefficient of individuals relative to the total population (F), and the mean gene frequency in the latter (qt). Thus u ~ = q t ( ~ - q t ) / [ z N - ( 2 N - ~ ) ( ~ - m m 2 ) ]
= qt( I
-
qt)F/( I - m)z including the immediate sampling variance, butut = qt( I
-
qt) F excluding this.The effect
df
isolation by distance in a continuous population in which there is only short range dispersal in each generation is worked out on the hypothesis that the parents of any individual may be treated as if they were taken a t random from a group of a certain size (N). It is shown that the inbreeding co- efficient of individuals in such a population relative t o a population of size K N can be expressed in the form F = ~ ~ - 1 t / [ 2 N - ~ ~ - 1 t ] w h e r e x t is the sum of a series of terms in which t l = I and t,= t(x--l)[(x- I)N - I]/xN or approximatelyC[x- (I/ZN>]-"+~)" where C is a constant close to I. The value of
CFt
can be obtained sufficiently accurately by actual calculation of the first few terms, supplemented by the approximate formulaI I
K t - 1
2 2N 2 2N
for later terms. The limiting value
XTt
is N. Thus F approaches I in an indefi-ISOLATION BY DISTANCE I37 The preceding results apply to area continuity. With continuity in a linear range (for example, shore line), F = x t / [ z N - x t ] as above, t1=1 but t,
= t ( x - l ) [ N G - ~ ] / N v ’ x or approximatelyCe-2d“”[d\/x- ( I / z N ) ] - ( ~ * + ~ ) ” * . I n a continuous population with exclusive uniparental reproduction, the correlation between adjacent individuals is of the form E = x t / N where
xt
is the same as above for area or for linear continuity as the case may be.The variance of gene frequencies in subdivisions of any size, Ni, within a more comprehensive population Nt is given by the formula ~ 7 ? . ~ = q t ( I -qt)
[ F ~ - F ~ ] / [ I - Fi] where Fi and Ft are the inbreeding coefficients relative to the populations of size Ni and Nt, respectively.
I t is shown that in the absence of disturbing factors, short range dispersal (N less than IOO in the case of area continuity) leads to considerable differ-
entiation not only among small subdivisions but also of large ones. Values of N greater than 10,000 give results substantially equivalent to panmixia
throughout a range of any conceivable size. With linear continuity, there is enormously more differentiation than with area continuity. There is somewhat more differentiation under uniparental than under biparental reproduction.
Recurrent mutation, long range dispersal and selection are factors that re- strict greatly the amount of random differentiation of large (but not small) subdivisions of a continuous population. A term (I
-
m1)2x under biparental, ( I-
ml)x under uniparental, reproduction is introduced into the expressions for t referred to above. I n this ml=[-Aq/(q-qt)] where Aq is the rate of change of gene frequency (9) which such factors tend to bring about.The effective size of a population characterized by the inbreeding coefficient F depends on whether F is due to a tendency toward mating of relatives not associated with territorial subdivision, or to such subdivision. I n the former case the sampling variance is
&
= q ( I-
q) ( I +F)/zN, in the latter, q( I-
q)( I
-
F)/2N, in contrast with q( I-
q)/2N in a random bred population.If different regions are subject to different conditions of selection, the amounts of both adaptive and nonadaptive differentiation depend on the smallness of m (if subdivision into partially isolated “islands”) or of N, size of the random breeding unit (if a continuous distribution). If these are sufficiently large there is no appreciable differentiation of either sort; if sufficiently small there is predominantly adaptive differentiation of the larger subdivisions with predominantly nonadaptive differentiation of smaller subdivisions superim- posed on this. Even under uniform environmental conditions, random differ- entiation tends to create different adaptive trends in different regions and a process of intergroup selection, based on gene systems as wholes, that presents the most favorable conditions for adaptive advance of the species.
LITERATURE CITED
DOBZHANSKY, TH., and S. WRIGHT, 1941 Genetics of natural populations. V. Relations between mutation rate and accumulation of lethals in populations of Drosophila pseudoobscura. Genetics 26: 23-51.
138 SEWALL WRIGHT
WRIGHT, S., 1921 Systems of mating. Genetics 6: 111-178.
1922a The effects of inbreeding and crossbreeding on guinea pigs. 111. Crosses between highly inbred families. Bull. U. S. Dept. Agric. No. 1121.
192zb Coefficients of inbreeding and relationship. Amer. Nat. 56: 330-338. 1929 The evolution of dominance. Amer. Nat. 58: 1-5.
1931 Evolution in mendelian populations. Genetics 16: 97-159.
1938 Size of population and breeding structure in relation to evolution. Science 87: 430-431. 1940 Breeding structure of populations in relation to speciation. Amer. Nat. 74: 232-248. 1942 Statistical genetics and evolution. Bull. Amer. Math. Soc. 48: 223-246.
Genetics of natural populations. VII.
The allelism of lethals in the third chromosome of Drosophila pseudoobscuru. Genetics 27: 363-394.