ABSTRACT
ABU-EL-HAIJA, LENA A. PRECiSE: PancREatic Cancer Prioritization and Screening Evaluation Tool. (Under the direction of Julie Ivy).
Pancreatic cancer (PC) is the fourth leading cause of death due to cancer in the US, and it is projected to be the second leading cause by 2030. While the incidence of PC is relatively low, it has
been increasing in recent years. The mortality risk of PC is high with an 8% five-year survival rate.
PC can be asymptomatic, which often leads to late diagnosis after the tumor has metastasized to other organs. The late diagnosis was initially perceived to be due to the tumor’s rapid progression.
However, recent findings have shown that there is an average of seven years from the start of the
tumor until metastasis. This presents an opportunity for screening to detect PC patients earlier. Chapter 2 presents a discrete event simulation model of pancreatic cancer progression, where
the discrete events are (i) tumor volume at symptomatic detection, (ii) tumor volume at transition
from the local stage to the regional stage, and (iii) tumor volume at transition from the regional stage to the distant stage. The model is personalized to race, gender, and age. Surveillance, Epidemiology
and End Results data were used to parameterize the model. Pancreatic cancer is resectable if the
tumor can be surgically removed. Resection is the best option for improving survival rates. In Chapter 2, a resectability prediction tool is introduced. With resection being the only true cure for PC, there is
a call for screening policies to catch the disease at an early stage. However, current screening policies
remain nonspecific with undetermined screening start age, screening interval, and screening end age. The general population has a lifetime risk of 1.3%. However, some are at a much higher risk
than others. There are calls for PC screening of high-risk patients only rather than a population
wide screening. The International Cancer of the Pancreas Screening Consortium defines high-risk as genetic mutation or first-degree family members with PC.
In Chapter 3, we present an extension to the progression model from Chapter 2, where the risk
of a patient contributes to the incidence rate of PC. We overlay the progression model with different screening policies, where the screening start age is set at 50 years old, the screening end age is set
at 100, and the screening interval was set at half a year, a year, two years, three years, four years,
five years, and ten years. We created different homogeneous populations to study the effect of the screening policies and the effort associated with catching one pancreatic cancer by screening by
race, gender, and patient PC risk.
In Chapter 4, we expand the resectability prediction tool and integrate it with the screening
model. We test screening policies with varying screening start age, screening end age, screening
interval, and screening modality. We test the different policies on homogeneous and heterogeneous populations. We estimate the effort to screen and the average five-year survival of each policy. We
© Copyright 2019 by Lena A. Abu-El-Haija
PRECiSE: PancREatic Cancer Prioritization and Screening Evaluation Tool
by
Lena A. Abu-El-Haija
A dissertation submitted to the Graduate Faculty of North Carolina State University
in partial fulfillment of the requirements for the Degree of
Doctor of Philosophy
Industrial Engineering
Raleigh, North Carolina
2019
APPROVED BY:
Maria Mayorga Yunan Liu
Reha Uzsoy Karen Hicklin
Julie Ivy
DEDICATION
TABLE OF CONTENTS
LIST OF TABLES . . . v
LIST OF FIGURES. . . vii
Chapter 1 INTRODUCTION . . . 1
1.1 Background and Motivation . . . 1
1.2 Pancreatic Cancer . . . 3
1.2.1 Types of Pancreatic Cancer . . . 3
1.2.2 Risk Factors . . . 3
1.2.3 Pancreatic Cancer Symptoms and Diagnosis . . . 5
1.2.4 Screening Modalities for Pancreatic Cancer . . . 6
1.2.5 Resectability of Pancreatic Cancer . . . 7
1.3 Pancreatic Cancer Screening . . . 7
1.4 Problem Definition . . . 8
1.5 Dissertation Organization . . . 10
Chapter 2 SEER Based Pancreatic Cancer Progression Model . . . 11
2.1 Introduction . . . 11
2.2 Literature Review . . . 12
2.3 Methods . . . 14
2.3.1 SEER Data . . . 14
2.3.2 SEER Data Analysis . . . 15
2.3.3 Progression Model . . . 17
2.3.4 Resectability of Pancreatic Cancer . . . 24
2.4 Model Validation . . . 28
2.5 Results . . . 30
2.5.1 Growth Models Analysis . . . 31
2.6 Discussion and Conclusion . . . 43
Chapter 3 Evaluation of Pancreatic Cancer Screening Policies. . . 46
3.1 Introduction . . . 46
3.2 Literature Review . . . 47
3.3 Methods . . . 48
3.3.1 Death and Cancer Incidence Rates . . . 49
3.3.2 Screening . . . 51
3.3.3 Simulation Experiments . . . 52
3.4 Results . . . 55
3.5 Discussion and Conclusion . . . 66
Chapter 4 Pancreatic Cancer Screening and Resectability Predictions to Maximize Ex-pected Survival. . . 67
4.1 Introduction . . . 67
4.3 Methods . . . 69
4.3.1 Incidence Rate . . . 69
4.3.2 Simulation Model Steps . . . 74
4.3.3 Experiment Design . . . 78
4.4 Results . . . 78
4.4.1 Screening Policy Evaluation for Homogeneous Populations . . . 79
4.4.2 Screening Policy Evaluation for Heterogeneous Populations . . . 90
4.5 Conclusion . . . 94
Chapter 5 Conclusion. . . 97
BIBLIOGRAPHY . . . .102
APPENDICES . . . .109
Appendix A Growth Model Derivations . . . 110
LIST OF TABLES
Table 1.1 Risk Factors of Pancreatic Cancer and their Associated Relative Risks . . . 5
Table 2.1 SEER Data Summary Statistics for Pancreatic Cancer Records . . . 16
Table 2.1 SEER Data Summary Statistics for Pancreatic Cancer Records (continued) . . . 17
Table 2.2 Summary Statistic of the Resectable and Unresectable Populations Created . . 19
Table 2.3 Pancreatic Cancer Progression Model Simulation Run . . . 20
Table 2.4 Model Parameters . . . 21
Table 2.5 Comparison of the Resectability Prediction Tools . . . 27
Table 2.6 Results of the Ridge Regression and the Weight of each Patient Attribute to the Probability of Resectability . . . 28
Table 2.7 Haeno et al. Model Parameters[Hae12] . . . 30
Table 2.8 Age Percentiles by Race/Gender Group . . . 31
Table 2.9 Percentage of patients age 50 years old or younger with a tumor of a certain diameter . . . 36
Table 2.10 The Kullback-Leibler Divergence of the Fitted Models under Different Assump-tions forR . . . 42
Table 2.11 Progression Model Parameters withR with known parameters in the Orderγ, η,ω,(10−5). . . 43
Table 2.12 Distribution Parameters of Milestones from the Start of the Cancer in a Simu-lated Heterogeneous Population . . . 43
Table 2.13 Models Average Timeline in Years and Stage Distribution at Symptomatic Detection per Race and Gender Subgroups . . . 44
Table 3.1 Risk Factors of Pancreatic Cancer and their Associated Relative Risks,[Bec14] . 51 Table 3.2 The Shortest Screening Interval Under a Certain Benign to Screening Detection Ratio Threshold . . . 65
Table 4.1 Patient Survival Post Pancreatic Resection,[Roe18] . . . 69
Table 4.2 Causes of PC as a Percentage of PC Population . . . 71
Table 4.3 Diabetes and Obesity Prevalence in Population based on Race and Gender . . . 71
Table 4.4 Familial Risk Factors of PC with their Prevalence in the Population . . . 71
Table 4.5 Accuracy Measures for the Resectability Prediction Models, by Stage (%) . . . 72
Table 4.6 The Average Number of Cancer Patients per 100,000 in the Homogeneous Populations Created . . . 79
Table 4.7 Efficient Screening Policies for White Male using MRI or EUS . . . 85
Table 4.8 Efficient Screening Policies for White Female using MRI or EUS . . . 86
Table 4.9 Efficient Screening Policies for Black Male using MRI or EUS . . . 87
Table 4.10 Efficient Screening Policies for Black Females by Relative Risk using MRI . . . . 88
Table 4.11 Efficient Screening Policies for Black Females by Relative Risk using EUS . . . . 89
Table 4.12 Efficient Policies labeled with the Screening Interval, Screening Start Age, and Screening End Age with a Maximum Effort of 200 and the Corresponding Five-year Survival Rate for each Cohort . . . 89
Table 4.14 Distribution of cancer detection by stage and mechanism (%) in each cohort under common screening strategies with certain screening interval, start age (second row) and end age (third row) . . . 91 Table 4.15 Average Counts of Cancer Free and Cancer Patients at Different Ages in the
Sets of Heterogeneous Populations by Race and Gender . . . 92 Table 4.16 Average Number of Cancer Patients per 1,000,000 in a Heterogeneous Population 94 Table 4.17 Efficient Screening Policies for a Heterogeneous Population by Relative Risk
using MRI . . . 95 Table 4.18 Efficient Policies with a Maximum Effort of 200 and the Corresponding
LIST OF FIGURES
Figure 1.1 Anatomy of the Pancreas[Abo] . . . 2 Figure 1.2 Images of Pancreatic Cancer using Different Screening Modalities[LL14]. . . . 6 Figure 2.1 Box Plots of Age Distribution by Race and Gender . . . 15 Figure 2.2 Cancer Progression Model . . . 18 Figure 2.3 Flow of inputs and outputs to the prediction model . . . 25 Figure 2.4 Bar Charts of Age by Tumor Stage in the Resectable and Unresectable Groups 26 Figure 2.5 Scatter Plot of Age and Tumor Size by Stage in the Resectable and Unresectable
Groups . . . 27 Figure 2.6 Cell divisions model,n0is type 0 tumor cell and the core of the tumor,n1is
type 1 tumor cell that has metastatic ability, andn2is type 2 tumor cell that is
metastatic . . . 29 Figure 2.7 The Proportional Distribution of Volume Detection at each Stage under each
Age Group . . . 32 Figure 2.7 (continued) The Proportional Distribution of Volume Detection at each Stage
under each Age Group . . . 33 Figure 2.7 (continued) The Proportional Distribution of Volume Detection at each Stage
under each Age Group . . . 34 Figure 2.7 (continued) The Proportional Distribution of Volume Detection at each Stage
under each Age Group . . . 35 Figure 2.8 Age of Cancer Initiation Distribution with Plot Fit and Comparison to Age of
Diagnosis . . . 36 Figure 2.8 (continued) Age of Cancer Initiation Distribution with Plot Fit and
Compari-son to Age of Diagnosis . . . 37 Figure 2.9 The Probability of Detection at a Certain Volume and stage from the SEER
Frequencies, Fit withR∼Gamma and Fit withR∼Uniform . . . 38 Figure 2.9 (continued) The Probability of Detection at a Certain Volume and stage from
the SEER Frequencies, Fit withR∼Gamma and Fit withR∼Uniform . . . 39 Figure 2.9 (continued) The Probability of Detection at a Certain Volume and stage from
the SEER Frequencies, Fit withR∼Gamma and Fit withR∼Uniform . . . 40 Figure 2.9 (continued) The Probability of Detection at a Certain Volume and stage from
the SEER Frequencies, Fit withR∼Gamma and Fit withR∼Uniform . . . 41 Figure 2.10 The Timelines of First Cancerous Cell to Metastasis of Three Different Models 45
Figure 3.1 Flow Diagram of a Single Simulation Run . . . 49 Figure 3.2 SEER Incidence Rates per 100,000 for Pancreatic Cancer . . . 50 Figure 3.3 The Incidence Rate in Race, Gender, and Relative Risk Homogeneous
Popula-tions . . . 56 Figure 3.4 Frequency of False Positive Result Under Different Screening Policies . . . 57 Figure 3.5 The Proportion of Pancreatic Cancer Cases that would be Detected by
Figure 3.6 The Proportion of Pancreatic Cancer Cases that would be Detected Symp-tomatically for each Gender and Race . . . 58 Figure 3.7 Distributions of Cancer Stage at Detection Symptomatically and under
Dif-ferent Screening Intervals for White Male . . . 59 Figure 3.8 Distributions of Cancer Stage at Detection Symptomatically and under
Dif-ferent Screening Intervals for Black Male . . . 60 Figure 3.9 Distributions of Cancer Stage at Detection Symptomatically and under
Dif-ferent Screening Intervals for White Female . . . 61 Figure 3.10 Distributions of Cancer Stage at Detection Symptomatically and under
Dif-ferent Screening Intervals for Black Female . . . 62 Figure 3.11 The Number of Benign Screenings to One Screening Detection . . . 63 Figure 3.11 (continued) The Number of Benign Screenings to One Screening Detection . 64
Figure 4.1 SEER Incidence Rate per 100,000 per year for Pancreatic Cancer . . . 70 Figure 4.2 Effort against five-year survival of the different screening policies on
homo-geneous populations using MRI . . . 80 Figure 4.2 (continued) Effort against five-year survival of the different screening policies
on homogeneous populations using MRI . . . 81 Figure 4.2 (continued) Effort against five-year survival of the different screening policies
on homogeneous populations using MRI . . . 82 Figure 4.2 (continued) Effort against five-year survival of the different screening policies
on homogeneous populations using MRI . . . 83 Figure 4.3 Efficient Frontiers by Race, Gender, and Relative Risk . . . 84 Figure 4.4 Effort against five-year survival of the different screening policies on a
het-erogeneous population using MRI . . . 93
Figure B.1 Effort against five-year survival of the different screening policies on homo-geneous populations using EUS . . . 114 Figure B.1 (continued) Effort against five-year survival of the different screening policies
on homogeneous populations using EUS . . . 115 Figure B.1 (continued) Effort against five-year survival of the different screening policies
on homogeneous populations using EUS . . . 116 Figure B.1 (continued) Effort against five-year survival of the different screening policies
on homogeneous populations using EUS . . . 117 Figure B.2 Effort against five-year survival of the different screening policies on a
CHAPTER
1
INTRODUCTION
1.1
Background and Motivation
The pancreas is one of the digestive system organs that is responsible for producing digestive
enzymes and hormones, such as insulin[Abo]. Due to the pancreas location in the upper abdomen behind the stomach as shown in Figure 1.1, symptoms of pancreatic disorders can be nausea
and abdominal pain which are common to other conditions, such as food poisoning. Given the vague symptoms of pancreatic disorders, diagnosis can be a challenge. Pancreatic disorders include
acute pancreatitis, chronic pancreatitis, hereditary pancreatitis, and pancreatic cancer[Abo]. Acute pancreatitis is inflammation of the pancreas that causes a surge in the production of digestive enzymes. Chronic pancreatitis is the permanent damage of the pancreas after multiple episodes
of acute pancreatitis. Pancreatic cancer is the existence of malignant cells with abnormal growth
inside the pancreas.
The most challenging disease of the pancreatic disorders is pancreatic cancer. Pancreatic Cancer
(PC) is the fourth leading cancer cause of death in the United States, and it is projected to be the
second by year 2030[Rah14]. Pancreatic cancer has a low incidence rate; approximately 1.6% of the population will get pancreatic cancer in their lifetime[NCISP]. For 2018, it was estimated there would be 55,440 new cases of PC and 44,330 deaths due to PC with a low 5-year survival of 8.5% [NCISP].
Figure 1.1Anatomy of the Pancreas[Abo]
PC patients are diagnosed with localized disease, 30% are diagnosed with regional disease, and the
remaining 50% are diagnosed with metastatic disease[McA17]. The stage at diagnosis contributes significantly to the 5-year survival rate. The 5-year survival is 34.3%, 11.5%, or 2.7% if the patient was diagnosed in the local, regional, or distant stage, respectively. Surviving pancreatic cancer is further
complicated by the fact the only true cure for the disease is surgery (resecting part or all of the
pancreas), and it is estimated that only 10% to 20% of patients have a resectable disease at diagnosis [Hol14]. This highlights the need to detect pancreatic cancer early to increase the chance of survival [Tam14]. The goal is to detect cancer at a local or resectable state such that a cure becomes an option for the patient.
There is a debate in the literature as to whether early diagnosis of pancreatic cancer will truly
increase survival rates; whether efforts to catch the disease early would be worthwhile given the low survival rates. It was observed that within a sample of 500 patients, as expected the survival of
patients with stage I PC was higher than all other stages[Por13]. Moreover, the 1-year and 5-year survival rates for PC increased from the late 1970’s to the early 2000’s, and the increase is believed to be due to the better imaging technology and surgical methods for detecting and resecting the
cancer[Por13]. There is also discussion regarding the detection of precancerous lesions. This was deemed successful for colon cancer to surgically remove the lesions before they become harmful [Len14].
While early detection does not equal survival, there is evidence suggesting that early detection
was a factor in the increasing survival rates over the last few decades. However, the survival rates are still very low and hence the motivation for this dissertation. We aim to understand the current
status of pancreatic cancer screening and to use the available resources in the literature to develop
1.2
Pancreatic Cancer
Cancer is the abnormal growth of cells with mutation, and pancreatic cancer is the growth of
such cells within the pancreas. Similarly to colon cancer, pancreatic cysts can be precancerous
cells in some cases of pancreatic cancer, especially intraductal papillary mucinous neoplasm cysts [PRM18]. However, only 1% to 2% of pancreatic cysts become cancerous[Fou17]. In fact, when a patient presents with a pancreatic cyst, the treatment option is not always to remove it since
most pancreatic cysts have been shown to be harmless and can essentially stay within the pancreas for the rest of the patient’s life without complications[Tan12]. Given the distinctions between the problems of pancreatic cyst and pancreatic cancer, we focus on the progression of pancreatic cancer
regardless of the path to the first cancerous cell.
1.2.1 Types of Pancreatic Cancer
There are two main types of pancreatic cancer: exocrine and endocrine[Zho10]. Exocrine cells produce enzymes in the pancreatic duct, and a tumor typically develops in the duct[Ame]. Endocrine cells produce hormones, such as insulin, and there are fewer endocrine cells than exocrine cells
in the pancreas. Therefore, exocrine and endocrine cells produce different tumors, where the two
types have distinctly different biological composition and placement within the pancreas. Exocrine pancreatic cancer, also referred to as pancreatic ductal adenocarcinoma, represents about 95% of
the pancreatic cancer population, and it has a lower survival rate than the endocrine type.
1.2.2 Risk Factors
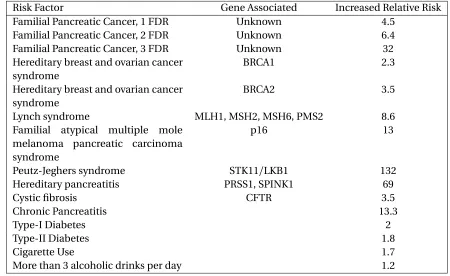
Pancreatic cancer is believed to have different causes, a summary of the risk factors along with
their risk is listed in Table 3.1. One of the main causes is genetic mutation. Some of the genes that
have been studied and found to have causal effect areBRCA1/BRCA2(hereditary breast and ovarian cancer syndrome),MLH1/MSH2/MSH6/PMS2(Lynch syndrome),TP53(Li-Fraumeni syndrome),
CDKN2A/p16(familial atypical multiple mole melanoma syndrome),STK11(Peutz-Jeghers
syn-drome), andPRSS1(hereditary pancreatitis syndrome)[McA17]. Carriers of any of these genetic mutations are considered to be at high-risk for pancreatic cancer.
Patients with first degree relatives (FDRs - parent, sibling, or child) that have/had pancreatic cancer are also considered to be at high-risk, and the more FDRs with PC the higher the risk for the patient. However, hereditary factors, such as FDRs and genetic mutations, seem to account for
only 10% of the pancreatic cancer population[McA17]. The question remains, who else is at risk for pancreatic cancer? There are other recognized risk factors that are mentioned in the literature and are believed to contribute to pancreatic cancer, such as chronic pancreatitis, diabetes, and
pancreatic cancer.
Chronic Pancreatitisis irreversible damage of the pancreas as a result of inflammation after one or more episodes of acute pancreatitis, where acute pancreatitis is an episode of inflammation
of the pancreas[Abo]. If chronic pancreatitis was due to hereditary pancreatitis (when the cause of pancreatitis is genetic instead of environmental), then it is believed that chronic pancreatitis evolves through the same mechanism that is involved in the development of pancreatic cancer [Bec14]. However, hereditary pancreatitis is very rare, where only 2% to 4% of chronic pancreatitis patients had hereditary pancreatitis[Sol93]. The most common cause of chronic pancreatitis in adults is alcohol or cigarette abuse which is also a risk factor for pancreatic cancer[McA17]. This relationship makes it difficult to determine if chronic pancreatitis itself is a risk factor since alcohol
and cigarette abuses play major roles in the development of both diseases[Dha15]. In addition, the exact mechanism that turns chronic pancreatitis to pancreatic cancer has not yet been defined [Rai10]. Raimondi et al. conducted a meta-analysis to quantify the relative risk associated with chronic pancreatitis and found that the disease increases pancreatic cancer risk by 13.3 (6.1-28.9 95% CI) fold[Rai10].
Diabetesis when the pancreas cannot produce insulin (Type I) or overproduces it (Type II).
Diabetes has been linked to pancreatic cancer. However, there is debate about whether it should be recognized as a risk factor especially given that the prevelance of diabetes is much higher than that
for pancreatic cancer. Diabetes can be an early indicator of the onset of pancreatic cancer where some studies have shown that 25% to 50% of pancreatic cancer patients have developed diabetes
6-36 months before they developed pancreatic cancer[Sal15]. The Centers for Disease Control and Prevention estimated that there are 30.2 million diabetics in the US as of 2015[Cen17a]. However, it is not clear that all 30.2 million diabetic patients are at risk for pancreatic cancer. There is the debate
as to whether diabetes could cause the cancer or if the early stages of the cancer cause diabetes.
Smokinghas been linked as a cause of different pancreatic disorders, such as pancreatitis and pancreatic cancer[YL13]. In fact, "cigarette smoking has been consistently associated with risk of pancreatic cancer"[Sch14], and it accounts for about 25% of pancreatic cancer cases[YL13]. Similarly,alcoholwas also recognized to be a cause of pancreatic disorders, especially pancreatitis. However, only heavy alcohol consumption was found to increase the risk to pancreatic cancer [Zak15].
The literature does well in identifying the high-risk population of pancreatic cancer as the group with genetic mutations or first degree family history. Some literature specifies that a patient must
have at least two FDRs with pancreatic cancer, or one FDR and genetic mutation are needed to
classify the patient at high risk. Following the same logic of combining risk factors, a patient with diabetes that smokes and drinks alcohol could be classified as a high-risk patient. Therefore, these
Table 1.1Risk Factors of Pancreatic Cancer and their Associated Relative Risks
Risk Factor Gene Associated Increased Relative Risk
Familial Pancreatic Cancer, 1 FDR Unknown 4.5
Familial Pancreatic Cancer, 2 FDR Unknown 6.4
Familial Pancreatic Cancer, 3 FDR Unknown 32
Hereditary breast and ovarian cancer syndrome
BRCA1 2.3
Hereditary breast and ovarian cancer syndrome
BRCA2 3.5
Lynch syndrome MLH1, MSH2, MSH6, PMS2 8.6
Familial atypical multiple mole melanoma pancreatic carcinoma syndrome
p16 13
Peutz-Jeghers syndrome STK11/LKB1 132
Hereditary pancreatitis PRSS1, SPINK1 69
Cystic fibrosis CFTR 3.5
Chronic Pancreatitis 13.3
Type-I Diabetes 2
Type-II Diabetes 1.8
Cigarette Use 1.7
More than 3 alcoholic drinks per day 1.2
1.2.3 Pancreatic Cancer Symptoms and Diagnosis
About half of the pancreatic cancer population are diagnosed at the metastatic stage[McA17], and the late diagnosis is mostly due to the asymptomatic nature of the disease. Moreover, symptoms of
PC are not distinct enough to steer diagnositic tests towards pancreatic cancer directly. The most commons symptoms are abdominal pain and nausea, which are also the symptoms for appendicitis,
pancreatitis, gallstones, kidney stones, lactose intolerance, or many other digestive problems. These
common symptoms might be accompanied with other symptoms, such as jaundice, unwanted weight loss, or a new onset of diabetes[Ame].
Once pancreatic cancer, or pancreatic disorders in general, are suspected, imaging is performed
to the abdominal area and the pancreas, such as a computed tomography (CT) scan or a magnetic resonance image (MRI). If a mass is found in the pancreas and suspected to be a tumor, then usually
an endoscopic ultrasound (EUS) procedure is performed as a confirmation test. Each of these testing
(a)CT Scan (b)MRI (c)EUS
Figure 1.2Images of Pancreatic Cancer using Different Screening Modalities[LL14]
1.2.4 Screening Modalities for Pancreatic Cancer
Diagnosing pancreatic disorders requires imaging techniques due to the fact that the pancreas is
an organ that is difficult to view since it is embedded behind other organs. Some of the different
imaging techniques are computed tomography scan, magnetic resonance imaging, and endoscopic ultrasound. Each of the modalities has individual features that would lead medical personnel to
choose one over another.
Computed Tomography scan (CT)is an imaging mechanism that uses x-ray and often dye that can detect legions[201a]. A patient getting a CT scan must lie still on a table while the image is being taken. CT scan is noninvasive imaging that has a reported sensitivity (true positive) of 76% to 92% [Tum11].
Magnetic Resonance Imaging (MRI)is an imaging mechanism that uses strong magnets
con-nected to computers[201a]. MRI is better at differentiating lesions than a CT scan. For example, if a mass was detected by a CT scan it is not uncommon to order an MRI for further diagnosis[Tum11]. However, the sensitivity of the imaging for detection of pancreatic cancer is only 84%, and hence
MRI is not always perceived to have a diagnostic advantage over CT Scans[Tum11].
Endoscopic Ultrasound (EUS)is a procedure that requires inserting a tube orally to examine a patient’s digestive system and nearby organs, where the end of the tube is an ultrasound device[201b]. Ultrasound uses sound waves to image the pancreas. If a lesion is found,Fine Needle Aspiration
(FNA)is used to biopsy the mass during the scope. EUS requires the patient to be sedated, and it is an invasive screening modality. Despite the invasive nature of EUS, it is the most accurate for
diagnosing pancreatic lesions with a reported sensitivity of 86.8% to 92.0%[LL14; Tum11]. EUS is commonly used to confirm diagnosis after a lesion is detected by a CT scan or an MRI since the
lesion can be biopsied using FNA.
Detection of pancreatic cancer leads to assessing the patient’s cancer stage and potential treat-ment options. The imaging techniques discussed are used to view the location, the spread, and the
1.2.5 Resectability of Pancreatic Cancer
The treatment options for pancreatic cancer are limited. Radiation and chemotherapy can have some effect in reducing tumor size within the pancreas, or prolonging a patient’s life[Tam14]. However, they only have limited effect in curing the tumor. Therefore, the main measure of the
tumor’s curability is whether it can be surgically removed, i.e., resection. Pancreatic cancer is said to be resectable if it can be surgically removed. Pancreatic cancer can beresectable,borderline
resectable, orunresectable.
The definitions of the three resectability categories are constantly being refined in the literature as surgical advances take place.Resectablepancreatic cancer is when the cancer is confined to the
pancreas and has not reached any major blood vessels[Tem17]. Another criterion for a tumor to be resectable is that the patient’s health state would permit enduring a pancreatectomy (surgical removal of the pancreas)[Tam14]. Aborderline resectabletumor is usually classified as one that has some contact with a major artery or blood vessel that does not enclose more than half of the artery (≤180° enclosement)[Tem17]. Anunresectabletumor is one that has spread to major blood vessels or metastasized to distant locations, such as the liver or lungs[Tem17]; even if the tumor was surgically removed, there cannot be a guarantee that another tumor onset did not occur in another location.
Generally, pancreatic cancer recurrence is possible after a successful resection. However,
resec-tion still remains the best opresec-tion for surviving pancreatic cancer. Therefore, screening for pancreatic cancer is vital to detecting the tumor at a resectable state.
1.3
Pancreatic Cancer Screening
Given the low incidence rate of PC, population level screening is not thought to be efficient[CMHFHR13]. Therefore, population screening guidelines have not been configured. This is due, in part, to the
belief that pancreatic tumors are aggressive and unlikely to be caught at an early stage. However, recent studies have shown that there is a window for early detection[YID13]. Therefore, the problem of early detection of PC has been gaining traction in recent years, and studies have elaborated on
whom to screen and what screening modalities should be used[DC14; Bec14; Lin].
Moreover, there are multiple centers that have conducted case studies recruiting high-risk
patients and screening them. One study recruited 51 patients at high risk for PC, and after the first
cysts[AS12].
The International Cancer of the Pancreas Screening (CAPS) consortium calls for screening high-risk patients for pancreatic cancer[CMHFHR13]. The consortium consists of 50 experts in the field, and their meeting in 2013 was targeted towards defining the high-risk population and discussing the
potential screening for the disease. The produced guidelines are the main source of guidance when it comes to screening for PC. The questions of when to start screening, how frequently, and when
to stop screening still remain unanswered. In 2013, the consortium suggested to start screening at
the age of 50; however, only 51% of the consortium agreed on that age. Moreover, there was not a consensus on the screening modality, screening interval or screening end age. The CAPS definition of
high-risk individuals focused on genetic mutation and the number of FDRs with pancreatic cancer.
They mentioned that a high-risk individual is anyone with an increased relative risk of five-fold. The question of whom to screen was only partially answered by the CAPS guidelines. For example,
an individual with a five-fold relative risk can be a chronic pancreatitis patient. However,
non-hereditary pancreatic disorders are not necessarily considered when defining the population at high risk. Moreover, family history only accounts for about 10% of the pancreatic cancer population,
and genetic mutation is not necessarily observed unless other risk factors are present. This results
in a high-risk group that does not fully cover the pancreatic cancer population. This highlights the need for an expanded definition of high risk to include a broader spectrum of pancreatic cancer risk
factors.
The other three major questions are (i) when to start screening, (ii) how frequently should the
screenings be, and (iii) when to stop screening? The CAPS guidelines have touched on some answers,
but a screening policy has yet to be developed. Screening start age will heavily depend on the age distribution at pancreatic cancer incidence. It could be appropriate to start screening the high-risk
group at age 50 without missing a large portion of the pancreatic cancer population. The time
interval between screenings will likely depend on the progression rate of the tumor, and how quickly a patient might transition out of the curable stage. Lastly, the screening stop age could be a function
of resectability. For example, if we cannot resect tumors in patients over 80 years old then should we
screen them?
1.4
Problem Definition
The overarching goal of this dissertation is to develop methods for identifying policies that allow for
the detection of pancreatic lesions at a clinical stage when surgery may be an option. Pancreatic cancer is the fourth leading cause of death due to cancer, and it is expected to be the second by
2030[Rah14]. The asymptomatic nature of the disease leads to late symptomatic detection after the tumor has metastasized. However, asymptomatic may not mean the tumor is fast growing and that
interval from the beginning of the cancer until it reaches metastasis[Yac10].
Even with the time opportunity to screen, a population wide screening program would be exhaustive and would result in many benign screenings. The pancreatic cancer incidence rate in
the US typically ranges between 50,000 and 60,000 cases per year[NCISP]. Therefore, it becomes clear that only the high-risk population should be considered. However, the current definition of the high-risk population is mostly restricted to individuals with genetic mutation or FDRs with
pancreatic cancer. The CAPS guidelines defined a high-risk individual as anyone with a relative risk
of 5[CMHFHR13], while other literature views a high-risk individual as someone with a relative risk of 10[Har16]. The high-risk group for pancreatic cancer is not well defined, although risk factors are extensively discussed in the literature.
Screening policies for pancreatic cancer are also ill defined. Because the incidence rate is rela-tively low, and population wide screening is out of the question, screening policies have not been
studied. There are case study reports of hospitals recruiting patients and screening them over some
period of time[Can; Ver10; AS12]. However, these screening trials are not screening policies. A screening policy would specify the screening start age, screening interval, and screening end age.
The curability of the disease after it is detected remains unresolved as well. If screening was
employed in a perfect matter, we still cannot claim that everyone with a screening detected pan-creatic cancer has a resectable cancer. The stage of the cancer, spread of the tumor, and age of the
patient affect the resectability status of the cancer. However, it is unknown the degree to which each of these factors affect resectability.
Pancreatic cancer is a unique disease where it combines low incidence, late diagnosis, and high
mortality with a potential for increased survival if it is detected early. Pancreatic cancer problems are new to the simulation and optimization world. This dissertation seeks to answer the following
questions:
1. Who is at high risk for developing pancreatic cancer?
2. When should screening start for high-risk individuals?
3. How often should high-risk individuals be screened?
4. What screening modality should be used?
5. When should screening stop?
6. What is the role of gender, race, and age in personalizing screening policy?
7. How does resectability influence screening policy?
9. Given the answers to the above, what should the optimal screening policies for pancreatic
cancer be?
1.5
Dissertation Organization
The remainder of this dissertation is organized as follows. Chapter 2 presents a discrete event
simulation progression model of pancreatic cancer. Chapter 3 presents a simulation-based screening policy evaluation tool. Chapter 4 presents a simulation-based screening policy evaluation tool with
CHAPTER
2
SEER BASED PANCREATIC CANCER
PROGRESSION MODEL
2.1
Introduction
Pancreatic Cancer (PC) is the fourth leading cause of mortality due to cancer in the US, and it is
projected to be the second by 2030[Rah14]. The general populations’ lifetime risk is a low 1.6%. It was projected that in 2018 there would be 55,440 new cases and 44,330 deaths from pancreatic cancer (7.3% of all cancer deaths)[NCISP]. Pancreatic cancer tends to be asymptomatic leading to late symptomatic detection often after the cancer has metastasized to other organs[Xu14]. As a result, metastasis is common in PC, accounting for up to 90% of its mortality and the dismal 5-year survival rate of 8%[YID13]. Initially, it was thought that PC is aggressive, fast growing in nature, and hence unlikely to be caught at an early stage. However, it was found that there is an average of 6.8 years from the first parental clone to metastasis in the progression of PC[Yac10]. The late diagnosis of PC is actually due to the asymptomatic nature of the tumor rather than its fast progression. Therefore,
the problem of early detection of PC has been gaining traction recently[DC14; Bec14; Lin]. Pancreatic cancer is further complicated by the fact that the only known cure is through surgery
(resection), and the cancer is only resectable if it has not metastasized to other organs or major blood
be viewed as a property that is lost as the tumor ages. A formal definition of "resectable" pancreatic
cancer is imprecise as resectability is determined on a case-by-case basis. Resectability seems to be related to age, stage of the tumor, and the spread of the tumor. A patient that is considered
to have a resectable cancer may still not be fit for surgery due to the risk of mortality from the
pancreatectomy because of their age[Tam14]. The tumor stages may also be viewed from the perspective of resectability where the tumor can beresectable,borderline resectable, andunresectable.
Producing effective screening policies for PC requires an understanding of the tumor’s
progres-sion and behavior. Research devoted to understanding the pathogenesis of the disease is growing [Old17]. Most PC progression models take a molecular view on the evolution of PC and consider the series of mutations until a cancer cell is created in the pancreas[Hru00]. Of the mathematical growth models for PC, most describe cell interactions rather than milestones within the disease [Lou14]. We develop a progression model that predicts the time when the tumor is symptomatic and the times when the tumor transitions from local to regional and regional to distant stages. In
this chapter, we present a discrete event simulation model of the natural history of PC simulating the potential cancer progression paths in cancer free patients.
2.2
Literature Review
Pancreatic cancer research has been gaining traction as mortality risk drives efforts to enhance
treatment and survival rates. Oldfield et al. conducted a literature review on the molecular behavior
and the natural history of pancreatic cancer[Old17]. Their work presented a genetic background of the tumor’s progression and provided a base for improvement in detection and management of PC.
Louzoun et al. developed a mathematical model that describes the interaction between pancreatic
cancer and the immune system[Lou14]. Hruban et al. analyzed the progression of PC from normal pancreas cells that become lesions and undergo a series of mutations before they become cancerous
cells[Hru00].
Yachida et al. studied pancreatic cancer samples and estimated a 10-year window between the first cancer cell and a parental clone, and a 7-year interval until metastasis, suggesting a slower
of pancreatic cancer progression[Not16].
Haeno et al. developed a cell replication model for PC that starts with a single tumor cell without metastatic ability that can multiply into a tumor cell with metastatic ability which, in turn, can
multiply into a metastatic tumor cell at a distant location[Hae12]. This model assumes that all rates are associated with exponential distributions due to the exponential nature of tumor growth and cell division. Weekes et al. also considered the exponential nature of tumor growth by developing
differential equations that describe the cell replication behavior for a non-cancer specific model [Wee14]. This model assumes two types of cancer cells: stem and non-stem cells. Cancer stem cells are the tumor initiation cells with replication ability. Non-stem cells are the tumor cells with a
shorter lifespan and lower ability to multiply. The model considered the possible paths of a stem cell
dividing into two stem cells, one stem cell and one non-stem cell, or two non-stem cells[Wee14]. Pandharipande et al. developed a pancreatic cancer screening simulation model where the model
also includes a natural history model for pancreatic cancer[Pan15]. Peters et al. expanded on the natural history model presented by Pandharipande et al. by incorporating precancerous stages know
asPanINcells[Pet18]. The Peters et al. and the Pandharipande et al. models used the summary
statistics from the Surveillance, Epidemiology, and End Results (SEER) databases but not the patient
level data.
Cancer progression models have been developed for various cancers. Roberts et al. developed a
discrete event simulation model of colorectal cancer progression: theVanderbilt/NC Statemodel [Rob07]. The underlying distribution for most of the random variables in the simulation model was assumed to be the Johnson SB. However, if the variable was time dependent then it was assumed to
follow a nonhomogeneous Poisson process[Rob07]. Shen et al. developed a continuous Markov chain model to estimate the time until symptomatic detection using periodic screening data of
lung cancer patients[She17]. The study aimed to understand the effect of the tumor’s time until symptomatic detection on personalized screening policy effectiveness[She17]. Plevritis et al. derived probability models of symptomatic detection and the transition between stages of cancer[Ple07]. While their model was tumor independent, it was only implemented on breast cancer[Ple07]. Tejada et al. developed a simulation model for natural history of breast cancer that used the result of Plevritis et al. to evaluate the probability that the tumor is in a certain stage given its volume[Tej15].
In parallel with the tumor progression research, the study of the curative state of pancreatic
cancer has been ongoing. The National Comprehensive Cancer Network (NCCN) 2017 guidelines for pancreatic cancer gave a criteria for the three resectability categories depending on the tumor
position in the pancreas and the spread of the tumor[Tem17]. Resectable pancreatic cancer is confined to the pancreas, a boarderline resectable tumor has some contact with major arteries, and an unresectable tumor is no longer contained to the pancreas and neighboring organs. The
in surgery, the hope is to be able to resect more borderline resectable tumors.
One of the main challenges when trying to understand PC is the lack of large databases on the evolution of the disease; the incidence of the disease is low. The Surveillance, Epidemiology, and
End Results (SEER) databases are the publicly available patient level data in the US that have been
used to study pancreatic cancer. These studies have explored the associated trends in incidence and mortality of PC over time[Wu18; Gd18; Saa18]. The studies found a rising trend in incidence of PC even when the data was stratified by gender, race, and age. Other studies explored the racial,
gender, and age disparities in PC[Nip17; Zho17]. The studies found that African Americans are more likely to be diagnosed at a later stage of the cancer and have lower survival rates than whites. Most
pancreatic cancer research to date has been descriptive in nature, where little modeling work has
been developed to characterize the evolution of pancreatic cancer within a patient. To the best of our knowledge, a pancreatic cancer growth model based on population level data such as SEER has
not been developed. In this chapter, we utilize SEER data, the framework presented by Plevritis et al.,
and the findings of Furukawa et al. to develop a pancreatic cancer growth model that is personalized by race, gender, and age.
2.3
Methods
For this study, we analyzed pancreatic cancer data from SEER. Moreover, we utilized the PC
progres-sion timeline introduced by Yachida et al., and the progresprogres-sion models by Haeno et al. and Plevritis
et al. We created a discrete event simulation of the model based on Haeno et al. and evaluated the time until metastasis. We modified the progression model presented by Plevritis et al. and created a
discrete event simulation of the resulting model. We validated the model by comparing the time
until metastasis produced by the model against that presented by Yachida et al. and the result of the simulation of Haeno et al. The simulation models were implemented using Python 3.6. The
remainder of this section introduces the pancreatic cancer data in SEER and our extension of the
progression model by Plevritis et al. using the SEER data for PC.
2.3.1 SEER Data
The SEER databases are registries by the National Cancer Institute and consist of data collected
from 18 different registries around the US. The SEER databases have millions of records, where each record corresponds to a patient and multiple records could correspond to the same patient
at different points in time. Each record contains 133 fields with patient and tumor information
including primary tumor, age at diagnosis, gender, race, tumor size, tumor stage, and treatment. We filtered the data by primary tumor, and only studied the set of patients whose primary tumor
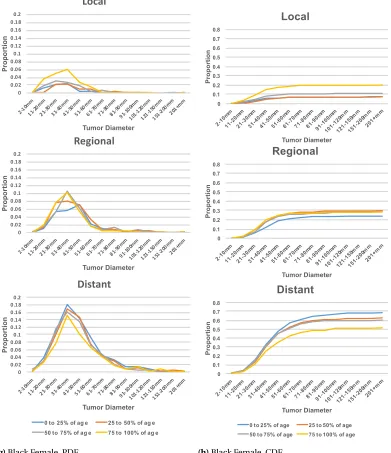
Figure 2.1Box Plots of Age Distribution by Race and Gender
SEER data.
2.3.2 SEER Data Analysis
Given the lack of screening for the disease, we assumed the pancreatic cancer entries that were not
death records and did not undergo treatment to be symptomatic detection records. We remove the
treatment records since the recorded tumor size can be post surgery. We have identified that the records prior to 2004 were missing the tumor volume where SEER data created that field in 2004
and there did not exist an equivalent field with tumor size prior to 2004. The records prior to 2004
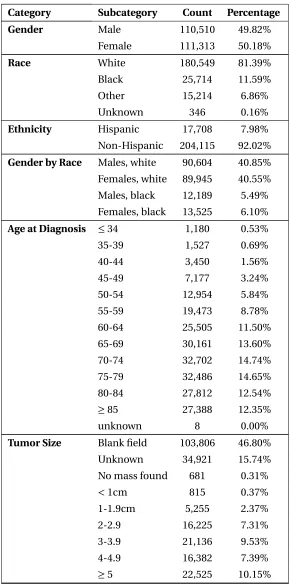
were about 47% of the total PC records. After filtering the data and removing the rows with missing information, we had 40,587 records of white patients, 6,355 records for African American, and 3,906
records for the other races. We excluded the records for the other races since they were not enough
to train the progression model. The resulting data spanned the years 2004 till 2014. We segmented the filtered data by gender and race then analyzed the age distribution within each subset. The box
plots in Figure 2.1 suggests that the age distribution within each subgroup is different. In fact, the white female’s 50t hpercentile of 73 years old is the same as the black male’s 75t hpercentile. Based
on this heterogeneity, we further segmented the gender/race populations by age percentiles in each group resulting in sixteen disjoint subsets. Each subset was converted into frequency contingency tables of cancer stage (local, regional, and distant) against tumor size (groups by:≤1cm, 1-2cm, ...,
Table 2.1SEER Data Summary Statistics for Pancreatic Cancer Records
Category Subcategory Count Percentage
Gender Male 110,510 49.82%
Female 111,313 50.18%
Race White 180,549 81.39%
Black 25,714 11.59%
Other 15,214 6.86%
Unknown 346 0.16%
Ethnicity Hispanic 17,708 7.98%
Non-Hispanic 204,115 92.02%
Gender by Race Males, white 90,604 40.85%
Females, white 89,945 40.55%
Males, black 12,189 5.49%
Females, black 13,525 6.10%
Age at Diagnosis ≤34 1,180 0.53%
35-39 1,527 0.69%
40-44 3,450 1.56%
45-49 7,177 3.24%
50-54 12,954 5.84%
55-59 19,473 8.78%
60-64 25,505 11.50%
65-69 30,161 13.60%
70-74 32,702 14.74%
75-79 32,486 14.65%
80-84 27,812 12.54%
≥85 27,388 12.35%
unknown 8 0.00%
Tumor Size Blank field 103,806 46.80%
Unknown 34,921 15.74%
No mass found 681 0.31%
<1cm 815 0.37%
1-1.9cm 5,255 2.37%
2-2.9 16,225 7.31%
3-3.9 21,136 9.53%
4-4.9 16,382 7.39%
Table 2.1SEER Data Summary Statistics for Pancreatic Cancer Records (continued)
Category Subcategory Count Percentage
Stage In-Situ 676 0.30%
Local 20,470 9.23%
Regional 55,891 25.20%
Distant 111,010 50.04%
Unstaged 33,776 15.23%
Total records 221,823
We also explored two fields in the SEER data: reason for no surgery and which surgery was performed (if any) to identify resectable disease. The first field has a category "surgery not
recom-mended", and the second field has a category for "no surgery" was performed. We filtered the set of
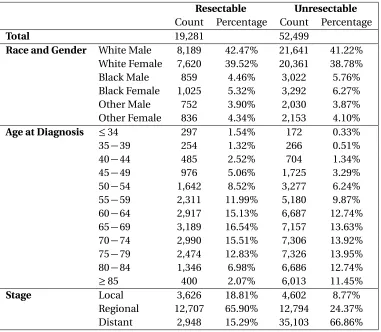
patients that were not recommended for surgery and did not have a surgery performed and assumed the set to include patients withunresectable pancreatic cancer. Similarly, we filtered the set of
pa-tients that had a surgery on the primary tumor site to be the set of papa-tients withresectable/borderline
resectable pancreatic cancer. We created two databases ofresectableandunresectablecancer for
further analysis as described in Section 2.3.4. Table 2.2 summarizes the characteristics of the two
databases created.
2.3.3 Progression Model
The tumor growth model was developed based on the work by Plevritis et al. One of the key
assump-tions in our work is that tumor progression is gender, race, and age dependent. We developed a
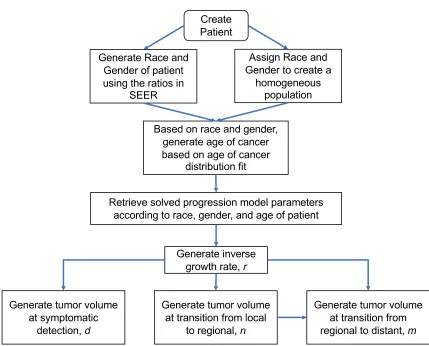
simulation model that imitates the natural history of PC in high-risk patients. Table 2.3 and Figure 2.2 present the logic of the simulation model. The simulation starts by creating a patient with either
an assigned or randomly sampled race and gender, and using the race and gender of the patient,
an age of cancer initiation is generated according to a cancer initiation age distribution we obtain from SEER. We used the White male to White female to Black male to Black female ratio from the
SEER data when generating a new patient. Using the complete records of the SEER data, we utilized
the age at diagnosis and the tumor volume fields with the progression model described in Section 2.3.3.1 to reverse the tumor progression to the age at which the tumor would have been initiated for
each race and gender. With a simulated cancer patient, we sample tumor volumes of the cancer
progression as explained in the next section. The model assumes that cancer stages progress from local to regional to distant. We assume that it is not possible to move from local to distant without
Create Patient
Based on race and gender, generate age of cancer based on age of cancer
distribution fit Generate Race and
Gender of patient using the ratios in
SEER
Retrieve solved progression model parameters according to race, gender, and age of patient
Generate inverse growth rate, r
Generate tumor volume at symptomatic
detection,d
Generate tumor volume at transition from local
to regional, n
Generate tumor volume at transition from regional to distant, m
Assign Race and Gender to create a
homogeneous population
Table 2.2Summary Statistic of the Resectable and Unresectable Populations Created
Resectable Unresectable Count Percentage Count Percentage
Total 19,281 52,499
Race and Gender White Male 8,189 42.47% 21,641 41.22% White Female 7,620 39.52% 20,361 38.78%
Black Male 859 4.46% 3,022 5.76%
Black Female 1,025 5.32% 3,292 6.27%
Other Male 752 3.90% 2,030 3.87%
Other Female 836 4.34% 2,153 4.10%
Age at Diagnosis ≤34 297 1.54% 172 0.33%
35−39 254 1.32% 266 0.51%
40−44 485 2.52% 704 1.34%
45−49 976 5.06% 1,725 3.29%
50−54 1,642 8.52% 3,277 6.24%
55−59 2,311 11.99% 5,180 9.87%
60−64 2,917 15.13% 6,687 12.74%
65−69 3,189 16.54% 7,157 13.63%
70−74 2,990 15.51% 7,306 13.92%
75−79 2,474 12.83% 7,326 13.95%
80−84 1,346 6.98% 6,686 12.74%
≥85 400 2.07% 6,013 11.45%
Stage Local 3,626 18.81% 4,602 8.77%
Regional 12,707 65.90% 12,794 24.37%
Distant 2,948 15.29% 35,103 66.86%
2.3.3.1 Model Framework
This section presents the methodology of the progression model, and Table 2.4 summarizes the
model parameters used. The tumor volume is assumed to follow an exponential growth function according to:
V(t) =c0et/R, (2.1)
wherec0is the spherical initial tumor volume with a diameter of 2mm. We calculate the time where
a tumor is at a certain volume,V, with the inverse of Equation 2.1:
T(V) =Rln
V c0
(2.2)
Table 2.3Pancreatic Cancer Progression Model Simulation Run
Step 1 Create Patient:
• For a heterogeneous population: Using the distribution of race/gender in the SEER data patients, sample a race and gen-der.
• For a homogeneous population: Specify a race and gender.
• Using the race/gender sampled, identify the appropriate distribution of cancer age initiation. Sample an age.
Step 2 Using the race, gender, and age generated in Step 1, retrieve progression model parameters
Step 3 From the distribution of the inverse growth rate,R, generate a sampler
Step 4 Create Tumor:
1. Generate tumor volume at symptomatic detection,d, using Equation 2.5.
2. Generate tumor volume at transition from local to regional,n, using Equation 2.6.
3. Generate tumor volume at transition from regional to distant,m, using Equation 2.7.
Step 5 Translate tumor volumes generated to time in years using the Equation 2.2 and record the time stamps of the events generated.
ΓR(α,β) =
βα
Γ(α)rα−1e−β
r, (2.3)
where the parametersαandβare solved for in the model using the method presented in Plevritis et al.[Ple07]. The tumor volume doubling time is proportional to the inverse growth rateR, where doubling time (DT) is:
D T =ln(2)×R. (2.4)
To represent tumor progression, Plevritis et al. introduced three conditional tumor volume
proba-bility distributions given an inverse growth rate,R, as follows:
1. Distribution of tumor volume at symptomatic detection,D:
Table 2.4Model Parameters
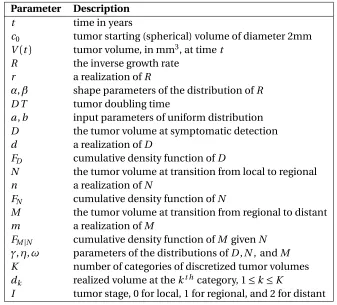
Parameter Description
t time in years
c0 tumor starting (spherical) volume of diameter 2mm V(t) tumor volume, in mm3, at timet
R the inverse growth rate
r a realization ofR
α,β shape parameters of the distribution ofR
D T tumor doubling time
a,b input parameters of uniform distribution
D the tumor volume at symptomatic detection
d a realization ofD
FD cumulative density function ofD
N the tumor volume at transition from local to regional
n a realization ofN
FN cumulative density function ofN
M the tumor volume at transition from regional to distant
m a realization ofM
FM|N cumulative density function ofM givenN
γ,η,ω parameters of the distributions ofD,N, andM K number of categories of discretized tumor volumes
dk realized volume at thekt hcategory, 1≤k ≤K
I tumor stage, 0 for local, 1 for regional, and 2 for distant
2. Distribution of tumor volume at transition from local stage to regional stage of cancer,N:
FN|R(n|r) =1−e−ηr(n−c0) (2.6)
3. Distribution of tumor volume at transition from regional stage to distant stage of cancer,M:
FM|N,R(m|n,r) =1−e−ωr(m−n) (2.7)
We note that the distribution of tumor volume at detection is assumed to be independent of the
distributions of tumor volume at transitions between the local, regional, and distant tumor stages. These three distributions are used to create the three events in the simulation, given a specificR
value generated for each patient. The parametersγ,η, andωwere estimated by maximizing the likelihood function:
L =
K−1 Y
k=1
P(D ∈ (dk,dk+1),I = 0)pkP(D ∈ (d
whereK denotes the number of discretized tumor size categories;I the tumor stage where 0 is
local, 1 is regional, and 2 is distant;P(D∈(dk,dk+1),I)the probability a pancreatic cancer patient
experiences symptomatic detection at a tumor volume in the range (dk,dk+1) in stageI; andpk,
qk, andsk correspond to the frequency of tumor volume within the rangedk todk+1for stage 0, 1,
and 2, respectively. Since these frequencies can be high, we maximize the log-likelihood function instead:
log(L) =
K−1 X
k=1
pklog(P(D∈(dk,dk+1),I =0))
+qklog(P(D∈(dk,dk+1),I =1)) +sklog(P(D∈(dk,dk+1),I =2)) (2.9)
The conditional joint density functions for detection volume and stage conditional on the inverse
tumor growth rate were given as follows[Ple07]:
fD,I|R(d, 0|r) =γr e−(γ+η)r(d−c0) (2.10)
fD,I|R(d, 1|r) =
ηγ η−ωr[e
−(γ+ω)r(d−c0)−e−(γ+η)r(d−c0)] (2.11)
fD,I|R(d, 2|r) =fD|R(d|r)−fD,I|R(d, 0|r)−fD,I|R(d, 1|r) (2.12)
Plevritis et al. derived the unconditional discretized distributions ofP(D ∈(dk,dk+1),I)for each stage to solve for the parameters of the tumor growth model by maximizing Equation 2.9. The
parameters were estimated using the SEER frequency data under the assumption thatRfollows a
Gamma distribution with unknown parameters. The assumed Gamma distribution ofR does not specify the time unit of the inverse growth rate. While Furukawa et al. found that the tumor doubling
time ranges between 64 and 255 days[Fur01], a distribution fit for the tumor doubling time was not provided. Using the result of Furukawa et al., we performed two analyses where we assumeR
follows (i) a Uniform distribution, and (ii) a Gamma distribution.
R∼Uniform. Since the result of Furukawa et al. was based on only nine patient samples, we assume thatD T ∼Uniform(64/365, 255/365). A uniform distribution has the property of giving equal weight to the different possible values within the given range including extreme values. Hence,
we assumeRto be uniformly distributed:
R∼Uniform(a,b), wherea= 64
365·ln(2)andb= 255
365·ln(2). (2.13)
The derivation of the unconditional discretized distributions under the uniform distribution
symptomatic detection are as follows:
fD(d) =
1
b−a·
a·e−γ·a(d−c0)−b·e−γ·b(d−c0) d−c0
+e−γ·a(d−c0)−e−γ·b(d−c0)
γ(d−c0)2
(2.14)
fD,I(d, 0) =
1
b−a
γ·a·e−(γ+η)a(d−c0)−γ·b·e−(γ+η)b(d−c0)
(γ+η)(d−c0)
+γ·e−(γ+η)a(d−c0)−γ·e−(γ+η)b(d−c0)
(γ+η)2(d−c0)2
(2.15)
fD,I(d, 1) =
1
b−a·
ηγ η−ω
a·e−(γ+ω)a(d−c0)−b·e−(γ+ω)b(d−c0)
(γ+ω)(d−c0) +
b·e−(γ+η)b(d−c0)−a·e−(γ+η)a(d−c0)
(γ+η)(d−c0)
+e−(γ+ω)a(d−c0)−e−(γ+ω)b(d−c0)
(γ+ω)2(d−c0)2 +
e−(γ+η)b(d−c0)−e−(γ+η)a(d−c0)
(γ+η)2(d−c0)2
(2.16)
fD,I(d, 2) =fD(d)−fD,I(d, 0)−fD,I(d, 1) (2.17)
Equations 2.15-2.17 are used to findP(D∈(dk,dk+1),I)as the discretized version of the distribution
(shown in Appendix A), which, in turn, were used to maximize the likelihood function and estimate the parametersγ,η, andω.
R∼Gamma. We develop two models under the assumption of a Gamma distributed inverse
growth rate with unknown parameters,αandβ, as used by Plevritis et al. and Atkinson et al. One uses the derivation of Plevritis and the other incorporates the tumor doubling time.[Ple07; Atk83]. We maintain the tumor doubling time range of 64 to 255 days; however, we now assume that about
80% of the tumors have a doubling time in the range (64,255) days. We set the distribution ofRto be Gamma, where the 10th percentile is 64/(ln(2)×365), the 90th percentile is 255/(ln(2)×365), and the expected value to be the midpoint of 319/(2×ln(2)×365)and solve for the distribution parameters. The form of the Gamma is distribution is as follows:
fR(x) =
βα
Γ(α)xα−1e−β
x (2.18)
whereαandβare the parameters to be solved for according to the assumptions:
FR(a) =
γ(α,βa)
Γ(α) =0.1 (2.19a)
FR(b) =0.9 (2.19b)
E[X] = α β =
a+b
where
a= 64
365·ln 2andb= 255 365·ln 2.
Given the nature of the cumulative density function of the Gamma distribution (shown in
Equation 2.19a), the two percentile points are insufficient to have a unique solution forαandβ. Therefore, we also assume the relationship between the two (or in this case, a value for the mean).
The cumulative density function also does not have a closed form solution, so we approach the
problem of solving for the parameters iteratively. We express the equations in terms ofαusing the assumed value of the mean. We setαat a starting value of 0.0001 with increments of 0.0001 and a ceiling of 10. Using the built-in CDF function for Gamma in MATLAB, we iteratively evaluateFR(a)
andFR(b)until they are equal to 0.10 and 0.90 rounded to two decimal places and a value forαis
returned. Using this iterative method, we found thatα=5.1590, andβ=8.1832.
The model was parameterized under three assumptions: (i)R∼Gamma(α,β)with unknown parameters with the derivations provided by Plevritis et al., (ii)R∼Gamma(α,β)whereα=5.1590 andβ=8.1832, and (iii)R∼Uniform(a,b)with known parameters. To solve for the parameters, we used TensorFlow™, a machine learning open source package for Python. Specifically, we used the
application of the stochastic optimization algorithm: Adam[KLB].
The developed simulation model of the tumor progression uses the parameters under R ∼
Uniform for each race, gender, and age group. Using the tumor volume Equation 2.1, for each patient
in the SEER data, we performed ten trials where we sampled an inverse growth rate according to the distribution in Equation 2.13. We solved for the tumor initiation time, i.e., the time it took for the
tumor to grow from a 2mm wide cancer to its recorded diameter in SEER. We averaged ten trials
and fit the average ages. The simulation uses the resulting age distribution when creating a patient.
2.3.4 Resectability of Pancreatic Cancer
We used the sets of resectable and unresectable pancreatic cancers to develop a model that uses a
patient’s age, cancer stage (local, regional, or distant), and cancer size to predict the resectability of the tumor. For example, we would input patient X’s information who is 74 years old with regional
stage tumor of size 31mm, and use the model to predict the probability this patient has a resectable
cancer. We used four different tools to develop a resectability prediction tool:Ridge Regression,
Logistic Regression,Support-vector Classification (SVC), and Support-vector Regression (SVR). For
all techniques, we used the machine learning package Scikit-learn[Ped11]. The Ridge Regression model minimizes a linear least squares function that is regularized by the L-2 norm by adjusting the weightsw such that:
min
w ||X w−y||
2
2+ψ||w||
2
2, (2.20)
Age
Stage
Size
Scikit Learn Tool
Inputs Output
Probability of Resectability
Figure 2.3Flow of inputs and outputs to the prediction model
predicted, andψis an error term. On the other hand, Logistic Regression minimizes the following function:
min
w,c
1 2w
Tw+C n
X
i=1
log(exp(−yi(XiTw+c)) +1). (2.21)
whereC is a lower bound. Support vector machines are a set of supervised learning tools that are used for classification and regression problems.
We tested our data through a classification tool and a regression tool. Classification algorithms
in general will return a class to which a variable should belong (black or white), while regression will return a combination of the different classes (grey scale). For each of the fitting techniques, we set
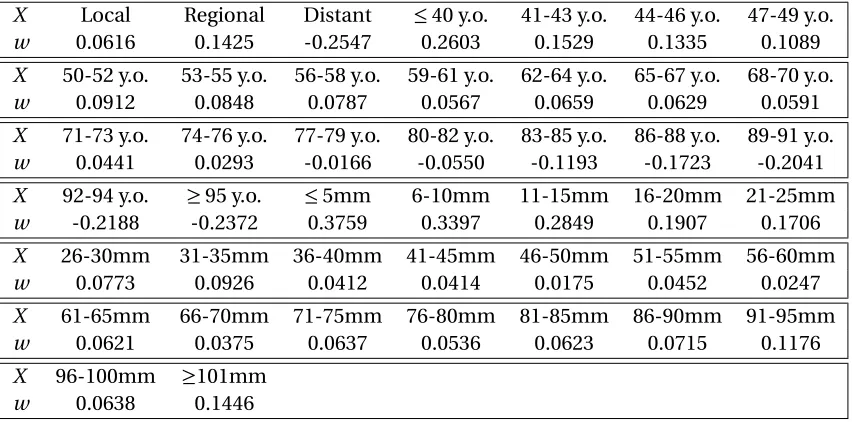
the dependent variable equal to 1 if the patient’s tumor was deemed resectable, and 0 if surgery was not recommended for the patient. We reformatted the input data to the models,X, into categorical
values such that the independent variable is a vector of 0-1 entries with exactly three positions that
are 1:
• X = [H,A,S]
• H is a row vector that corresponds to the tumor stage, where:
Hi=
¨
1 if tumor stage isi,i∈ {local, regional, or distant};
0 otherwise.
• Ais a row vector that corresponds to the patient’s age, where:
Ai=
1 if patient’s age is within the categoryi,
i∈ {≤40, 41−43, 44−46, ..., 92−94, and ≥95};
(a)Resectable (b)Unresectable
Figure 2.4Bar Charts of Age by Tumor Stage in the Resectable and Unresectable Groups
• Sis a row vector that corresponds to the tumor diameter, where:
Si=
1 if the tumor diameter is within the categoryi,
i∈ {≤5m m, 6−10m m, 11−15m m, ..., 96−100m m, and ≥101m m};
0 otherwise.
Ridge Regression is often used when there is believed to be a relationship between the input
variables as well as their relationship to the output variable. In our case, tumor size is related to
tumor stage. We plotted the age distribution by stage for the resectable and unresectable groups as shown in Figure 2.4. We also plotted the age and tumor size scatter plot by stage for the resectable
and unresectable groups as shown in Figure 2.5. We can see that the relationships are not linear.
Therefore, categorizing tumor volume and stage would approximate the non-linear relationship with a piece-wise linear one. Hence, we converted all input variables into categorical entities. Moreover,
we cannot assume that age or tumor size to have a linear relationship with resectability. We divided
the data where we used 80% for training and 20% for testing and consistently used the same training set for all models. The Ridge Regression and SVR models output a value that is not necessarily 0 or 1,
where the predicted value could also be negative since they are hyper-plane fits. On the other hand,
the Logistic Regression and SVM models output 0 or 1 only. We compared the output of the four models using the 20% testing set, refer to Table 2.5. For the predictions of the regression models, we
assume that an output that is greater than 0.5 is resectable. The regression models also can return a negative fractional value or a value that is greater than 1 since the output is not restricted to be
between 0 and 1. For example a ninety year old patient with distant cancer would result in a negative