GENETICS | COMMUNICATIONS
A High-Throughput Method for the Analysis of
Larval Developmental Phenotypes in
Caenorhabditis elegans
María Olmedo,*,†,1Mirjam Geibel,* Marta Artal-Sanz,†and Martha Merrow*,1 *Institute of Medical Psychology, Ludwig-Maximilians-Universität Munich, D-80336 Munich, Germany, and†Andalusian Center for Developmental Biology, Consejo Superior de Investigaciones Cientffícas/Junta de Andalucía/Universidad Pablo de Olavide, ES-41013 Seville, Spain ORCID IDs: 0000-0002-5701-2665 (M.O.); 0000-0002-9697-6408 (M.G.); 0000-0003-1126-0492 (M.A.-S.)
ABSTRACTCaenorhabditis eleganspostembryonic development consists of four discrete larval stages separated by molts. Typically, the speed of progression through these larval stages is investigated by visual inspection of the molting process. Here, we describe an automated method to monitor the timing of these discrete phases of C. elegansmaturation, from the first larval stage through adulthood, using bioluminescence. The method was validated with alin-42mutant strain that shows delayed development relative to wild-type animals and with a daf-2 mutant that shows an extended second larval stage. This new method is inherently high-throughput and willfinally allow dissecting the molecular machinery governing the speed of the developmental clock, which has so far been hampered by the lack of a method suitable for genetic screens.
KEYWORDSdevelopment; larval molt; bioluminescence; luciferase;Caenorhabditis elegans
C
AENORHABDITIS elegansis a key model system in which to study development from genetic regulation and cell biological processes to the precisely programmed body plan. Postembryonic development in this nematode initiates in the presence of food after the egg hatches. The larval develop-mental program consists of four discrete stages (L1–L4). The formation of a new cuticle, the separation of the old and new cuticles (apolysis), and the escape from the old cuticle (ec-dysis) occur during transitions between larval stages called molts (M1–M4). Ecdysis is preceded by lethargus, a period during which the animals show behavioral quiescence and cease pharyngeal pumping (Singh and Sulston 1978). This behavioral quiescence is accompanied by a typical posture (Iwaniret al.2012; Schwarz et al.2012) and shows other sleep-like properties such as reversibility and increasedarousal threshold (Raizenet al.2008; Schwarzet al.2011; Cho and Sternberg 2014).
The rhythmic process of molting is sometimes referred to as a clock despite the lack of rigorous quantitative analyses that would support this. The clock analogy stems in part from the fact thatC. eleganshas a homolog of theperiodcircadian clock gene, lin-42, which, when mutated, slows developmental timing (Jeonet al.1999; Monsalveet al.2011). The expres-sion of theperiodgene homolog oscillates with the molting cycle (Jeon et al.1999), similar to daily oscillations in per expression in mammals andflies (Hardinet al.1990; Teiet al. 1997). Furthermore, the timing of lethargus is programmed by the developmental clock (Raizenet al.2008), similar to how the endogenous circadian clock programs the timing of the sleep episodes (Aschoff 1965). These features suggest a functional conservation between the developmental and circadian clocks, but the molecular mechanism of the rhyth-micity of larval development remains elusive.
Developmental timing is usually studied by means of direct observation of the animals at short time intervals using a dis-secting microscope. Lethargus, cessation of pharyngeal pump-ing, ecdysis (Monsalveet al.2011), and expression of GFP driven by promoters of genes that oscillate with the molts (Kim et al. 2013) have been used as hallmarks of the Copyright © 2015 by the Genetics Society of America
doi: 10.1534/genetics.115.179242
Manuscript received June 10, 2015; accepted for publication August 17, 2015; published Early Online August 20, 2015.
Available freely online through the author-supported open access option.
Supporting information is available online at www.genetics.org/lookup/suppl/ doi:10.1534/genetics.115.179242/-/DC1.
1Corresponding authors: Andalusian Center for Developmental Biology, CSIC/JA/
developmental process. Although these methods have shed light onC. elegansdevelopment, they are exceedingly time-consuming, are ill-suited for independent measurement of high numbers of animals, and are semiquantitative. The full power of the genetic model organism for studying develop-mental timing is thus lost. In contrast, the study of embryonic development inC. eleganshas benefited from the use of au-tomated setups to monitor the process with high time reso-lution (Schnabel et al. 1997). Here, we describe a highly quantitative and high-throughput method for continuous monitoring of development in C. elegansusing biolumines-cence. The method is validated using mutants that were pre-viously reported to alter developmental timing.
Materials and Methods
Strains and experimental conditions
We used the reporter strainsPE255(feIs5[Psur-5::luc+::gfp; rol-6 (su1006)] X) andPE254(feIs4[Psur-5::luc+::gfp;rol-6 (su1006)] V) (Lagido et al. 2008, 2009). For experiments with thelin-42mutant, we used the strain MRS189 [lin-42
(ok2385); feIs4 [Psur-5::luc+::gfp; rol-6 (su1006)] V]. For experiments with the daf-2 mutant, we used the strain MRS210 [daf-2 (e1370); feIs5 [Psur-5::luc+::gfp; rol-6 (su1006)] X]. For stock animals, we cultured the animals according to standard methods (Brenner 1974), routinely maintaining the strains at 18°on nematode growth medium) plates with a lawn ofEscherichia coli(OP50). For all experi-ments, we grew the stocks to the stage of gravid adult and obtained eggs by bleaching. We adjusted the concentration of the egg suspension to 20 eggs per microliter in M9 buffer and incubated them at 18°with gentle agitation, leading to hatch-ing and arrest of development at the L1 stage. For the exper-iment with thedaf-2mutant, this incubation was performed at 20°. After 2 days of starvation, we initiated the experi-ments by exposing the arrested L1 animals to food.
Luminometry of single animals
L1-arrested larvae were simultaneously exposed to food by adding the M9 suspension of larvae to S-basal media containing 10 gliter21E. coliOP50. Then, single L1 animals were trans-ferred into a well of a white, flat-bottom, 96-well plate by manual pipetting. Each well contained 200ml of S-basal me-dia with 10 gliter21E. coliOP50(wet weight) and 100mM D-Luciferin. Transferring of 96 animals to complete one plate took30 min. For the experiment with the mutantdaf-2, we manually transferred the animals directly from the M9 suspen-sion of larvae to a well of the 96-well plate containing 100ml of S-basal with 100mM D-Luciferin (without food) and then re-sumed development by adding 100 ml of S-basal with 20 gliter21E. coliOP50(wet weight) and 100mM D-Luciferin. Plates were sealed with a gas-permeable cover (Breathe Easier, Diversified Biotech). We measured luminescence (Berthold Centro LB960 XS3) for 1 sec, typically at 5-min intervals. We performed all experiments inside temperature-controlled incu-bators (Panasonic MIR-154). Temperature was monitored us-ing HOBO Data Loggers (Onset).
Data analysis
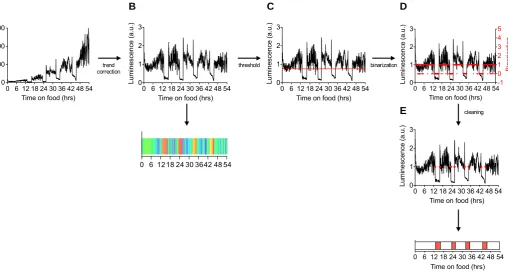
The raw data from the luminometer were analyzed using ChronoOSX 3 (Roenneberg and Taylor 2000), and the period of the oscillation was calculated by autocorrelation. For visu-alization of the data as heat maps, we trend-corrected the raw data (Supporting Information,Figure S2A), dividing by a centered moving average (Figure S2B). The moving aver-age was calculated for the duration of one cycle (or period) of the oscillation. We used the trend-corrected data to generate heat maps (R software). To determine the timing of the molts, the trend-corrected data were converted to binary, using 75% of the value of the moving average as a threshold (Figure S2, C and D). We then evaluated the data for onset and offset of molting by detecting the transitions in the binar-ized data (Figure S2E). Transitions from 1 to 0 correspond to
Figure 1 Luminescence signal reports larval
onset of the molt and transitions from 0 to 1 correspond to offset of the molt. The variability of the luminometry signal introduces noise in the binarized data (Figure S2D). To pre-vent this noise from affecting the detection of the transitions, a simple rule was applied: onsets were followed by“0”for at least 1 hr, and offsets were preceded by“0”for at least 1 hr. We calculated the duration of each larval stage and molt from the beginning and the end of the four molts. Before plotting the data, we removed the outliers detected using the Grubb’s test. To test for differences in the duration of each stage between theN2and mutant strains (Figure 3), we used the two-tailed unpairedt-test.
Fluorescence and luminescence of populations of animals
To test forfluorescence and luminescence signals around the L1–L2 molt, we added populations of500 arrested L1 lar-vae to a 96-well plate containing 200ml of S-basal media with 100mM D-Luciferin and 10 gliter21E. coliOP50to resume development. Larvae were added to the plate every hour for 10 hr. We incubated the plate at 20.5°and then measured for luminescence andfluorescence (FLUOstar Omega, BMG Lab-tech) 12 hr after the last inoculation, covering a period of 12–22 hr after resumption of development. Forfluorescence, excitation was set at 485 nm and emission at 535 nm.
In vitro ATP measurements
Forin vitromeasurements of ATP around the L1–L2 molt, we added populations of500 arrested L1 larvae to a 96-well plate containing 200ml of S-basal media with 100mM D-Luciferin and 10 gliter21E. coliOP50to resume devel-opment. Larvae were added to the plate every hour for 9 hr. We incubated the plate at 20.5° for 13 hr after the last inoculation, covering a period of 13–22 hr after resumption of development. We measured luminescence as a control of developmental stage and then collected animals for ATP measurement. The collected larvae (500 per sample) were washed three times with S-basal, frozen in liquid ni-trogen in 50ml of S-basal, and stored at–80°. Samples were
then boiled for 15 min and centrifuged to pellet the debris. ATP content in 25ml of the supernatant was measured us-ing a time-stable ATP determination kit (Biaffin) and nor-malized to protein content (DC Protein Assay, Bio-Rad).
Results and Discussion
A quantitative, automated method to measure the timing of development in C. elegans
We followed two independent strains throughout develop-ment that constitutively and ubiquitously express the lucifer-ase protein fused to GFP (Psur-5::luc+::gfp) (Lagido et al. 2008, 2009). We measured bioluminescence from single ani-mals in 96- or 384-well plates. Experiments were initiated by exposing arrested L1 larvae to food at time = 0, a stimulus that launches the larval developmental program. The lumi-nescence signal emitted by a single animal generally in-creased throughout development. However, the signal is punctuated and structured by four interruptions (Figure 1A). Using visual inspection, we confirmed that these inter-ruptions are coincident with behavioral quiescence, charac-teristic of the molting stage. It is these temporal structures that allowed a quantitative assessment of the timing of de-velopment. Entry into thefirst molt occurs at 14.0861.06 hr at 21.5° when starved L1 are monitored (Figure 1B). The transitions between intermolt and molt are short (5– 10 min;Figure S1A), allowing precise determination of the beginning and end of the molt (Figure S2). This method can also report the timing of development for populations, al-though the precise information about the beginning and the end of the molts is lost due to animal-to-animal variability (Figure 1C).
To determine if the reduction in luminescence is due to a change in the expression level of the LUC::GFP fusion protein, we measured luminescence and fluorescence in parallel in a population of animals before, during, and after the L1–L2 molt. The expression of the LUC::GFP protein in these strains is driven by the regulatory region of the constitutively expressed sur-5
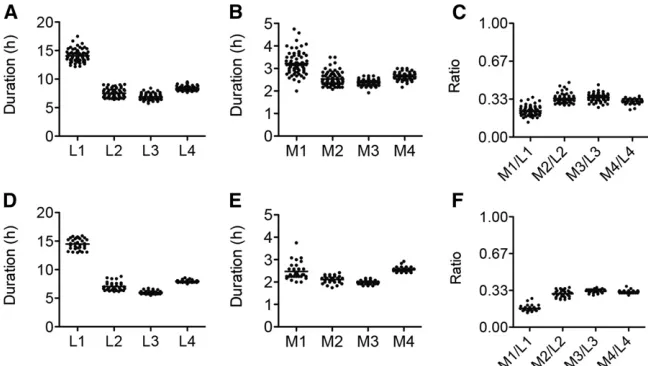
Figure 2 Quantitative analysis of the
(K03A1.5) gene (Lagidoet al. 2008). Thefluorescence signal remains stable during the molt, indicating that the LUC::GFP fusion protein is not cycling through development to yield rhyth-mic light emission (Figure 1D). This is furthermore predicted by work showing that sur-5expression does not oscillate during larval development (Kimet al.2013; Hendrikset al.2014).
Firefly (Photinus pyralis) LUC catalyzes the conversion of the substrate luciferin, supplied in the media, into oxyluciferin. This occurs in a two-step reaction that additionally requires ATP and oxygen and produces AMP, CO2, and light (Wetet al. 1987). Given that oxygen diffuses through the cuticle and luciferin does not (Lagido et al. 2008), the decrease in the signal must be due to depletion of ingested luciferin, endoge-nous ATP, or a combination of both.In vitromeasurements of endogenous ATP levels do not correlate with luminescence during the molt (R2= 0.0305). ATP levels increased during the last hours of the L1 stage and then decreased to a trough at the end of the molting period, 2 hr after the trough of the luminescence signal (Figure S1B). Upon transfer of an adult
to luciferin-free media, luminescence decreases at the same rate as during the entry into a molt (Figure S1C). Thus, lucif-erin is rapidly depleted in living animals when its uptake from media is blocked. During each molt,C. elegansform a plug of extracellular material in the buccal cavity and they cease pha-ryngeal pumping (Singh and Sulston 1978; George-Raizen et al. 2014). We conclude that a shortage in the supply of ingested luciferin is sufficient to explain the decrease in lumi-nescence signal during molts.
Quantitative analysis of developmental timing
Our method allows for longitudinal measurement of devel-opmental timing of single animals. The assay permits quan-titative analysis of the timing of each larval stage (L1, L2, L3, and L4; Figure 2, A and D) as well as that of the molts (M1, M2, M3, and M4; Figure 2, B and E). L1 is longer than L2, L3, and L4. This is in accordance with original observations on the timing of molting (Byerlyet al. 1976), although in this case we cannot disregard additional extension of the L1 stage
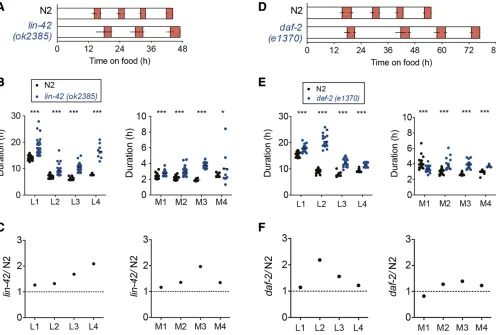
Figure 3 Developmental timing inlin-42 (ok2385)anddaf-2 (e1370)mutants. (A) Average duration of development for N2 (n= 37) andlin-42(n= 33)
due to a lag in the resumption of development after starvation-induced arrest. Similarly, M1 is longer than M2, M3, and M4. We calculated the ratio of the molt/larval du-ration for each stage. Except for thefirst stage (M1/L1), the molts are about one-third as long as the preceding larval stage (Figure 2, C and F).
Analysis of mutant phenotypes in developmental timing: lin-42 and daf-2
Severallin-42alleles have been investigated for the progression of larval development. The first description of these mutants indicated a precocious seam cell terminal differentiation that leads to the formation of adult-specific alae during the third molt (Abrahanteet al. 1998; Jeonet al. 1999). Many lin-42
animals fail to shed the L4 cuticle and execute the fourth molt (Abrahante et al. 1998). However, a detailed analysis of the timing of molting has been performed with only two lin-42
alleles,ok2385andn1089, showing reduced speed of develop-ment (Monsalveet al.2011). Consistent with this developmen-tal delay, the cyclic expression ofmolting defective-10(mlt-10), encoding a protein necessary for molting, shows an increased period in alfallele oflin-42(McCulloch and Rougvie 2014).
We therefore challenged our method using a lin-42
(ok2385) mutant. We crossed this mutant with the LUC::GFP reporter strain and analyzed developmental timing. At 21.5°, thelin-42animals progress through three larval stages in the time the N2 worms require to complete the developmental program (Figure 3A). The reduction of speed is significant for all steps of development (L1–L4, M1–M4; Figure 3B). The majority of animals (24 of 33) fail to execute the fourth molt—hence the relative dearth of data for L4 and M4 in the mutant animals (n= 9) (Figure 3B). All stages of develop-ment are significantly longer inlin-42mutants, with the third molt (M3) and the fourth larval stage (L4) taking twice as long as in the control strain (Figure 3C).
Environmental cues including food and temperature also control developmental speed and, when unfavorable, can lead to arrested development, namely as an alternative third larval stage called the dauer diapause (Cassada and Russell 1975). Mutations in the genedaf-2(Insulin/IGF-1 receptor) result in constitutive dauer formation (Daf-c) (Vowels and Thomas 1992). The allele daf-2(e1370)enters dauer at restrictive temperatures (Vowels and Thomas 1992) and shows a re-duced developmental speed at permissive temperature, espe-cially during the second larval stage (Ruaudet al.2011). We used thedaf-2(e1370)mutant for a second validation exper-iment. We grewdaf-2animals at 19.5°(permissive tempera-ture for theDaf-cphenotype) and, for thefirst time, were able to calculate the duration of all larval stages and molts of in-dividualdaf-2 animals (Figure 3D). The L2 stage was pro-longed (more than twofold) in the mutant compared to the wild-type animals (validation; Figure 3, E and F). Further-more, we observed a lengthening of all stages of development indaf-2(P,0.001), including the molts.
In summary, we describe a quantitative, high-throughput method using bioluminescence to report the fundamental
process of development in a genetic model organism. We used the alternation between feeding and fasting inC. eleganslarval development to generate a periodic bioluminescence signal, continuously recorded, to quantify the duration of the molts and larval stages in individual animals. The oscillation of the bioluminescence signal is ultimately generated by substrate availability, not by differential gene expression. In adult worms, when the mouth of the animal is not blocked, the luminescence signal could potentially be used to report for food intake. This is a plausible application that would contribute to the study of nutrition and metabolism inC. elegans.
In validating the method with the lin-42 and daf-2
mutants, we were able to describe the defects in developmen-tal timing due to mutations in the circadian clock gene ho-molog and theC. elegansinsulin receptor. We note that the traditional (e.g., visual inspection) methods are obviously sufficient to capture thelin-42anddaf-2mutant phenotypes (Monsalveet al.2011; Ruaudet al.2011), but they are time-consuming and not feasible for screening of large numbers of animals. The assay that we describe lends itself to high-throughput protocols, with individual animals in each well of a 384-well plate giving robust signals (Figure S3). Auto-mated phenotyping of large numbers of worms, as described here, should allow rapid progress in the identification of the developmental clock using genetics methods. The elucidation of the molecular mechanism of this biological clock will allow assessment of the mechanistic conservation with the circa-dian clock of insects and mammals and may help to tackle the molecular bases for the circadian rhythms described in C. elegans(Kippertet al.2002; Saigusaet al.2002; Simonetta et al.2009; van der Lindenet al.2010; Olmedoet al.2012). In addition, this method will allow the assessment of the effect of environmental factors, like temperature, diet, or presence of chemicals, in the progression of development.
Acknowledgments
Strains PE254 and PE255 were a gift from C. Lagido (University of Aberdeen). We thank the Caenorhabditis Genetics Center and the InternationalC. elegansGene Knockout Consortium for strains. We thank D. Lenssen for comments on data analysis; A. Fernández-Yáñez, Tanja Popp, and Angela Meckl for techni-cal help; A. van der Linden for comments on an earlier version of the manuscript; and the Conradt and Lambie labs for support. Our work is supported by the Ludwig-Maximilians-University Munich and the Friederich-Bauer-Stiftung (M.M., M.O., and M.G.); the European Research Council (ERC-2011-StG-281691) and the Spanish Ministerio de Economía y Competitividad (BFU2012-35509) (M.A.-S.); and a Marie-Curie Intra-European Fellowship (FP7-PEOPLE-2013-IEF/GA Nr: 627263) (to M.O. and M.A.-S.).
Literature Cited
Abrahante, J. E., E. A. Miller, and A. E. Rougvie, 1998 Identifi ca-tion of heterochronic mutants in Caenorhabditis elegans: tem-poral misexpression of a collagen:green fluorescent protein fusion gene. Genetics 149: 1335–1351.
Aschoff, J., 1965 Circadian rhythms in man. Science 148: 1427– 1432.
Brenner, S., 1974 The genetics ofCaenorhabditis elegans. Genetics 77: 71–94.
Byerly, L., R. C. Cassada, and R. L. Russell, 1976 The life cycle of the nematodeCaenorhabditis elegans. I. Wild-type growth and reproduction. Dev. Biol. 51: 23–33.
Cassada, R. C., and R. L. Russell, 1975 The Dauerlarva, a post-embryonic developmental variant of the nematodeCaenorhabditis
elegans. Dev. Biol. 46: 326–342.
Cho, J. Y., and P. W. Sternberg, 2014 Multilevel modulation of a sensory motor circuit duringC. eleganssleep and arousal. Cell 156: 249–260.
George-Raizen, J. B., K. R. Shockley, N. F. Trojanowski, A. L. Lamb, and D. M. Raizen, 2014 Dynamically-expressed prion-like pro-teins from a cuticule in the pharynx ofCaenorhabditis elegans. Biol. Open 3: 1139–1149.
Hardin, P. E., J. C. Hall, and M. Rosbash, 1990 Feedback of the
Drosophila periodgene product on circadian cycling of its
mes-senger RNA levels. Nature 343: 536–540.
Hendriks, G.-J., D. Gaidatzis, F. Aeschimann, and H. Groshans, 2014 Extensive oscillatory gene expression duringC. elegans
larval development. Mol. Cell 53: 380–392.
Iwanir, S., N. Tramm, S. Nagy, C. Wright, D. Ishet al., 2012 The microarchitecture ofC. elegans behavior during lethargus: ho-meostatic bout dynamics, a typical body posture, and regulation by a central neuron. Sleep 36: 385–395.
Jeon, M., and H. F. Gardner, E. A. Miller, J. Deshler, and A. E. Rougvie, 1999 Similarity of theC. elegansdevelopmental tim-ing protein LIN-42 to circadian rhythm proteins. Science 286: 1141–1146.
Kim, D. H., D. Grün, and A. van Oudenaarden, 2013 Dampening of expression oscillations by synchronous regulation of a microRNA and its target. Nat. Genet. 45: 1337–1344.
Kippert, F., D. S. Saunders, and M. L. Blaxter, 2002 Caenorhabditis
eleganshas a circadian clock. Curr. Biol. 12: R47–R49.
Lagido, C., J. Pettitt, A. Flett, and L. A. Glover, 2008 Bridging the phenotypic gap: real-time assessment of mitochondrial function and metabolism of the nematodeCaenorhabditis elegans. BMC Physiol. 8: 7.
Lagido, C., D. McLaggan, A. Flett, J. Pettitt, and L. A. Glover, 2009 Rapid sublethal toxicity assessment using
biolumines-cent Caenorhabditis elegans, a novel whole-animal metabolic
biosensor. Toxicol. Sci. 109: 88–95.
McCulloch, K. A., and A. E. Rougvie, 2014 Caenorhabditis elegans
period homolog lin-42 regulates the timing of heterochronic
miRNA expression. Proc. Natl. Acad. Sci. USA 111: 15450– 15455.
Monsalve, G. C., C. Van Buskirk, and A. R. Frand, 2011 LIN-42/ PERIOD controls cyclical and developmental progression of
C. elegansmolts. Curr. Biol. 21: 2033–2045.
Olmedo, M., J. S. O’Neill, R. S. Edgar, U. K. Valekunja, A. B. Reddy
et al., 2012 Circadian regulation of olfaction and an
evolution-arily conserved, nontranscriptional marker inCaenorhabditis elegans. Proc. Natl. Acad. Sci. USA 109: 20479–20484.
Raizen, D. M., J. E. Zimmerman, M. H. Maycock, U. D. Ta, Y.-J. You
et al., 2008 Lethargus is a Caenorhabditis elegans sleep-like
state. Nature 451: 569–572.
Roenneberg, T., and W. Taylor, 2000 Automated recordings of
bioluminescence with special reference to the analysis of circa-dian rhythms. Methods Enzymol. 305: 104–119.
Ruaud, A. F., I. Katic, and J. L. Bessereau, 2011 Insulin/insulin-like growth factor signaling controls non-Dauer developmental speed in the nematode Caenorhabditis elegans. Genetics 187: 337–343.
Saigusa, T., S. Ishizaki, S. Watabiki, N. Ishii, A. Tanakadateet al., 2002 Circadian behavioural rhythm inCaenorhabditis elegans. Curr. Biol. 12: R46–R47.
Schnabel, R., H. Hutter, D. Moerman, and H. Schnabel, 1997 Assessing normal embryogenesis inCaenorhabditis elegans
using a 4D microscope: variability of development and regional specification. Dev. Biol. 184: 234–265.
Schwarz, J., I. Lewandrowski, and H. Bringmann, 2011 Reduced ac-tivity of a sensory neuron during a sleep-like state inCaenorhabditis
elegans. Curr. Biol. 21: R983–R984.
Schwarz, J., J. P. Spies, and H. Bringmann, 2012 Reduced muscle contraction and a relaxed posture during sleep-like Lethargus. Worm 1: 11–13.
Simonetta, S. H., M. L. Migliori, A. Romanowski, and D. A. Golombek,
2009 Timing of locomotor activity circadian rhythms in
Caenorhabditis elegans. PLoS ONE 4: e7571.
Singh, R. N., and J. E. Sulston, 1978 Some observations on moult-ing inCaenorhabditis elegans. Nematologica 24: 63–71. Tei, H., H. Okamura, Y. Shigeyoshi, C. Fukuhara, R. Ozawaet al.,
1997 Circadian oscillation of a mammalian homologue ofthe
Drosophila periodgene. Nature 389: 512–516.
van der Linden, A. M., M. Beverly, S. Kadener, J. Rodriguez, S. Wasserman et al., 2010 Genome-wide analysis of light- and temperature-entrained circadian transcripts in Caenorhabditis
elegans. PLoS Biol. 8: e1000503.
Vowels, J. J., and J. H. Thomas, 1992 Genetic analysis of chemo-sensory control of Dauer formation in Caenorhabditis elegans. Genetics 130: 105–123.
Wet, J. R., K. V. Wood, M. DeLuca, D. R. Helinski, and S. Subramani, 1987 Firefly luciferase gene: structure and expression in mam-malian cells. Mol. Cell. Biol. 7: 725–737.
GENETICS
Supporting Information
www.genetics.org/lookup/suppl/doi:10.1534/genetics.115.179242/-/DC1
A High-Throughput Method for the Analysis of
Larval Developmental Phenotypes in
Caenorhabditis elegans
María Olmedo, Mirjam Geibel, Marta Artal-Sanz, and Martha Merrow
Figure S1. Restriction of luciferin intake is sufficient to reduce the luminescence signal.
A. Detail of the luminescence signal of the animal in figure 1A at the entry into each of the four molts. B. ATP levels measured in vitro and luminescence of a population of animals grown at 20.5 ° during late L1 to early L2. The graph shows data from 3 experimental replicates; error bars show s.e.m.
C. Individual adults were incubated in wells of a 96 well plate with 200 μl of S-basal media with 10 g
l-1E. coli OP50 (wet weight) and 100 μM D-Luciferin. Luminescence was read at 5-minute intervals.
Between the 25 and 30-minute readings the animals were washed three times in S-basal media and then transferred to a well with S-basal media and 10 g l-1E. coli OP50 (without luciferin). Between
the 55 and 60-minute readings, luciferin was added back to the media. The plot shows the mean ± s.e.m. (n=10).
0 20 40 60 80 100 0
100 200
300 molt 1
Time (min) Lu m in es cen ce (a .u .)
0 20 40 60 80 100 0 200 400 600 molt 2 Time (min) Lu m in es ce nc e ( a. u. )
0 20 40 60 80 100 0 500 1,000 1,500 molt 3 Time (min) Lum ines cenc e ( a. u. )
0 20 40 60 80 100 0
500 1,000 1,500
2,000 molt 4
Time (min) Lum inesc enc e ( a. u. )
12 14 16 18 20 22 24 0 500 1,000 1,500 0 4,000 8,000 12,000
Time on food (hrs)
nm ol es A T P /g o f p ro tei n Lu m ine sc en ce ( a. u. )
A
B
C
0 15 30 45 60 75 90 0
2,000 4,000 6,000
8,000 - luciferin
Figure S2. Determination of onset/offset of the molts. The raw data (A) was trend- corrected (B) and used to generate heat maps. To determine onset and offset of the molt, the trend corrected data was thresholded using 75% of the moving average (C) to produce a binarized output (D). Transitions in
the binarized data indicate the onset and offset of the molts (E). 0 6 12 18 24 30 36 42 48 54
0 1000 2000 3000
Time on food (hrs)
Lum
inesc
en
ce
(a.u.)
0 6 12 18 24 30 36 42 48 54 0
1 2 3
Time on food (hrs)
Lu
minesc
en
ce (a
.u
.)
0 6 12 18 24 30 36 42 48 54 0
1 2 3
Time on food (hrs)
Lu
minesc
en
ce (a
.u
.)
0 6 12 18 24 30 36 42 48 54 0
1 2 3
-1 0 1 2 3 4 5
Time on food (hrs)
Lu
m
in
es
cence (
a.u
.)
Bi
na
riz
ation
0 6 12 18 24 30 36 42 48 54 0
1 2 3
Time on food (hrs)
Luminescen
ce (a
.u
.)
0 6 12 18 24 30 3642 48 54 trend
correction threshold binarization
cleaning
0 6 12 18 24 30 36 42 48 54 Time on food (hrs)
A B C D
Figure S3. Luminescence signal from 3 representative wells of a 384-well plate.
0 12 24 36 48 60 72 0
200 400 600 800 1000
Time (h)
Lum
in
es
ce
nc
e (
a.
u.
)
0 12 24 36 48 60 72 0
200 400 600 800 1000
Time (h)
Lum
ines
ce
nc
e (
a.
u.
)
0 12 24 36 48 60 72 0
200 400 600 800 1000
Time (h)
Lu
m
ine
sc
en
ce
(a
.u