International Journal of Emerging Technology and Advanced Engineering
Website: www.ijetae.com (ISSN 2250-2459,ISO 9001:2008 Certified Journal, Volume 4, Issue 6, June 2014)
592
cSPADE -UE: Algorithm for Sequence Mining for
Unstructured Elements Using Time Gap Constraints
Pinkal Shah
1, Prof. (Dr.) A.K.Dua
21M.Tech, 2HOD, Computer Science, ASET, Amity University Rajasthan, Jaipur, India
Abstract--We present a new state machine that combines
two techniques for complex data sequences: Data modeling and frequent sequence mining. This algorithm relies on unstructured variable gap sequence miner, to mine frequent patterns with different gap between elements. Here we will have two variations: Sequence pruning technique for other primary frequent sequences to reduce space complexity and allow creating same sequence to form even if they do not have matching on all the positions. We apply algorithm to task of protein sequence classification on real data from protein families. A state of the art method for protein classification, by decreasing the state space complexity and improving the accuracy.
Keywords – Data Mining, Data modeling, Frequent
sequence for unstructured elements.
I. INTRODUCTION
Many real world applications, such as those in bioinformatiocs, web accesses, and text mining, finding sequential or temporary data with long range or short range dependencies. Techniques for analyzing such data that can be grouped in different categories like Pattern mining or data modeling. Few methods have been proposed for sequence pattern mining in both data mining [Srikant & Agrawal, 1996; Zaki 2001;]. For sequence data modeling have been widely used in a large scale of application as speech recognition, web surfing site or usage analysis [Pitkow and Pirolli 1999; Durbin et el 1998].
A simple, Markov model is stochastic process where each state depends on its only previous state. In regular models, each states produces only one symbol, and only the transition probabilities have to be estimated. A first order Hidden- Markov-Model, is actually has “Hidden” states. i.e. it may produce one or more symbols, according to the state-dependent output probabilities, which become additional parameters that have to be estimated. Due to their very basic nature: Hidden State: model may not capture longer range sequences. For this kind of problems many models [ Schwardt 2000; Galassi 2007] were proposed. However, building an m-order model requires estimation of the joint probabilities of the previous m states, Further, not all earlier states may be predictive on based on current state, Hence.
The training process is high state-space complexity, reduction coverage and moreover its wrong or less range prediction accuracy.
To address this limitation, we introduce a new technique for temporal and sequential data analysis that combines temporary pattern mining and data modeling. The main intension behind this approach is many real world applications are not able to model via Markov model due to complex embedded dependencies. So we introduced model (for Un-structured Elements) to discover and interpret king and short range data [1]. First step of our method uses a new sequence mining algorithm, called Variable-Gap Sequence miner (VGS), to mine variable-length frequent patterns that may contain different gaps between the elements. The second step of our technique uses the mined variable-gap sequences to automatically HMM for Unstructured Elements, i.e. the topology of the model is learned directly from the mined sequence multiple higher order HMMs via a single variable-order model with explicit duration.
II. RELATED WORK
A. Sequence Mining
International Journal of Emerging Technology and Advanced Engineering
Website: www.ijetae.com (ISSN 2250-2459,ISO 9001:2008 Certified Journal, Volume 4, Issue 6, June 2014)
593
B. Pattern Extraction: Variable-Gap Sequence (VGS)miner
Variable-Gap Sequence miner (VGS) is based on cSPADE [4]. While cSPADE essentially avoids the length and symbol distributions of gaps, VGS is specially designed to extract such patterns within one or more sequences. The key difference is that during mining VGS clearly keeps track of all the inter-mediate followed symbols, their frequency, and the gap frequency distributions, which are used to build our Model . VGS takes as input the maximum gap allowed (max_gap), the maximum sequence length (k), and the minimum frequency threshold (minsup). VGS mines all sequences having up to k elements, with no more than max_gap gaps between least minsup times in the data.
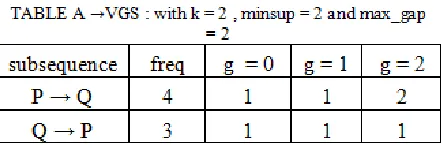
For example, let S = PRQSPWRQPSUVPXTQ be an input sequence over the alphabet Σ = {P, ···, X}, and let max_gap = 2, minsup = 2 and k = 2. VGS first mines the frequent subsequences of length 1, as shown in Table : VGS : 1 – Subsquences.
Those symbols that are frequent are extended to consider sequences of length 2, as shown in Table A. For example, P e→ Q is a frequent sequence with frequency freq = 3, since it occurs once with gap of length 1 (PRQ) and twice with a gap of length 2 (PWRQ and PXTQ). Thus the gap length distribution of P → Q is 0, 1, 2 as shown, in Table A, under columns g = 0, g = 1, and g = 2, respectively. VGS also records the symbol distribution in the gaps for each frequent sequence. For P → Q, VGS will record gap symbol frequencies as R(2),T(1),W(1),X(1), based on the three occurrences. Since k = 2, VGS would stop after mining sequences of length 2. Otherwise, VGS would continue mining sequences of length k ≥ 3, until all sequences with k elements are mined. Before we start describing VGS, we will provide definitions of some terms :
k-seq: Sequence of length k, i.e. k elements. For example, P→Q is 2-seq where Q occurs after P and P→Q→R is a 3-seq and soon.
Minsup: Minimum support is the minimum threshold for the frequency count of sequences.
max_gap: Maximum gap allowed between any two elements of a k-seq.
F1: The set of frequent1-seq (single items).
Fk: The set of all k-seq which frequency is higher than the minimum threshold minsup and the gap between their elements is at most of length max_gap
International Journal of Emerging Technology and Advanced Engineering
Website: www.ijetae.com (ISSN 2250-2459,ISO 9001:2008 Certified Journal, Volume 4, Issue 6, June 2014)
594
The key features of our approach are:1.We use Vertical id-list database format of SPADE, where sequence is associated with list of objects in which it occurs and its time stamp.
2.We use lattice approach separate original process into sub smaller process so it can be running independently, this will reduce IO cost, since we require very less database scan.
Main reason behind cost efficient is we reduce database scans by using depth first search [2] . a vertical database format, where id-list of each item in dataset, Each entry in id-list is a (sid, eid) pair. Eid deals with the item exist in sequence which id is sid. Sid is the sequence id in the dataset and eid is event id where item exists.
In earlier Example we have 9 different items { P,Q,R,S,T,U,V,W,X }. The id-list is shown as in Table B. By joining items it will help to check frequency of items. By this example , as we join Q and P then it will be Q ˅ P = { Q → P ,P → Q }; this will give maximum subsequences formed in data set by P and Q ( with maximum gap length).
These are main steps:
F1 : we compute all unique items in data set and frequencies compare to minsup. This can be done by scanning it-list incrementing the support for each sid . It’s
[image:3.612.60.281.142.218.2]different from SPADE where only sid will be considered to take patterns around them.
TABLE B : Is-list for item A
SID EID
1 1
1 5
1 9
1 13
But in our method we find patterns around sequences and with sequences.
F2 : we compute 2-seq with gap of g between elements. g { 0, …. , max_gap}, Here g = 0 relates to no elements between two main elements of our sequence. g = 1 relates to 1 element between sequence and so on. It can be done by scanning id-list order wise. We for each pair we have input sequence whose id is sid . we raise the frequency if difference between two eid events less than max_gap allowed.
Enumeration of all frequent sequences, with freq-uency at least minsup, with variable gap as depth first search with each class. For Example, the 3- seq P → Q → R has gap g1 { 0, …. , max_gap}, between P and Q and gap g2 { 0, …. , max_gap} between Q and R. where “P → Q “ means P followed by Q after g1 elements between them and “Q →
R “ means Q followed by R after g2 elements between
them as described in algorithm.
The input to the procedure is a set of items of sub lattice S, along with their id-lists and the minsup and max_gap. The sequence suppose to be frequent from atoms proceed to next level.
III. ALGORITHM
1] Procedure cSPADE (min_sup, maxgap)
2] P = {Parent Class Pi};
3] For each parent class Pi P do
4] Enumerate-Frequent-Seq (Pi, max_gap);
5] End for
6] End procedure
7] Function Enumerated-Frequent-Seq(S, minsup, max_gap)
8] For all sequences vi d do
9] Ti = ;
10] For all items vj S with j i do
11] R= new candidate sequence from vi and vj ;
12] L(R) = L (vi ) L (vj ) ; with 0 (vi (eid) - vi
International Journal of Emerging Technology and Advanced Engineering
Website: www.ijetae.com (ISSN 2250-2459,ISO 9001:2008 Certified Journal, Volume 4, Issue 6, June 2014)
595
13] If freq( R ) minsup then14] Ti = Ti U { R };
15] FR = FR U { R };
16] End if
17] End for
18] Enumerated – Frequent –Seq (Ti);
19] End for
20] Delete S;
21] End function
C. SUMMARY
In this paper we have introduced a new algorithm Variable Gap Sequence Miner to find frequent patterns to find different gaps and lengths between elements across and within sequences. It’s based on cSPADE [2], a method to find sequences on constraints based. While cSPADE ignores distribution of gaps and length. VGS is designed to extract more sequences from our generated sequences. It explicitly keeps track of all the intermediate symbols , their frequency and gap. Its main part for extracting patterns.
IV. EXPERIMENTAL EVALUATION
[image:4.612.323.576.117.489.2]The Scope data set is divided into four hierarchical levels: Superfamily,Class,Fold and Family. For SCOP 1.61 (from 2002), the 44327 protein domains were classified into 701 folds, resulting in an average of 64 domains per fold. The number of domains per fold varies in SCOP, where some of the folds, such as T IM barrels, are highly populated, while some of the folds, such as the HSP 40/DnaJ peptide-binding fold that only contain one protein, contain a few examples. Therefore, the SCOP is an imbalanced data set. This imbalanced proportion of examples in each fold contributes to the poor performance of classical machine learning techniques such as support vector machines and neural networks [4]. When learning from such data sets, existing machine learning approaches tend to produce a strong discriminatory classifier or ”high accuracy” with very low sensitivity or completeness. We used 10 superfamilies from the SCOP data set (ftp://ftp.rcsb.org/pub/pdb/derived data/pdb_seqres.txt) namely, family 49417, 46458, 46626, 46689, 46997, 47095, 47113, 48508, 69118, and 81296. We will refer to them as SF1 to SF10 respectively. Each family has 10sequences. We divided each family data set into 0.9 (9 sequences for each family)for training and 0.1 for testing (1 for each family to a total of 10 sequences).
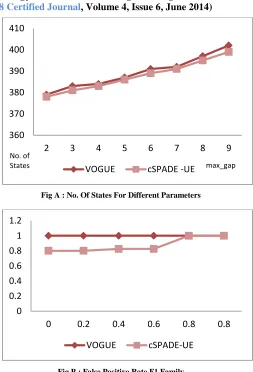
Fig A : No. Of States For Different Parameters
Fig B : False Positive Rate F1 Family
Here, state space complexity of the two methods. The highest number of states in VOGUE is having, N=402 , where as minsup = 18 and max_gap = 9. And where our algorithm is having highest state = 400, minsup = 30 and max_gap = 9. And it follow the fact that higher minsup leads to less but accurate frequent sequences.
We have built a machine for data and Fig B shows result of two models over dataset. With different max_gap.
V.CONCLUSION
Here we have used two types of technique one we have used variable-Gap sequence mining (VGS), to mine frequent patterns and second step to mine sequences to build accurate sequences using min gap between two important items. We have created extra step for mined sequences and to find elements between our sequences if their length is more than specified length and gap between items are more than max_gap then that sequence will be pruned.
360 370 380 390 400 410
2 3 4 5 6 7 8 9
VOGUE cSPADE -UE
No. of
States max_gap
0 0.2 0.4 0.6 0.8 1 1.2
0 0.2 0.4 0.6 0.8 0.8
International Journal of Emerging Technology and Advanced Engineering
Website: www.ijetae.com (ISSN 2250-2459,ISO 9001:2008 Certified Journal, Volume 4, Issue 6, June 2014)
596
We have reduced some of the states which will help to reduce space complexity and improve performance of the algorithm. As shown in Fig. A performance of the algorithms and result of improvement.REFERENCES
[1 ] M. J. Zaki. Sequences mining in categorical domains: Incorporating constraints. November 2000
[2 ] M. J. Zaki. SPADE: An efficient algorithm for mining frequent Sequences. Machine learning journals, 42, jan/Feb 2001.
[3 ] L. Sauland M. Jordan. Mixed memory markov models: Decomposing complex stochastic processes as mix of simpler ones. Machine Learning, 37(1):75–87, 1999
[4 ] M.J. Russell and R. K. Moore. Explicit modeling of state occupancy in hidden markov models for automatic speech recognition. Pages 5– 8, 1985
[5 ] J.Pitkow and P.Pirolli. Mining longest repeating subsequence to predict WWWsurfing.1999
[6 ] J.Pei, J.Han, B.Mortazavi-Asl, H.Pinto, Q.Chen, U.Dayal, and M-C.Hsu. Prefixspan: Mining sequential patterns efficiently by prefix projected pattern growth. April2001
[7 ] H.Mannila and H.Toivonen. Discovering generalized episodes using minimal occurrences. 2dIntl. Conf. Knowledge Discover and DataMining,1996
[8 ] J.Lin, E.Keogh, S.Lonardi, and P.Patel. Finding motifs in time series. Temporal Data Mining Workshop Notes and K.P.Unnikrishnan and R.Uthurusamy and eds, July2002