A n e w m i ti g a ti o n s c h e m e t o
r e si s t p r o g r e s siv e c oll a p s e of RC
s t r u c t u r e s
Alo gl a , KD, We e k e s , L a n d Au g u s t h u s N e l s o n , L
h t t p :// dx. d oi.o r g / 1 0 . 1 0 1 6 /j.c o n b u il d m a t . 2 0 1 6 . 0 8 . 0 8 4
T i t l e A n e w m i ti g a ti o n s c h e m e t o r e si s t p r o g r e s siv e c oll a p s e of RC s t r u c t u r e s
A u t h o r s Alo gl a , KD, We e k e s , L a n d Au g u s t h u s N e l s o n , L
Typ e Ar ticl e
U RL T hi s v e r si o n is a v ail a bl e a t :
h t t p :// u sir. s alfo r d . a c . u k /i d/ e p ri n t/ 4 0 0 2 8 /
P u b l i s h e d D a t e 2 0 1 6
U S IR is a d i gi t al c oll e c ti o n of t h e r e s e a r c h o u t p u t of t h e U n iv e r si ty of S alfo r d . W h e r e c o p y ri g h t p e r m i t s , f ull t e x t m a t e r i al h el d i n t h e r e p o si t o r y is m a d e f r e ely a v ail a bl e o nli n e a n d c a n b e r e a d , d o w nl o a d e d a n d c o pi e d fo r n o
n-c o m m e r n-ci al p r iv a t e s t u d y o r r e s e a r n-c h p u r p o s e s . Pl e a s e n-c h e n-c k t h e m a n u s n-c ri p t fo r a n y f u r t h e r c o p y ri g h t r e s t r i c ti o n s .
A NEW MITIGATION SCHEME TO RESIST PROGRESSIVE
1COLLAPSE OF RC STRUCTURES
2Kamal Alogla1, Laurence Weekes1, Levingshan Augusthus-Nelson1
3
1School of Computer Science and Engineering, University of Salford, Manchester,
4
United Kingdom 5
ABSTRACT
6Reinforced concrete structures may be vulnerable to progressive collapse due to lack of 7
sufficient continuous reinforcement. In most guidelines, general structural integrity 8
requirements to reduce progressive collapse have been introduced, but the design of structures 9
against progressive collapse has not been a major consideration. A mitigation scheme is 10
proposed to increase resistance against progressive collapse. This involves the provision of 11
additional reinforcement bars in the mid-layer of reinforced concrete beams. In the research 12
reported here, four specimens were designed and tested subject to quasi-static loading 13
conditions for a column removal scenario. One test specimen was made with conventional steel 14
reinforcement and three specimens were made with additional steel reinforcement at the mid 15
depth of the beam. The quasi-static behaviour of the test specimens were converted to a 16
dynamic representation using an energy balance approach to obtain the progressive collapse 17
load. Test results show that the proposed scheme significantly improves the ductility and 18
collapse load of concrete beams subject to a column removal scenario. 19
INTRODUCTION
20Progressive collapse is a situation where local failure is followed by collapse of adjoining 21
members, which in turn causes global collapse and can eventually result in great loss of life 22
and injury. Design of structures against progressive collapse has not been an integral part of 23
structural design[1]. However, General Service Administration [2] and Unified Facilities 24
likelihood of progressive collapse by altering the load path. Structural resistance against 26
progressive collapse can be improved by increasing redundancy and continuity of the structure, 27
and ductility of structural members. Redundancy will allow the structure to redistribute the 28
load from the lost structural member to an alternative load path through the remaining structural 29
members. This can only be achieved through continuity of the structure and the provision of 30
adequate ductility. To achieve continuity in structural components, tie forces are required to tie 31
the elements together so that they act as one unit. In general code provisions, structural integrity 32
reinforcement is detailed to improve redundancy and ductility in structures[4]. 33
When one of the critical load bearing elements is damaged or removed, connecting spans 34
deflect until the rotational capacity provided by the adjacent beams or slabs is exhausted. Then, 35
catenary action may allow the beam to carry vertical loads at large displacements. Catenary 36
action is considered as the last line of defence for a structure to mitigate progressive collapse 37
when a load bearing element is removed or damaged. Regan [5] concluded that the successful 38
development of catenary action requires that the members in question possess not only tensile 39
strength but also ductility, which is largely determined by the detailing of longitudinal 40
reinforcement. The beam above a removed column undergoes three structural mechanisms: 41
flexural action (FA), compressive arch action (CAA) and catenary action. Initially, all beams 42
mobilize flexural action, which they are designed for and they are able to sustain the design 43
load. When a column is removed, the span of the beam increases and in most cases leads to 44
large deflection occurring in the beam. Compressive arch action, which enhances the flexural 45
strength at critical sections, can be mobilized in the presence of axial compression provided by 46
stiff lateral restraints[5]. At large deflections, catenary action can be mobilized. Orton [6] found 47
that catenary action will not begin until the beam has reached a deflection approximately equal 48
to the depth of the beam. 49
Existing buildings designed using design codes are prone to progressive collapse due to 50
insufficient robustness in concrete frames. Consequently, numerous researchers such as Choi 51
[12] [13], Ren et al. [14] and Alogla et al.[15] have studied the structural behaviour of RC sub-53
assemblages subjected to column removal scenarios. Progressive collapse was studied 54
theoretically by Izzuddin et al.[16], Xu and Ellingwood [17] and Li et al.[18]. The theoretical 55
investigations have resulted in simplified models to estimate the ultimate collapse load[16]. 56
Furthermore, researchers have been developing new methods to enhance the progressive 57
collapse resistance. For example, Izadi and Ranjbaran [19] and Hadi and Alrudaini [20] 58
proposed a scheme to resist progressive collapse by transferring the loads after column failure 59
by suspending vertical cables at the top to a steel hat braced frame. Orton [6] suggested 60
increasing the continuity of a beam by using carbon fibre reinforced polymer (CFRP). Yu and 61
Tan [21] suggested adding steel rebar layers at the mid-height of the beam section, using partial 62
hinges and partially de-bonding bottom reinforcement in the joint region. 63
From experimental studies [8,9,10,11], it was noticed that the top and bottom steel 64
reinforcements at beam ends and middle joint, are vulnerable for fracture in the event of 65
progressive collapse. Therefore, presence of additional steel layer will enhance the structural 66
integrity by absorbing the released energy due to the redistributed load. In addition, the 67
additional steel bars can increase the tying capacity of RC beams and tensile capacity in 68
catenary action when it is developed. 69
In this paper, an economical scheme is proposed to increase progressive collapse capacity by 70
adding two steel bars to the beam section throughout the beam length. In order to optimise the 71
best location for the added steel layer, these bars will be added at different elevations within 72
the beam section. The proposed scheme is easy to implement and will stand as an integral part 73
of the structure, which allows for other structural members to function without any restrictions. 74
In order to validate the proposed scheme, an experimental study of structural response of four 75
RC sub-assemblages under a column removal scenario (CRS) were conducted and are 76
EXPERIMENTAL PROGRAM
78A series of experiments were carried out to investigate progressive collapse resistance 79
mechanisms and their capacities for RC beam-column sub-assemblages under CRS. In 80
addition, the program studies the effect of the proposed mitigation scheme on progressive 81
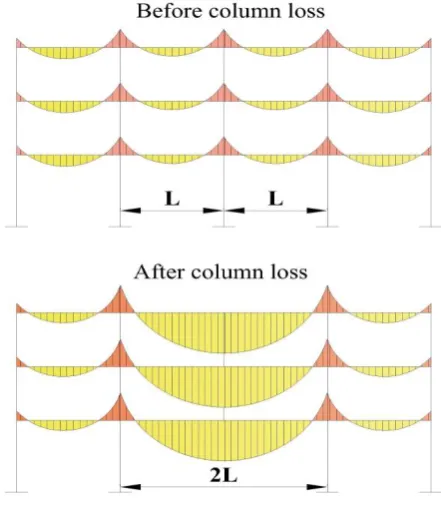
collapse resistance at compressive arch action and catenary action. Figure 1 shows the effect 82
of column removal on a typical building. As seen in Figure 1, the bending moment significantly 83
increases (approximately 4 times) due to doubling the span. Furthermore, the moment over the 84
missing column reverses direction, positive where the beam was designed for negative 85
moment. All these changes may not be considered in conventional design. 86
[image:5.595.185.406.283.537.2]87
Figure 1: Moment distribution of a typical structure before and after column removal 88
89
DESIGN OF SPECIMENS
90
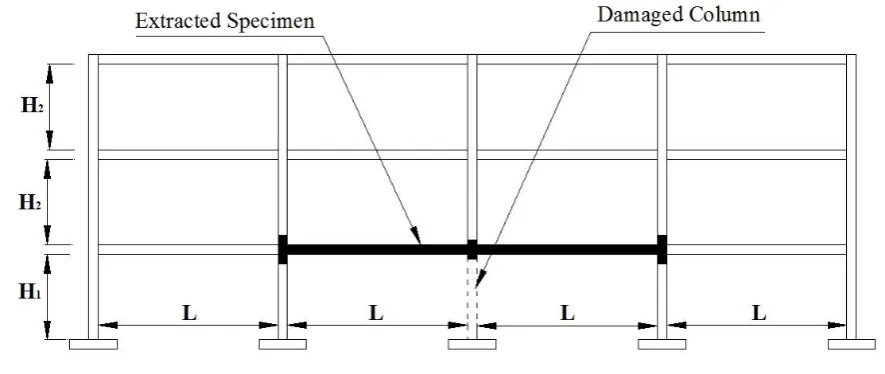
The specimens were designed to be extracted from the middle of a multi-storey, multi-bay 91
frame building. Figure 2 shows part of a structure with the shaded area being directly affected 92
by a removed column which represents the test specimen. A prototype frame building was 93
designed and detailed according to ACI 318-05 [22] for non-seismic regions. The specimen 94
end support and focusing on structural mechanisms of the beam, the two end beam column 96
stubs were enlarged to provide sufficient stiffness for the beam. Therefore, they had a much 97
larger sectional size and provided an adequate space in which the longitudinal reinforcement 98
could be well anchored. Figure 3 shows the dimensions and detailing of a typical specimen. 99
The experimental program comprised the testing of four specimens: three specimens included 100
the proposed new scheme and one specimen was constructed with conventional reinforcement 101
detailing. 102
103
[image:6.595.39.528.227.719.2]104
Figure 2: Test specimen in building front view 105
106
107
Figure 3: Conventional specimen dimensions and reinforcement details 108
[image:6.595.74.517.234.421.2]PROPOSED SCHEME
110
Utilizing catenary action to provide a structure with greater load capacity than FA and CAA is 111
one of the best options to mitigate progressive collapse of buildings. The catenary action 112
mechanism requires that the concrete beam has significant continuity, ductility and sufficient 113
tensile strength in the beam-column joint connection, which depends on the detailing of steel 114
reinforcement. In order to provide a beam and joint with the required continuity, ductility and 115
redundancy, the scheme proposes to add two additional longitudinal bars at different elevations 116
of the beam section as shown in Figure 4. 𝑑 𝑎𝑛𝑑 𝑑′ in figure 4 represent the effective beam 117
depth and the distance from the extreme compression fibre of concrete to the centroid of 118
compression reinforcement respectively. 119
For all specimens, the ratio of top steel reinforcement at the middle joint and at the beam ends 120
was 0.72% using 3T10 steel bars, and the ratio of bottom steel reinforcement at the middle joint 121
and at the beam ends was 0.48% using 2T10 steel bars. The additional steel bars are placed 122
throughout the length of the specimen. ehT"T" symbol refers to deformed reinforcement bars, 123
which have an area of 78.5 mm2. Figure 4 shows each specimen’s designation and details. 124
[image:7.595.84.504.452.708.2]125
Figure 4: Designation and details of each specimen 126
TEST SETUP AND INSTRUMENTATION
128
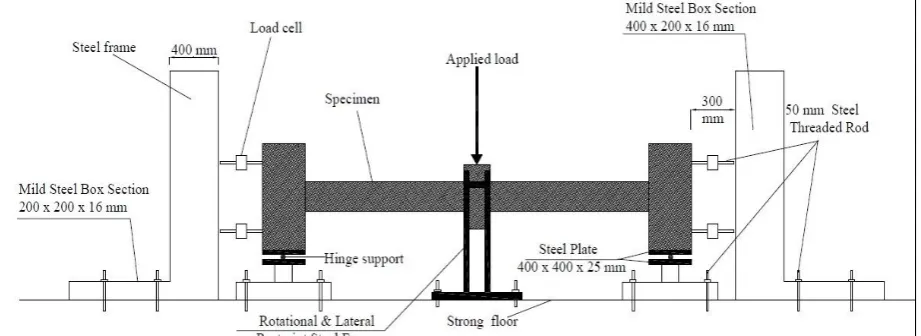
Figure 5 shows a schematic plot for the loading test rig. To simulate the axial horizontal 129
restraint for the beams, the ends of the specimens were connected to a steel frame by two load 130
cells at each end, and these load cells were used to measure the horizontal forces that developed 131
through the specimen during the test. In the vertical direction, a hinge roller support was used 132
to restrain each end of the specimen. The hinge roller support reduces the effect of the vertical 133
reaction on the horizontal reaction i.e. the vertical and horizontal reactions will be independent 134
of each other. 135
The load cells used to measure the reactions in the horizontal direction had a capacity of 136
250kN in both tension and compression. The load was applied at the top of the middle joint 137
using a hydraulic actuator with displacement control until total failure of the specimens. An 138
actuator with a built-in load cell was attached into a steel frame fixed into the strong floor of 139
the laboratory. A steel plate and roller was used to support the bottom of each of the end column 140
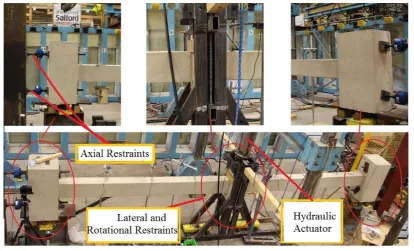
stubs. Because of the slenderness of the specimens, a lateral steel restraint was provided near 141
the centre of the specimens to prevent out-of-plane movement as shown in Figures 5 and 6. 142
The testing frame was designed to provide adequate lateral stiffness to resist the expected 143
compressive and tensile forces during CAA and catenary actions without frame failure. The 144
stiffness of the lateral supports was at the level of 105 𝑘𝑁/𝑚 ,which evaluated based on the 145
test rig design. 146
147
[image:8.595.65.526.592.760.2]Figure 5: Schematic view of the test specimen and test rig
149
150
151
[image:9.595.91.506.112.363.2]152
Figure 6: Test rig restraints 153
154
The RC sub-assemblage specimens were mounted with measuring instruments both internally 155
and externally. The load imposed by the actuator was measured using an in-built load cell, 156
which was connected in series with the hydraulic actuator jack. Seven external linear variable 157
differential transformers (LVDT) were arranged to measure vertical displacement along the 158
length of the specimens. Four load cells were attached to the column stubs at the ends of 159
specimen to measure axial forces developed during the tests. These load cells have the ability 160
to measure tension and compression forces. Figure 7 shows the lay-out of instrumentation 161
along half of the sub-assemblage.
162
164
Figure 7: Arrangement of instrumentation 165
In order to monitor the development of internal stresses and forces for different structural 166
mechanism phases, strain gauges were installed on the longitudinal steel reinforcement and 167
attached at critical sections. These sections include faces of joints and additional steel 168
reinforcement. Figure 8 shows the layout of strain gauges and their locations in the sub-169
assemblage specimens. 170
171
Figure 8: Locations of strain gauges. a) Front view, b) Top bars, c) Bottom bars 172
173
TEST PROCEDURE
174The load was applied using a hydraulic actuator jack with a monotonic loading regime until 175
[image:10.595.118.474.363.613.2]and H2 in Figure 7) were measured using load cells, and the applied load was measured using 177
the in-built load cell of the actuator. The displacement of the middle joint (MJD) and along the 178
length of the beam was measured using LVDT’s as shown in Figure 7. Therefore, the beam 179
deflection at each load step could be determined, and axial forces developed through the beam 180
could be calculated for each deflection value corresponding to each load step. In addition, strain 181
gauges attached to the steel reinforcement were used to measure the strain in the steel bar at 182
each load step. These strains can be converted into stresses and then to forces, which indicate 183
the development of each resisting mechanism such as compressive arch action and catenary 184
action. 185
The test data and results were collected and recorded simultaneously at a sampling rate of 1.0 186
Hz using an MTS data acquisition system. Relationships of MJD, horizontal reactions (axial 187
forces) and bar strains are plotted for each magnitude of applied load for all specimens. 188
189
MATERIAL PROPERTIES
190
The construction of the specimens was divided into two batches. Two specimens were cast in 191
each batch. For each specimen, three concrete cubes of dimension 100 x 100 x 100 mm were 192
sampled, during the process of casting, to obtain concrete compressive strength. One cylinder 193
of dimensions 300 mm height and 150 mm diameter was sampled and tested to obtain the 194
modulus of elasticity. Also one prism of dimension 400 x100 x 100 mm was sampled to obtain 195
the modulus of rupture. The compressive strength tests were carried out in accordance with 196
BS1881-116, 1983[23]. The modulus of elasticity testing carried out in accordance with 197
ASTM, C469-02[24]. 198
According to the specimen design, the targeted concrete compressive strength at 28 days was 199
28 MPa, the average value of tested cubes was taken as listed in Table 1. For steel reinforcing 200
bars, three samples of longitudinal bars were tested in tension. Steel reinforcement properties 201
are listed in Table 2. 202
Table 1: Concrete mechanical properties 204
Specimens Compressive Strength MPa
Modulus of Elasticity
MPa
Modulus of Rapture MPa
SS-1
SS-2 26.8 23120 2.9
SS-3
SS-4 27.5 24205 3.0
205
Table 2: Steel properties 206 Steel Type Yield Strength MPa fy Yield Strain Elastic Modulus MPa Es Ultimate Strength MPa fu Ultimate Strain Hardening Modulus MPa Eh
T10 510 0.0026 196154 650 0.13 1099
207
TEST RESULTS AND DISCUSSION
208In this section, experimental test results will be presented and illustrated at both global and 209
local levels. Test results at the global level include the relationships between applied load and 210
MJD, axial forces vs. MJD, failure mode and crack pattern. Axial forces were taken as the 211
average of axial forces at both ends of the specimen. Test results at the local level include the 212
relationship of rebar strains at critical sections with MJD. Moreover, test results have been 213
differentiated and categorized according to the resistance mechanism for three stages: flexural, 214
compressive arch action and catenary action. 215
For a building, “global” refers to the whole structure of the building system, while “local” 216
refers to each structural member individually. For this section, “global” refers to the structural 217
behaviour of the specimen, while “local” refers to the internal forces that developed during the 218
test. 219
220
TEST RESULTS AT GLOBAL LEVEL
221
The overall structural behaviour of RC specimens is described by the relationships between the 222
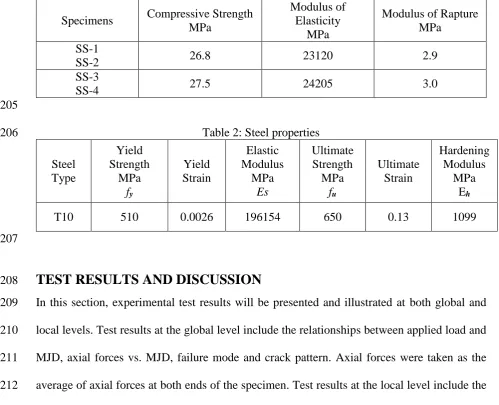
deflection. The deflected shape of the specimens can be illustrated by the deflection at specific 224
points along the length of the beam at different stages of loading. Figure 9 shows the deflected 225
shape curves of the specimens at specified load steps. 226
227
[image:13.595.72.521.144.350.2]228
Figure 9: Beam deformation for (a) SS-1, (b) SS-2, (c) SS-3 and (d) SS-4 229
230
It can be seen from Figure 9 that all beams deflected symmetrically at both sides of the 231
specimens. Also it can be observed that there is a large difference in displacement between the 232
stage of bottom bar fracture and top bar fracture. This can be related to the formation of plastic 233
hinges at the middle joint, which caused a large deflection at that stage. In contrast to other 234
specimens, specimen SS-3 shows no sign of bottom bar fracture during flexural and 235
compressive arch action. This can be explained by the presence of the additional steel 236
reinforcement bars, which enhanced the force carrying capacity in the tension zone in the beam 237
section, and resulted in fracture of the top bars firstly at a relatively large MJD. Deflection 238
curves of specimen SS-4 showed a limited rotation at the beam ends, whilst being larger at the 239
middle joint. This was due to the presence of additional steel bars at the top quarter of the beam 240
section. 241
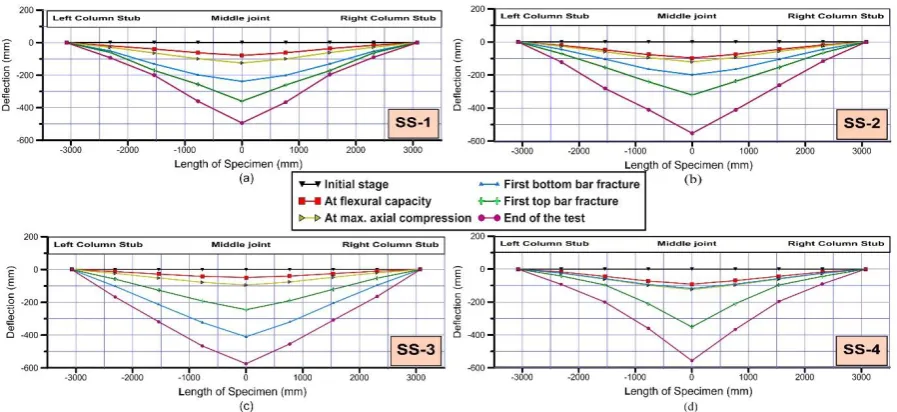
Based on the relationships of the applied load and the MJD of the specimens, the classification 242
shown in Figure 10. The overall trends of the load-displacement relationships for the specimens 244
were quite similar despite having different steel detailing and minimal differences in concrete 245
strengths, which results in different flexural capacity as can be seen from Figure 10. The peak 246
flexural capacities were 34.0, 37.9, 37.2 and 36.7 kN for SS-1, SS-2, SS-3 and SS-4 247
respectively. After the peak loads were reached, plastic hinges were developed and bar fracture 248
occurred. The abrupt large drops in the applied load shown in Figure 10 were due to subsequent 249
fracture of steel reinforcing bars at either bottom or top of the beam section. 250
251
[image:14.595.145.431.254.482.2]252
Figure 10: Applied load vs. MJD relationship of the specimens 253
254
Figure 10 shows the effect of the additional middle steel bars on the structural behaviour of RC 255
specimens. Within compressive arch action, the applied load for all specimens was larger than 256
specimen SS-1 by at least 8% for SS-4, and the peak applied load for specimen SS-2 was the 257
largest. At the catenary action stage, the applied load for all specimens was larger than 258
specimen SS-1 by at least 77% and the peak applied load for specimen SS-3 was the largest. 259
This indicates that the effect of the middle layer on catenary action was greater than its effect 260
on CAA. In other words, the additional middle layer is beneficial for an increase in tying 261
was larger than that for specimen SS-1 and the largest MJD was for specimen SS-3. This means 263
that the additional steel bars can increase the rotational capacity for RC specimens and the 264
optimum result can be obtained by placing the middle layer at a distance (𝑑 − 𝑑′)/4 from the 265
centre of the bottom bars. 266
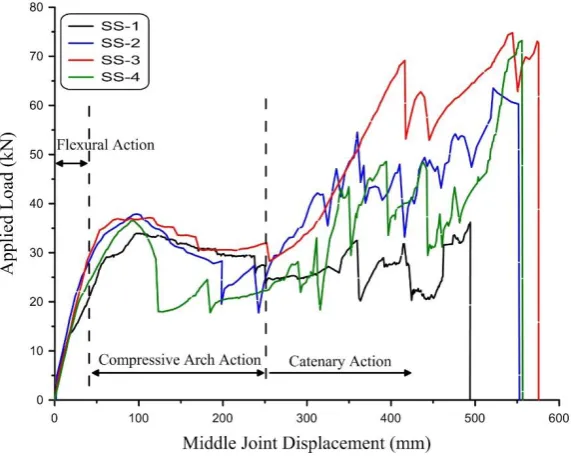
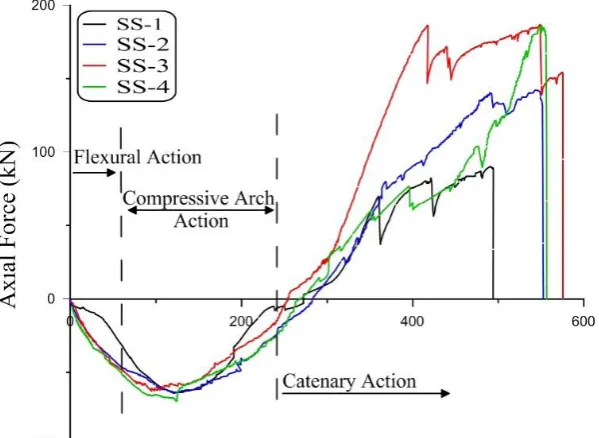
Figure 11 shows the distribution of axial forces within the specimens. Within CAA, the axial 267
forces developed were close to each other for all specimens. Transition points from CAA to 268
catenary action ranged from 254 mm to 283 mm for SS-3 and SS-2 respectively. Due to the 269
presence of additional longitudinal steel bars, the axial tension forces increased significantly. 270
As listed in table 3, tensile force for specimen SS-3 was the largest, and it was more than twice 271
the tensile force for specimen SS-1. Based on that and among the three locations of the 272
additional steel bars, the highest tying capacity can be achieved in the event of progressive 273
collapse by placing the middle layer at a distance (𝑑 − 𝑑′)/4 vertically above the centre of the 274
bottom bars. 275
276
[image:15.595.139.439.422.641.2]277
Figure 11: Axial force vs. MJD relationship of the specimens 278
280
In table 3, the calculated flexural capacity was based on section analysis without considering 281
[image:16.595.36.563.39.234.2]the effect of axial forces. 282
Table 4 demonstrates a comparison with the specimen SS-1 to investigate the effect of these 283
additional steel bars. It can be seen that with additional steel bars at the middle, the CAA 284
capacity was 12% greater than for specimen SS-1. The largest increase at catenary action was 285
109% for specimen SS-3 compared to specimen SS-1. This indicates that the additional steel 286
bars at the bottom quarter of the section can significantly increase progressive collapse capacity 287
at catenary action. 288
289
In order to obtain progressive collapse capacity for each specimen, the non-linear static 290
structural behaviour, which we will term ‘quasi-static response’, should be converted into non-291
linear dynamic behaviour. The proposed approach by Izzuddin et al. 2008 [16] was used to 292
obtain progressive collapse capacity. This approach is based on energy equilibrium, which 293
states that for the structure to be stable, the work done by applied gravity loads should be equal 294
to the energy absorbed by the structure. In other words, the structure should have enough strain 295
energy supply to absorb any energy demand caused by sudden loss of vertical support. In this 296
approach, the effect of damping was neglected because the event of progressive collapse occurs 297
in a very short time and the damping consumes little energy. Material strength enhancement 298
due to strain rate, which is usually expressed in the form of a dynamic increase factor (DIF) is 299 Specimen Calculated flexural capacity with MJD
Max. load at CAA
Pcom Max. Axial compression Force Max. Axial Tension Force
Max. Load at Catenary Action Pf (kN) MJD (mm) Pcom (kN) MJD (mm) 𝑀𝐽𝐷 ℎ Ncom (kN) MJD (mm) Nten (kN) MJD (mm) Pcat (kN) MJD (mm) 𝑀𝐽𝐷 ℎ
SS-1 28.0 57.9 34.0 101.0 0.40 63.8 125.6 89.2 494.0 36.2 494.0 1.98
SS-2 32.6 55.1 37.9 96.8 0.39 64.3 120.6 142.2 542.9 64.0 521.7 2.09
SS-3 32.2 48.2 37.2 86.8 0.35 62.7 94.6 186.9 549.0 75.6 549.0 2.20
neglected in this approach. Yu et al. [25]concluded that the DIF is small and can be 300
conservatively ignored for column removal scenarios. The converted non-linear dynamic 301
behaviour is called the pseudo-static structural behaviour. Figure 12(a) shows both static and 302
pseudo static responses for SS-1. For a given dynamic deflection 𝑢𝑑 the applied dynamic load 303
𝑃𝑑 can be obtained by equating the two hatched areas, which represent external work (𝑃𝑑× 304
𝑢𝑑) and strain energy ( ∫ 𝑃(𝑢)𝑑0𝑢𝑑 𝑢). Pseudo-static structural behaviour can be obtained by 305
repeating the process for each dynamic deflection. The accuracy of this approach has been 306
[image:17.595.77.514.267.425.2]validated by Tsai[26]. 307
Table 4: Applied loads compared to specimen SS-1 308
309
Figure 12(b) shows the pseudo-static structural behaviour of all specimens. The overall trends 310
of the specimens were similar, but with different peak load values. With the exception of 311
specimen SS-1, catenary action was able to increase the progressive collapse capacity. The 312
largest enhancement was 67 % at catenary action stage for specimen SS-2. 313
Table 5 lists the peak loads with their corresponding deflections and the ratio of enhancement 314
of catenary action stage. The lowest first peak was 25.9 kN for specimen SS-4 with lowest 315
MJD of 120.7 mm. 316
Specimen
Applied Load (kN) 𝑃 𝑐𝑎𝑡 𝑃𝑐𝑜𝑚
𝑃𝑐𝑜𝑚 𝑃𝑐𝑜𝑚(𝑆𝑆−1)
𝑃𝑐𝑎𝑡 𝑃𝑐𝑎𝑡(𝑆𝑆−1) 𝑃𝑓 𝑃𝑐𝑜𝑚 𝑃𝑐𝑎𝑡
SS-1 28.0 34.0 36.2 1.065 1 1
SS-2 32.6 37.9 64.0 1.69 1.12 1.77
SS-3 32.2 37.2 75.6 2.03 1.10 2.09
317
Figure 12: Pseudo-Static relationship for all specimens (a) Energy equilibrium approach for 318
SS-1, and (b) Pseudo-Static curves for all specimens 319
It is clear that the new proposed scheme to resist progressive collapse was able to increase RC 320
capacity at catenary action. The ultimate capacity can be achieved by adding steel bars to the 321
bottom quarter of the beam section. The effect of adding steel bars at the top quarter of the 322
beam section was marginal at the catenary action stage, while it decreases the capacity at CAA. 323
324
325
326
327
Table 5: Peak Loads with their corresponding deflections for all specimens 328
329
Specimen
First Peak Load at CAA
Max. Load At Catenary
action 𝑃𝑠𝑡
𝑃𝑠𝑡(𝑆𝑆−1)
𝑃𝑐𝑎𝑡 𝑃𝑐𝑎𝑡(𝑆𝑆−1) 𝑃𝑠𝑡
(kN)
MJD (mm)
𝑃𝑐𝑎𝑡 (kN)
MJD (mm)
SS-1 27.5 249.5 26.4 494.0 1 1
SS-2 29.7 163.8 37.4 553.0 1.08 1.42
SS-3 30.5 172.7 44.1 576.0 1.11 1.67
[image:18.595.76.520.35.211.2]CRACK PATTERN AND FAILURE MODE
330
The overall crack pattern and failure mode for the specimens were quite similar. At the flexural 331
action stage, the cracks were concentrated at the beam-column joint interfaces, which are 332
mainly caused by bending moments at these sections. Cracks developed during flexural action 333
with the presence of compressive arch action beginning from the extreme tension face of the 334
concrete, running vertically through the beam section and terminating at the location of the 335
neutral axis. As the applied load increased, the neutral axis moved towards the compression 336
face until the concrete crushed at the extreme surface in the compression zone. In contrast to 337
flexural action, cracks during catenary action, started to develop throughout the beam length 338
and passed completely through the beam section. With the increase of the applied load, wide 339
341
Figure 13: Crack pattern of specimen SS-1 at flexural and catenary action 342
343
It is worth mentioning that the cracks at catenary action were uniformly distributed along the 344
beam length and that a large slip between the steel bars and concrete was observed at the beam-345
column joint interfaces. Figure 13 shows the crack pattern of specimen SS-1 at flexural action. 346
It shows clearly the flexural cracks that developed at the beam-column joint interfaces. Figure 347
13 shows the crack pattern of specimen SS-1 at catenary action, which shows a uniform 348
distribution of the cracks along the beam length. 349
350
Figure 14 shows crack development at different stages of loading for the left end of the 351
specimen SS-3. Similar to the specimen SS-1, flexural cracks were developed at the beginning 352
action stage. Flexural cracks were concentrated at the interfaces of beam-column joints. 354
Flexural cracks developed from the extreme tension fibre of concrete, penetrated through the 355
beam section and stopped at the location of neutral axis. Point “B” in Figure 14 represents the 356
point of maximum axial compression force developed throughout the beam in which the 357
indication of concrete crushing was clear. After that point, concrete spalling occurred indicated 358
by the point “C”. 359
The failure of the specimen occurred after the point “F” at a deflection of 575.5 mm, indicated 360
by a rapid increase in the deflection associated with a decrease in the applied load. 361
362
[image:21.595.89.502.281.539.2]363
Figure 14: Crack development at the left beam end for specimen SS-3 364
365
TEST RESULTS AT LOCAL LEVEL
366
Bar strain measurements, which can be converted to bar forces, can shed light on the 367
contributions of reinforcing bars to the mobilization of different mechanisms. 368
Development of stresses and forces at the additional steel bars provides insight as to how these 369
bars affect the structural resistance mechanisms at both compressive arch and catenary action 370
modulus of elasticity and the area of the bar. Converted bar forces were plotted against the 372
MJD for each specimen. 373
Figure 15 shows the relationship between bar forces and MJD for specimen SS-1 and SS-3. 374
The designations FT, FB and FM refer to the force of the top, bottom and middle bars 375
respectively. For specimen SS-1, the transition in bar forces from compression to tension at 376
sections 1 and 3 occurred at a deflection which was more than the deflection of the onset of 377
catenary action for the specimen at global behaviour. The top bar force transition occurred with 378
the fracture of the bottom bar and vice versa. It can be seen from Figure 15 (a-d) that the tensile 379
forces during advanced catenary action were carried only by the bottom bars at the beam ends, 380
and only by the top bars at the middle joint interfaces. 381
At the early stages of loading, the bottom bars yielded at sections 2 and 3, followed by 382
fracture at both sections as shown in Figure 15. This means that the bottom bars are more 383
vulnerable in the early stages of progressive collapse. At the mid stages of loading, it can be 384
seen that the top bar is still carrying the loads at all sections, while at advanced stages of 385
loading, both bars were fractured at two sections at least. It is clear that the need for additional 386
bars at certain locations was crucial in order to reduce the probability of failure at critical 387
sections. 388
For specimen SS-3, it can be seen from Figure 15 that the middle layer enhanced the tensile 389
capacity of the beam by about 90.0 kN at catenary action, which is about 50% of the total force 390
provided by the top and bottom steel bars. Due to the location of the added bars, they behaved 391
similarly to the bottom bars, i.e. they carried compression forces at sections 1 and 4, while at 392
sections 2 and 3 they carried tensile forces. 393
394
Figure 16 shows bar forces for each section at different stages of loading. These stages were 395
chosen to represent each of the resisting mechanism phases. It should be mentioned that after 396
As shown in Figure 16b, for SS-1 at the catenary action stage, the bar at sections 2 and 3 was 398
fractured and the values of the curve should be equal to zero. 399
It can be seen that both bars contribute to the tension forces developed at the catenary action 400
stage. The change in the top and bottom bar forces during compressive arch action was smaller 401
than the change in forces during catenary action, as can be seen from Figures 16a and 16b. The 402
development of tension and compression forces for SS-1 and SS-3 at the top and bottom bars 403
were nearly equal throughout the length of the beam, as can be seen from Figure 16c. From 404
figure 16c, it is evident that the top and bottom bars at all sections were in tension, which 405
indicates the action of the catenary stage. 406
[image:23.595.88.507.282.638.2]407
409
Figure 16: Bar forces for different resisting mechanisms for specimen SS-1 and SS-3 410
411
ANALYTICAL ULTIMATE LOAD CAPACITY AT CATENARY
412ACTION
413Under concentrated applied load, it is expected that both bays of the sub-assemblage will 414
remain straight until the total collapse, which is clearly shown in figure 8. Based on this 415
expectation and figure 17, Li et al. [18]proposed a model to obtain ultimate load 𝑃𝑢 at catenary 416
action, which was then verified by Jian and Zheng [27], provided by equation 1 417
418
𝑃𝑢(𝐿𝑖) =(𝐿1+ 𝐿2)𝑣𝑢
𝐿1𝐿2 𝐴𝑡ℎ𝑓𝑢 (1) 420
419
Where 𝐿1 and 𝐿2 are the spans of beam 1 and beam 2, respectively, 𝑣𝑢 is the vertical 421
displacement of the removed column, 𝐴𝑡ℎ is the area of the steel bars through the whole span, 422
and 𝑓𝑢 is the ultimate stress of the steel bars in the frame beams. Detailed determination of 𝑣𝑢 423
425
Figure 17 Schematic diagram for two bay beam at catenary action 426
427
PROPOSED LOAD CARRYING CAPACITY AT CATENARY ACTION
428
Based on experimental observation and results, top and bottom bar fractures have occurred. At 429
large deflections, the tensile axial load was carried only by the bottom bars at the beam ends 430
and the top bars at the middle joint as shown in figure 18(a). The ultimate load capacity at 431
catenary action, 𝑃𝑢,can be obtained using a model, which is schematically shown in figure 432
18(b). The model is derived according to equilibrium at the middle joint considering fracture 433
of steel bars shown in figure 18(a). 434
𝑃 =2𝑁𝑠𝑖𝑛(𝜃) (2)
435
sin(𝜃) =𝛿𝐿𝑢
2 (3)
436
𝑁 = 𝑓𝑢𝐴𝑠 (4)
437
The load P is assumed to be resisted only by the vertical component of the tensile force N, 438
which is provided only by the intact steel bars. The tensile force contributions from the 439
concrete, the top bars at the support and the bottom bars at the middle joint are neglected. 440
Ultimate deflection, 𝛿𝑢, can be calculated based on the total elongation of steel bars that can 441
occur at the end of catenary action. Based on the assumption that the bar elongation is 442
concentrated in the plastic hinge region, and the plastic hinge length model proposed by 443
Mattock [28], the elongation, ∆𝐿 for each bay beam with two plastic hinges, can be obtained 444
∆𝐿 = 2𝜀𝑐𝑢𝑙𝑝 (5) 446
Where 𝜀𝑐𝑢 is the ultimate steel strain, 𝑙𝑝 is the plastic hinge length. According to Mattock, 𝑙𝑝 = 447
0.5𝑑 + 0.05𝑧, where z is the distance from the point of maximum moment to the point of zero 448
moment. From figure 18(b), 𝛿𝑢 can be obtained as follows: 449
𝛿𝑢 = √𝐿22− 𝐿2 (6)
450
𝐿2 = 𝐿1 + 𝛥𝐿 (7)
451
𝐿1 = √𝐿2+ (𝑑 − 𝑑′)2 (8)
452
Where, 𝐿2 is the final length of the bay beam at catenary action, L is the beam bay length, 𝐿1is 453
the beam length at the fracture of the steel bars, 𝑑 is the beam effective depth, and 𝑑′ is the 454
distance from the extreme compression fibre of concrete to the centroid of compression 455
reinforcement. 456
Based on equation 8 for obtaining L1, this model is only valid for a specimen designed using 457
the conventional approach. This is because L1 is calculated on the beam section with the top 458
and bottom steel bars only. 459
460
[image:26.595.76.507.458.627.2]461
Figure 18: Schematic modelling of a specimen at Catenary Action 462
VALIDATION AND COMPARISON
464
Based on the geometry and material properties of specimen SS-1, the calculated values of 465
vertical deflection 𝑣𝑢 and 𝛿𝑢 were 494.5 mm and 494.2 mm respectively. Substituting these 466
values in equations 1 and 2, 𝑃𝑢(𝐿𝑖)and Pu were obtained and their values were 73.3 kN and 467
36.7 kN respectively. Compared to experimental values, it can be seen that the ultimate 468
deflections were very close to the analytically calculated values. The calculated ultimate load 469
from the proposed model is 1.4% greater than the experimental results, while it is 102% greater 470
for 𝑃𝑢(𝐿𝑖). Based on the analytical results, it can be concluded that the proposed model in this
471
paper can accurately predict the ultimate deflection and applied load at catenary action. 472
However, due to the complexity of progressive collapse phenomena, the imperfection of 473
experimental data and some assumptions made in this paper, the proposed simplified model 474
should be validated by more experimental or numerical data. 475
476
CONCLUSIONS
477In this paper, four RC sub-assemblages were tested to investigate the progressive collapse 478
resisting mechanisms of RC structures under a middle column removal scenario. On top of
479
conventionally designed specimen SS-1, additional steel bars were added to the beam section
480
at three different elevations aiming to improve the resistance capacity of RC frames against
481
progressive collapse. The additional reinforcements were added at the mid-height of the beam
482
section in SS-2. For specimen SS-3 and SS-4, the additional steel reinforcements were added
483
at a distance equal to (𝑑 − 𝑑^′)/4 from the centre of the bottom and top longitudinal
484
reinforcement, respectively. 485
The experimental results showed that all specimens experienced three stages of resisting 486
mechanisms: flexural, CAA and catenary action, and behaviour was dominated by flexure in 487
the early stages of the response. With increased vertical displacement of the centre column, 488
“arching action” due to the restraint on axial elongation of the beams by the end columns. With 490
further increase in the vertical displacement, tensile axial forces developed in the beams, and 491
the behaviour was dominated by catenary action. 492
Compared with the conventionally designed specimen, the capacity of specimens with 493
modified detailing was 5% - 12% larger at CAA, while it was larger by about 52% - 109% at 494
catenary action. The specimen with additional reinforcement in the middle, attained the largest 495
ratio at CAA while the specimen with additional reinforcement at the bottom quarter attained 496
the largest ratio at catenary action. 497
The bottom bars were more vulnerable to fracture in the early stages of progressive collapse 498
due to the limitation in the rotational capacity of the beam section. . The additional bars near 499
the bottom bars can reduce the probability of early bottom bar fracture. This is due to load 500
sharing and increased tensile capacity, which in turn reduces the probability of progressive 501
collapse. 502
The specimen with additional bars at the bottom quarter achieved larger deformation, and
503
catenary action capacity in quasi-static response. The large deformation can be related to the
504
increase in the rotational capacity of the beam column connection, which in turn increases the
505
vertical projection of tensile forces at catenary action.
506
Pseudo-static results suggest that the presence of additional steel bars can increase progressive 507
collapse capacity, and the maximum capacity can be attained when placing two additional steel 508
bars at a distance of (𝑑 − 𝑑′)/4 from the centre of the bottom reinforcement. The increase in 509
progressive collapse capacity was 22% - 67%. 510
The overall crack pattern and failure mode for the specimens were quite similar. The failure of
511
all specimens was characterized by (1) Crushing of concrete at compression zones during flexural
512
action. (2) Development of flexural cracking during flexural and CAA. (3) Bar fracture at
beam-513
column interfaces. (4) Large slippage between concrete and steel bars caused wide cracks at critical
514
sections.
515
Based on experimental observation, a simplified model to predict ultimate deflection and 517
applied load at catenary action was proposed. The proposed model, which accounts for bar 518
fracture, can accurately predict load and deflection at catenary action. 519
520
ACKNOWLEDGMENTS
521The authors gratefully acknowledge the funding by the Iraqi cultural attaché in London-UK. 522
REFERENCES
5231. Kim, H., Progressive collapse behavior of reinforced concrete structures with deficient
524
details. 2006: ProQuest. 525
2. GSA, Progressive collapse analysis and design guidelines. U.S. General Services 526
Administration., 2003. 527
3. DOD, Design of buildings to resist progressive collapse. Unified Facilities Criteria 528
(UFC)-Deaprtment of Defence, 2004. 529
4. Merola, R., Ductility and robustness of concrete structures under accidental and
530
malicious load cases. 2009, The University of Birmingham. 531
5. Regan, P., Catenary action in damage concrete structures. ACI Special Publication, 532
1975. 48: p. 191-224. 533
6. Orton, S., Development of a CFRP system to provide continuity in existing reinforced
534
concrete structures vulnerable to progressive collapse. 2007: ProQuest. 535
7. Choi, H. and J. Kim, Progressive collapse-resisting capacity of RC beam–column
sub-536
assemblage. magazine of concrete research, 2011. 63(4): p. 297-310. 537
8. Sadek, F., et al., Testing and analysis of steel and concrete beam-column assemblies
538
under a column removal scenario. Journal of Structural Engineering, 2011. 137(9): p. 539
881-892. 540
9. Sasani, M. and J. Kropelnicki, Progressive collapse analysis of an RC structure. The 541
Structural Design of Tall and Special Buildings, 2008. 17(4): p. 757-771. 542
10. Su, Y., Y. Tian, and X. Song, Progressive collapse resistance of axially-restrained
543
frame beams. ACI Structural Journal, 2009. 106(5): p. 600-607. 544
11. Yi, W.J., et al., Experimental study on progressive collapse-resistant behavior of
545
reinforced concrete frame structures. ACI Structural Journal, 2008. 105(4): p. 433-439. 546
12. Yu, J. and K.H. Tan, Progressive collapse resistance of RC beam-column
sub-547
assemblages. 2010. 548
13. Yu, J. and K.-H. Tan, Experimental and numerical investigation on progressive
549
collapse resistance of reinforced concrete beam column sub-assemblages. Engineering 550
Structures, 2013. 55: p. 90-106. 551
14. Ren, P., et al., Experimental investigation of progressive collapse resistance of
one-552
way reinforced concrete beam–slab substructures under a middle-column-removal
553
scenario. Engineering Structures, 2016. 118: p. 28-40. 554
15. Alogla, K., Weekes, L., and Augusthus-Nelson, L., Progressive collapse resisting
555
mechanisms of reinforced concrete structures. Proceedings of the 5th International 556
Conference on Integrity, Reliability and Failure. Porto, Portugal , 2016: p. 479-480. 557
16. Izzuddin, B., et al., Progressive collapse of multi-storey buildings due to sudden column
558
loss—Part I: Simplified assessment framework. Engineering Structures, 2008. 30(5): p. 559
17. Xu, G. and B.R. Ellingwood, An energy-based partial pushdown analysis procedure
561
for assessment of disproportionate collapse potential. Journal of Constructional Steel 562
Research, 2011. 67(3): p. 547-555. 563
18. Li, Y., et al., An improved tie force method for progressive collapse resistance design
564
of reinforced concrete frame structures. Engineering Structures, 2011. 33(10): p. 2931-565
2942. 566
19. Izadi, I.T. and A. Ranjbaran, Investigation on a mitigation scheme to resist the
567
progressive collapse of reinforced concrete buildings. Frontiers of Structural and Civil 568
Engineering, 2012. 6(4): p. 421-430. 569
20. Hadi, M.N. and T.M.S. Alrudaini, A new cable system to prevent progressive collapse
570
of reinforced concrete buildings. 2010. 571
21. Yu, J. and K.H. Tan, Special detailing techniques to improve structural resistance
572
against progressive collapse. Journal of Structural Engineering, 2013. 140(3): p. 573
04013077. 574
22. ACI-318. Building code requirements for structural concrete (ACI 318-05) and
575
commentary (ACI 318R-05). 2005. American Concrete Institute. 576
23. BS1881-116, Testing concrete. Method for determination of compressive strength of
577
concrete cubes. 1983. 578
24. ASTM-C469, Standard Test Method for Static Modulus of Elasticity and Poisson’s
579
Ratio of Concrete in Compression. ASTM International., 2002. 580
25. Yu, J., et al., Dynamic Progressive Collapse of an RC Assemblage Induced by Contact
581
Detonation. Journal of Structural Engineering, 2014. 582
26. Tsai, M.-H., An analytical methodology for the dynamic amplification factor in
583
progressive collapse evaluation of building structures. Mechanics Research 584
Communications, 2010. 37(1): p. 61-66. 585
27. Jian, H. and Y. Zheng, Simplified models of progressive collapse response and
586
progressive collapse-resisting capacity curve of RC beam-column substructures.
587
Journal of Performance of Constructed Facilities, 2014. 28(4): p. 04014008. 588
28. Mattock, A.H., Rotational capacity of hinging regions in reinforced concrete beams.
589
Special Publication, 1965. 12: p. 143-181. 590