www.hydrol-earth-syst-sci.net/20/3343/2016/ doi:10.5194/hess-20-3343-2016
© Author(s) 2016. CC Attribution 3.0 License.
Projected impacts of climate change on
hydropower potential in China
Xingcai Liu1, Qiuhong Tang1, Nathalie Voisin2, and Huijuan Cui3
1Key Laboratory of Water Cycle and Related Land Surface Processes, Institute of Geographical Sciences and Natural Resources Research, Chinese Academy of Sciences, A11, Datun Road, Chaoyang District, Beijing, China
2Pacific Northwest National Laboratory, 1100 N Dexter Ave, Seattle, WA, USA
3Key Laboratory of Land Surface Pattern and Simulation, Institute of Geographical Sciences and Natural Resources Research, Chinese Academy of Sciences, 11A Datun Road, Chaoyang District, Beijing, China
Correspondence to:Qiuhong Tang ([email protected])
Received: 25 January 2016 – Published in Hydrol. Earth Syst. Sci. Discuss.: 4 February 2016 Revised: 20 June 2016 – Accepted: 31 July 2016 – Published: 22 August 2016
Abstract. Hydropower is an important renewable energy source in China, but it is sensitive to climate change, be-cause the changing climate may alter hydrological conditions (e.g., river flow and reservoir storage). Future changes and associated uncertainties in China’s gross hydropower poten-tial (GHP) and developed hydropower potenpoten-tial (DHP) are projected using simulations from eight global hydrological models (GHMs), including a large-scale reservoir regulation model, forced by five general circulation models (GCMs) with climate data under two representative concentration pathways (RCP2.6 and RCP8.5). Results show that the es-timation of the present GHP of China is comparable to other studies; overall, the annual GHP is projected to change by
−1.7 to 2 % in the near future (2020–2050) and increase by 3 to 6 % in the late 21st century (2070–2099). The annual DHP is projected to change by−2.2 to−5.4 % (0.7–1.7 % of the total installed hydropower capacity (IHC)) and−1.3 to−4 % (0.4–1.3 % of total IHC) for 2020–2050 and 2070–2099, re-spectively. Regional variations emerge: GHP will increase in northern China but decrease in southern China – mostly in south central China and eastern China – where numerous reservoirs and large IHCs currently are located. The area with the highest GHP in southwest China will have more GHP, while DHP will reduce in the regions with high IHC (e.g., Sichuan and Hubei) in the future. The largest decrease in DHP (in %) will occur in autumn or winter, when streamflow is relatively low and water use is competitive. Large ranges in hydropower estimates across GHMs and GCMs highlight the necessity of using multimodel assessments under climate
change conditions. This study prompts the consideration of climate change in planning for hydropower development and operations in China, to be further combined with a socioeco-nomic analysis for strategic expansion.
1 Introduction
(Liu, 2013; WEC, 2013). China will further foster its hy-dropower development in the near future (IEA, 2014) by tar-geting a total IHC of 350 GW in 2020, and most of it will be from the hydropower stations in southwest China (GOSC, 2014).
Reduced hydropower generation has been reported to be associated with climate change (Qiu, 2010; Bahadori et al., 2013), and significant progress has been made in assessing the impacts of climate change on hydropower elsewhere in the world. For example, it was reported that a future de-crease in climate-change-induced runoff would reduce en-ergy generation and revenues of hydropower plants under current regulations in the Columbia River and California hy-dropower systems in the United States (Hamlet et al., 2010; Vicuña et al., 2011). By assessing the hydropower system in the Peribonka River basin (Quebec, Canada), Minville et al. (2009) suggested that annual hydropower would decrease by 1.8 % for the 2010–2039 period and then increase by 9.3 and 18.3 % for the 2040–2069 and 2070–2099 periods, re-spectively. Considerable impact of climate change on hy-dropower was reported in the Swiss and Italian Alps regions, but the impacts varied for different locations, hydropower systems, and projections of climate change (Schaefli et al., 2007; Gaudard et al., 2014; Maran et al., 2014). Most studies suggested that new adaptive management may mitigate pro-jected losses of hydropower in the Alps regions (Majone et al., 2016).
China is a large country (about 9.6 million km2)and hy-dropower is and will be integrated in an electrical grid. Therefore, a large-scale assessment is required. Assessment of hydropower generation at large scales is more challeng-ing because of the complex linkages of rivers and reservoirs. Lehner et al. (2005) estimated the developed hydropower po-tential (DHP) of existing hydropower stations, by assuming it to be a proportion of IHC, using the WaterGAP model and forcings from two general circulation models (GCMs) (HadCM3 and ECHAM4) under a moderate climate change scenario, and showed that the DHP would decrease by 7 to 12 % over the entirety of Europe in the 2070s. Most recently, van Vliet et al. (2016) have used global macroscale inte-grated hydrologic modeling that includes a reservoir magement model and projected reductions in the global an-nual hydropower capacities of 0.4–6.1 % by the 2080s, based on the GCM-ensemble mean for representative concentration pathways (RCP2.6, 4.5, 6.0, and 8.5). Kao et al. (2015) found that federal hydropower generation will decrease by about 0.8–1.6 % per year in the United States under a moderate carbon dioxide emission scenario by regressing hydropower generation on streamflow. Bartos and Chester (2015) used similar regression analysis methods and found only small changes in hydropower generation capacity during the 2020– 2060 period in 14 states in western United States; however, they assumed potential adaptation of reservoir operations to future climate change conditions to keep constant head for hydropower generation. This indicates that, to some extent,
the impact of climate change on hydropower may be miti-gated by changing the operational schemes of reservoirs (see also van Vliet et al., 2016). GHP addressed in those large-scale studies differs from DHP, because DHP looks at the expansion of the current hydropower fleet and how the hy-dropower potential could change. GHP affects the adaptation and mitigation planning for climate change. At large scales, changes in GHP were also paid great attention (Zhou et al., 2015; Pokhrel et al., 2008; Lehner et al., 2005). For exam-ple, Lehner et al. (2005) showed that GHP would decline by 6 % in Europe as a whole in the 2070s because of climate change. Zhou et al. (2015) estimated the global GHP by us-ing runoff data derived from a global integrated assessment model (GCAM), and suggested that the total global GHP is approximately 128 PW (1015W) per year. Even though they did not estimate the changes under climate change, they con-cluded that current potential estimates of hydropower pro-duction are sensitive to regional variabilities such as climate, population centers, i.e., future migration and the economy, including the price of other electricity generation technolo-gies. This finding highlights another source of uncertainty for planning and mitigation for hydropower under climate change conditions.
Runoff has experienced a significant decrease in the past decades and is likely to decrease more for many areas in China in the future (Ma et al., 2010; Tang et al., 2013; Han et al., 2014; Sun et al., 2014; Schewe et al., 2014; Leng et al., 2015), which may significantly affect the water availabil-ity and the hydropower potential of rivers and at the current hydropower facilities. So far, most related studies have fo-cused on the environmental and ecological impacts of the dams in China (Fan et al., 2015) or hydropower (potential) variations at country continental level (Zhou et al., 2015; van Vliet et al., 2016), but the impacts of climate change on the hydropower of China are seldom reported as part of re-gional studies, i.e., including higher-quality data than what are available for global applications. It was partly due to the lack of continental hydrological simulations and necessary reservoir information at a large scale. The Inter-Sectoral Im-pact Model Intercomparison Project (ISI-MIP) (Warszawski et al., 2014) provided multimodel hydrological projections over the world, making it possible to investigate the impli-cations of continental water resource changes under climate change. Therefore, it is of great interest to determine the impacts of future climate change on hydropower potential with respect to the underlying prosperous development of hy-dropower in China.
on existing hydroelectric facilities through a hydropower scheme, which includes a reservoir operation module to regu-late the simuregu-lated flow, similar to van Vliet et al. (2016). The study focuses on the hydropower potential but the changes in reservoir hydropower capacity caused by the development of hydroelectric facilities are not considered because changes in reservoir operations are to be optimized across multiple objectives – water supply and flood control in particular – and are prone to coordination between agencies and types of reservoir management (Tang et al., 2015). Nevertheless, this model-based analysis is expected to provide insight into fu-ture changes in current and additional potential hydropower generation of China, and to complement previous research studies at global scale (e.g., van Vliet et al., 2016). This study (1) assesses both gross and installed hydropower po-tential of China, and (2) provides an exhaustive uncertainty quantification with multimodel simulations, and thus (3) sup-ports regional development of China by focusing on regional variability. The presented modeling framework is compatible with integrated assessment models (IAMs) which can com-bine socioeconomic analyses to further support the develop-ment of hydropower assets. This paper is organized as fol-lows: Sect. 2 describes the method and data, Sect. 3 presents the results, Sect. 4 presents a discussion of the uncertainty associated with this study as well as the integration with so-cioeconomic analyses, and the last section presents the main conclusions.
2 Method and data 2.1 Runoff and discharge
Multimodel data are used to estimate GHP and DHP, and to address the uncertainty in the simulations. Daily runoff and monthly discharge in China are derived from eight GHMs: DBH (Tang et al., 2006, 2007b), H08 (Hanasaki et al., 2008), Mac-PDM.09 (Gosling and Arnell, 2011), MATSIRO (Takata et al., 2003), MPI-HM (Hagemann and Gates, 2003), PCR-GLOBWB (van Beek et al., 2011), VIC (Liang et al., 1994), and WBMplus (Wisser et al., 2010) provided by the ISI-MIP project (Warszawski et al., 2014). The model simu-lations are driven by the same forcing data downscaled from CMIP5 climate projections of the following GCMs: GFDL-ESM2M, HadGEM2-ES, IPSL-CM5A-LR, MIROC-ESM-CHEM, and NorESM1-M (Hempel et al., 2013). Hydrologi-cal simulations were all performed at a daily time step with a 0.5◦ latitude–longitude spatial resolution (∼50 km at the
Equator) over the 1971–2099 period. General descriptions of these GHMs and GCMs are listed in Tables S1 and S2 in the Supplement. The use of different GHMs and GCMs allows for the evaluation of the uncertainties arising from the hydro-logic and climate model structures in our estimates of GHP and DHP. Two RCPs, a low mitigation scenario (RCP2.6) and a very high baseline emission scenario (RCP8.5), are consid-ered for representing the future climate and bounding the
un-certainties in projections due to different RCPs. The model data have been used for assessment of the impact of climate change across several sectors (Davie et al., 2013; Elliott et al., 2014, Piontek et al., 2014, Schewe et al., 2014, Frieler et al., 2015). The overall GCM-GHMs framework are not vali-dated in this study; the evaluations of the models are referred to the references listed in Tables S1 and S2.
2.2 Gross hydropower potential
GHP is defined as the total energy of natural runoff falling to the lowest level (e.g., sea level) of a specific region. GHP is estimated from discharge at each model grid cell: GHP=
Q×h×g, where Qis discharge estimated by the GHMs (m3s−1);his the hydraulic head (m), i.e., elevation gradient in this case; andg is gravitational acceleration (m s−2). A flow-routing scheme, following the river transport model in the Community Land Model (Oleson et al., 2010), is used to process the modeled runoff into channel flow (runs in river) and cell-internal flow (runoff generated in the cell). For the discharge estimation in the GHP computation, flows are con-sidered from both (1) cell-internal runoff that falls from the mean to the minimum elevation of the considered cell and (2) inflow that falls from the minimum elevation of the up-stream cell to the minimum elevation of the considered cell. The separation of these two flows was proven to be more ac-curate for GHP estimation (Lehner et al., 2005).
2.3 Developed hydropower potential
with limited regulation data and site-specific hydrological parameters.
In this study, socioeconomic factors (e.g., irrigation, en-ergy price, and demands) are generally not considered, al-though other human water use is extensive in China (Tang et al., 2007a, 2008). The evaporation from water surface of reservoirs is neglected for this analysis because it represents a small fraction of the managed flow (Fekete et al., 2010; Liu et al., 2015). We use the generic reservoir regulation rules from Hanasaki et al. (2006) to derive the regulated flow at hydropower reservoirs. The reservoir operations scheme has been extensively used under different development ef-forts in large-scale studies (Biemans et al., 2011; Pokhrel et al., 2015; Döll et al., 2009) and at a more regional scale (Voisin et al., 2013; Hejazi et al., 2015). Regulation is set for flood control and then hydropower generation by targeting monthly releases for the wet and dry seasons in a year. That is, monthly release in a dry season is generally larger than monthly inflow of reservoirs; it thus gradually reduces reser-voir storage for flood control in the coming wet season and provides more water for hydropower generation. Monthly re-lease (Rm)is calculated as the case of no irrigation demands in Hanasaki et al. (2006):
Rm=
c
Kc β
kyia+
" 1−
c
Kc β#
im,0< c < Kc
kyia c≥Kc,
(1)
whereKcis the criterion ofc,imis monthly inflow (m3s−1), ia is mean annual inflow (m3s−1),ky=Sbeg/αC, andc=
C/Ia.Sbegis the reservoir storage at the beginning of a year (m3),C is the maximum storage capacity of reservoir (m3), Iais the mean total annual inflow (m3yr−1), andαis an em-pirical coefficient (0.85 in this study), which influences in-terannual variation in releases. The criterion ofc(Kc)is set as 0.5 and the exponent of (c/Kc),β, is set as 2 empirically, following Hanasaki et al. (2006). When the reservoir stor-age capacity is large compared to annual inflow (c≥Kc), the monthly release is independent of monthly inflow and will be constant in a year if water is available. The reservoir is not allowed to release water when water storage is below 10 % of the storage capacity, and the monthly release would be no less than 10 % of mean monthly inflow for environmen-tal flow. If water storage exceeds the storage capacity, excess water will be released.
The DHP of a reservoir is then estimated based on the monthly release (including spilling water): DHP=min(Rm×
[image:4.612.311.546.67.218.2]h×g, IHC). Hydraulic head (h)is estimated by assuming it is linearly related to the reservoir storage,h=S/A, whereS is the mean reservoir storage at the beginning and the end of a calculation time step, andAis the reservoir area.Ais set as constant in this study,A=C/H, whereHis the dam height, which is also the maximum ofh. The headhis determined after the Rm calculation. For the purpose of conservatively estimating the impact of climate change and representing a
Figure 1.Reservoir storage capacity and IHC at the provincial level in mainland China.
consistent estimate over multiple terrains, we use a cylin-der shape for the reservoir to computehas a function of the storage. It differs from the tetrahedron shape used in Fekete et al. (2010) which represents reservoirs in complex terrain and will decrease the elasticity of the head with respect to changes in inflow.
2.4 Experimental approach
GHP is determined from all GHM and GCM combinations over the historical period (1971–2000), and the ensemble me-dian of gridded and regional annual mean GHPs are plotted in Fig. 2. GHP distribution is dominated by the terrain and water availability showing high values in southwest China and most south China, which is generally similar to previous studies at the global scale (Pokhrel et al., 2008; Zhou et al., 2015).
The analysis of GHP and DHP consists of two parts. In the first step, median estimates of the GHP and DHP over all GCM-GHM combinations are evaluated spatially and region-ally over three periods: historical (1971–2000), near future (averages over the 2020–2050 period, referred to as 2035), and the end of the century (average of the 2070–2099 pe-riod and referred to as 2085, hereafter). A regional analy-sis is performed by evaluating changes between the two fu-ture periods and the benchmark historical period for the two RCPs. Emphasis is on regional change differences and un-certainties related to the two RCPs. The regions analyzed are north China (NC), northwest China (NWC), southeast China (SEC), southwest China (SWC), SCC, and EC, as shown in Fig. 2. The interquartile range (IQR, the difference between the 75th and 25th percentiles of the multimodel ensembles is calculated to address the uncertainty of hydropower esti-mation between GCM-GHM combinations, and is shown in parenthesis following the median estimates.
A second analysis consists of looking at the temporal changes in the DHP and GHP over all of China and evaluat-ing the overall trends in changes with respect to uncertainties related to interannual variability, and uncertainties related to individual GCM and GHM model structures. This analysis evaluates the changes in the DHP and GHP as time series. Estimates are computed as a 31-year moving average from 1971 to 2099 and labeled with the center year. The labeled period is accordingly reduced to 1986–2084, and the labeled period of 2010–2084 is shown for a clear view.
[image:5.612.321.531.94.341.2]To further support planning and mitigation for China hy-dropower, we define hydropower hotspots as regions with large hydropower potential or currently high IHCs. Two hotspot regions are isolated to illustrate the projected im-pacts of climate change on currently developed hydropower and hydropower that is in planning phases or under construc-tion. One hotspot (HS1; see Fig. 2) covers the areas with significant untapped hydropower potential in SWC, includ-ing most of the Jinsha River, Yalong River, Nu River, and Lancang River; many hydropower plants in this area are in the planning phases or under construction. The other hotspot region encompasses the Sichuan (including Chongqing) and Hubei provinces (HS2), and accounts for about 50 % of total adjusted IHC in China in this study. We perform an addi-tional analysis of expected changes over those two regions, which overlay parts and combinations of the main regions addressed in the first part of this paper.
Table 1.Estimates of annual and seasonal GHP (GW) for regions and China over 1971–2000.
Percentile 50th 25th 75th IQR GHM
GFDL-ESM2M 720 510 743 234 HadGEM2-ES 676 482 710 228 IPSL-CM5A-LR 662 490 690 200 MIROC-ESM-CHEM 715 506 734 228 NorESM1-M 704 487 755 268 Region
NC 25 11 32 21
NEC 11 9 14 5
EC 29 26 31 5
SCC 91 79 100 21
SWC 440 356 488 132
NWC 62 40 74 34
Season
MAM 314 280 385 105 JJA 1116 941 1218 278 SON 852 662 914 252 DJF 189 125 270 146
3 Results
3.1 Gross hydropower potential 3.1.1 Validation
Figure 2.Medians of the GHPs of China across the ensemble of all GCM-GHM combinations over the historical period (1971–2000). The red rectangular denotes a hotspot region (HS1). NC: north China, NEC: northeast China, EC: east China, SCC: south central China, NWC: northwest China, SWC: southwest China. Inner plot(a)shows the boxplot of GHP of China across GHMs for each GCM, where the red line is the reported GHP, i.e., 694 GW, and G, H, I, M, and N denote GFDL-ESM2M, HadGEM2-ES, IPSL-CM5A-LR, MIROC-ESM-CHEM, and NorESM1-M, respectively. The inner plot(b)shows the boxplot of regional GHPs across all GCM-GHM combinations on a log scale, where red dots denote reported GHPs (Li and Shi, 2006).
Figure 3.Medians of relative changes in the GHP of China over the 2010–2084 period under RCP2.6(a)and RCP8.5(b). Solid lines show the ensemble medians of GHP; grey areas denote the IQRs of annual GHP. MAM: March, April, May; JJA: June, July, Au-gust; SON: September, October, November; DJF: December, Jan-uary, February. All the annual and seasonal time series of GHP are estimated at a 31-year moving average over 1971–2099 and labeled with the center year.
3.1.2 Expected timeline of changes
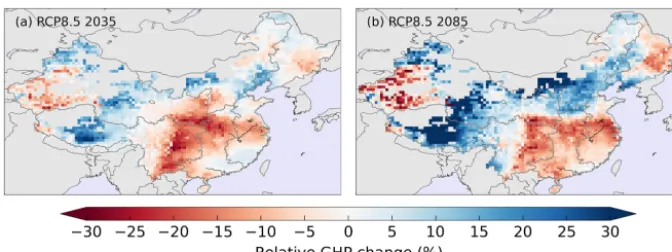
Figure 4.Medians of relative changes in the annual mean GHPs for 2020–2050(a)and 2070–2099(b)compared to the historical period (1971–2000) across the ensemble of GCM-GHM combinations under RCP8.5.
3.1.3 Expected regional changes
Figure 4 shows the future relative annual GHP changes un-der RCP8.5. The total GHP of China is projected to decrease by 1.7 % (IQR: 5.8 %) in 2035 and increase by 6.3 % (IQR: 13 %) in 2085. The annual GHP shows smaller changes for both periods under RCP2.6: GHP is projected to increase by 2 % (IQR: 5.7 %) and 3 % (IQR: 7.2 %) in 2035 and 2085, respectively (see Fig. S1, Tables S4, and S5 in the Supple-ment). Estimations under RCP2.6 generally show spatial pat-terns similar to those under RCP8.5 but different magnitudes. For simplicity, we prefer to show RCP2.6 results in the Sup-plement, because the interregional analysis patterns are sim-ilar to RCP8.5.
Under RCP8.5, annual GHP is projected to decrease by more than 10 % in eastern SWC and NWC, and northern SCC, while in the Tibet region and most of NC, it is projected to increase by more than 5 % in the near term (2035). The in-crease in annual GHP will dominate the relative changes in 2085, which shows a smaller decrease with respect to the his-torical period in SWC, SCC, and NWC, and larger increases in NC and western SWC. GHP changes might have signifi-cant implications in SWC, where more than half of China’s hydropower structures are located and most hydropower sta-tions are in planning phases or under construction (Wang et al., 2013). The projected annual GHP changes generally agree with the spatial patterns of discharge changes in China, i.e., they decrease in a large part of southern China and in-crease in most of NC (see Fig. S2). In addition to annual changes in GHP, seasonal changes are computed in both 2035 and 2085 (see Fig. S3 and Table S6). In the spring, the GHP will decrease on the southern edge of China, which is op-posite to the trend of annual GHP at this location. Summer GHP changes resemble the annual ones, and relative changes in the autumn and winter GHPs seem to be larger than annual changes.
Figure 5.Medians of relative changes in the DHPs of present reser-voirs in China over the 2010–2084 period under RCP2.6(a)and RCP8.5(b). Solid lines show the ensemble medians of DHP; grey areas denote the IQRs of the annual DHPs. All of the annual and seasonal time series of the DHPs are estimated at a 31-year moving average over 1971–2099 and are labeled with the center year.
3.2 Developed hydropower potential 3.2.1 Projected timeline of changes
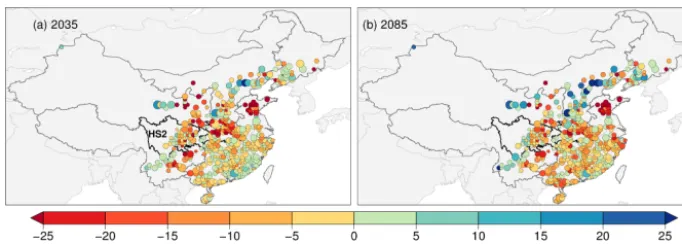
Figure 6.Medians of relative DHP changes for present reservoirs in China across the ensemble of GCM-GHM combinations for 2020– 2050(a)and for 2070–2099(b)under RCP8.5. Black lines depict the hotspot region HS2; i.e., Sichuan (including Chongqing) and Hubei provinces. Circle size is determined according to the logarithm of reservoir storage capacity.
Figure 7.Relative monthly DHP changes in regions in China for 2020–2050(a)and 2070–2099(b)under RCP8.5. Lines show the ensemble medians across all GCM-GHM combinations; grey areas show the IQR of relative DHP changes in China; the inner plots show annual DHP changes in regions in terms of the percentage of IHC.
a relatively smaller decrease and winter shows a larger de-crease. However, the winter DHP is relatively small in a year. Therefore, the larger decrease in winter contributes little to annual DHP changes. Projected changes in the annual DHP also show large spreads across the GHMs and GCMs; e.g., IQRs/medians are greater than 2 for most years, especially for RCP2.6 (see Tables S7 and S8).
Note that the GHP would increase after 2040 for both RCPs, while the DHP would decrease more or less. This is mainly due to the fact that GHP mostly increases in NC and west China, where a small number of installed capacity plants are located, while GHP significantly decreases in SC and central China, where a large number of installed capac-ity plants (expected large DHP) currently are located in this study (see Figs. 1, 4, and S1).
3.2.2 Expected regional changes
Figure 6 shows the relative DHP changes of each reservoir in 2035 and 2085 under RCP8.5. More than 60 % of the reser-voirs show an expected decrease in DHP in 2035 (Fig. 6a). Most DHP increases are less than 5 % in China, and only several reservoirs show more than a 10 % increase in NC. Most reservoirs in the southern EC and SCC show small change (less than 5 %) in DHP, while important reservoirs that decrease by more than 10 % are found in northern SCC
and eastern SWC. Large decreases (more than 20 %) in DHP mainly occur in northern SCC and EC, as well as in some reservoirs in SWC and NWC. The relative DHP changes in 2085 (Fig. 6b) show a pattern similar to that in 2035, except that fewer reservoirs show large decreases in NWC and northern SCC, but more decreases are expected in the southern EC and SCC. Under RCP2.6, relative DHP changes generally resemble RCP8.5 patterns with larger increases in DHP in southern China and smaller decreases in DHP overall (see Fig. S5). It seems that hydropower is more sensitive to discharge reduction for large reservoirs; e.g., DHP shows a relatively large decrease at most reservoirs with large storage capacities, but only small changes at many small reservoirs in SCC and SWC (Fig. 6).
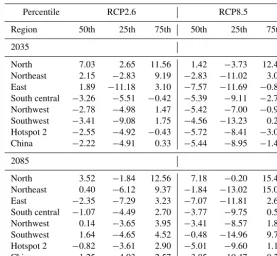
Table 2.Percentiles of annual DHP changes (%) for regions in China over 2020–2050 (2035) and 2070–2099 (2085) across the ensemble of GCM-GHM combinations.
Percentile RCP2.6 RCP8.5
Region 50th 25th 75th 50th 25th 75th 2035
North 7.03 2.65 11.56 1.42 −3.73 12.48 Northeast 2.15 −2.83 9.19 −2.83 −11.02 3.08 East 1.89 −11.18 3.10 −7.57 −11.69 −0.83 South central −3.26 −5.51 −0.42 −5.39 −9.11 −2.78 Northwest −2.78 −4.98 1.47 −5.42 −7.00 −0.92 Southwest −3.41 −9.08 1.75 −4.56 −13.23 0.25 Hotspot 2 −2.55 −4.92 −0.43 −5.72 −8.41 −3.03 China −2.22 −4.91 0.33 −5.44 −8.95 −1.46 2085
North 3.52 −1.84 12.56 7.18 −0.20 15.44 Northeast 0.40 −6.12 9.37 −1.84 −13.02 15.03 East −2.35 −7.29 3.23 −7.07 −11.81 2.60 South central −1.07 −4.49 2.70 −3.77 −9.75 0.59 Northwest 0.14 −3.65 3.95 −3.41 −8.57 1.86 Southwest 1.64 −4.65 4.52 −0.48 −14.96 9.77 Hotspot 2 −0.82 −3.61 2.90 −5.01 −9.60 1.13 China −1.25 −4.93 2.57 −3.85 −10.47 0.24
monthly DHP in both NWC and SWC will largely decrease during summer and winter, by up to 10 and 8 %, respectively, but show small changes in other months. The monthly DHP of China will decrease more than 4.6 % in all the months ex-cept May and June, which is similar to the DHP in SCC, and the annual DHP will decrease by about 5.4 % (IQR: 7.4 %), accounting for 1.7 % of total IHC. The annual DHP shows small changes in NEC (−2.8 %) and NC (1.4 %), and shows the largest decrease in EC (−7.6 %), followed by SCC (−5.4 %) and NWC (−5.4 %). As shown in the inner plot in Fig. 7a, however, DHP changes in SCC (−1.1 % of total IHC) contribute most to the changes in China, followed by EC (−0.4 % of total IHC).
In 2085 (Fig. 7b), the changes in monthly DHP are gener-ally similar to those in 2035, except for a larger increase (4.8 to 10 %) in NC, larger decreases in May (−6 %) and June (−5.5 %), and a small increase in other months (less than 3 %) in NEC. The monthly DHP in EC will largely decrease (greater than 10 %) in winter months, but there are fewer changes from May to July. The monthly DHP in SCC will slightly increase in June and decrease by 0.3 to 7.8 % in other months. Both NWC and SWC show relatively small changes in spring and summer but large decreases in autumn and wter, except for May and June in NWC, which show a large in-crease. Changes in the monthly DHP of China are very close to those in SCC; i.e., small changes in late spring and early summer and relatively large decreases (mostly greater than 5 %) in other months. The annual DHP in China is expected to decrease by about 4 % (IQR: 10.2 %), accounting for about
−1.3 % of total IHC, which is also mostly contributed by DHP changes in SCC (−0.7 % IHC) and EC (−0.4 % IHC).
The monthly DHP changes in 2035 and 2085 under RCP2.6 (see Fig. S6 and Table 2) are smaller than those un-der RCP8.5. Monthly DHP changes are mostly less than 5 % and show more increases in NC, NEC, NWC, and SWC, es-pecially in 2085; the annual DHP will decrease by 2.2 and 1.3 %, accounting for 0.7 and 0.4 % of total IHC, in 2035 and 2085, respectively.
3.3 Impact on hotspot hydropower regions
We now analyze the temporal trends over the two identified hydropower hotspots (HS1 and HS2) as defined in the exper-imental approach.
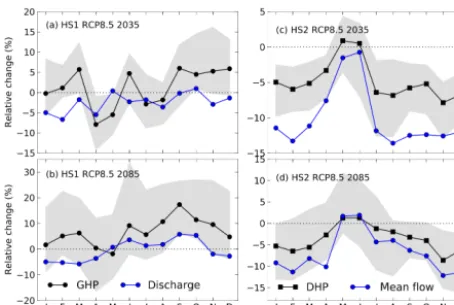
Figure 8.Relative changes in the monthly GHPs (DHPs) and dis-charges (reservoir inflow) in the hotspot regions for 2020–2050 (2035) and 2070–2099 (2085) under RCP8.5. HS1: the hotspot re-gion in southwest China (see Fig. 2); HS2: Sichuan and Hubei provinces (see Fig. 6). Grey areas denote the IQRs across the en-semble of GCM-GHM combinations.
not match the GHP changes exactly; e.g., the mean flow in-creases (13 % to 23 %) more than the GHP from May to August. GHP estimates in HS1 seem to have larger uncer-tainty in 2085 than in 2035. For RCP2.6 (see Fig. S7a, b), the monthly GHP in HS1 will increase by 0.5 to 8 % in 2035 and by 0.5 to 13 % for most months in 2085. The annual GHP in HS1 will increase by about 6 % (IQR: 8.9 %) and 4.4 % (IQR: 6.6 %) in 2035 and 2085, respectively.
For HS2, the monthly DHP will significantly decrease by 3.3 % (April) to 7.8 % (August) for most months, but increase slightly in May (0.9 %) and June (0.5 %) in 2035 (Fig. 8c). The monthly DHP in May and June will also increase by about 1 % in 2085 (Fig. 8d) and decrease by 1.2 % (July) to 8.6 % (November) in other months. The annual DHP will de-crease by about 5.7 % (IQR: 5.4 %) and 5 % (IQR: 10.7 %), accounting for 1 and 0.9 % of total IHC, in 2035 and 2085, respectively. Changes in the monthly mean inflow are smaller than or relatively close to those for DHP in 2085. This in-dicates that reservoir regulation may offset the impact of discharge changes on hydropower to some degree. Under RCP2.6, the DHP in HS2 shows similar but smaller changes than those under RCP8.5 (see Fig. S7c, d). The monthly DHP will decrease by 0.5 to 5 % in 2035 and by less than 2 % for most months in 2085. The annual DHP will decrease by about 2.6 and 0.8 %, accounting for 0.46 and 0.13 % of total IHC, for 2035 and 2085, respectively.
For both hotspot regions, the uncertainties related to dif-ferent GCM-GHM combinations are as large as the expected changes, but they are consistent in their monthly patterns and the direction of the annual changes for HS1 by the end of the century and HS2 for both the near term and the end of cen-tury.
4 Discussion
A selection of hydropower potentials (GHP, DHP) in this study was estimated using multimodel simulations of runoff and discharge under different climate change scenarios. An ensemble of hydropower potential is generated that repre-sents uncertainties due to model structure (multimodel) and emissions (RCPs). The combination of multiple potential estimates and the understanding of their regional diversity and associated uncertainties should provide support for inte-grated analysis from the generation perspective. A socioeco-nomic analysis, discussed hereafter, would complement the decision support analysis from the water and energy demand perspective. In this section, we further discuss the uncertain-ties, how the results relate to the modeling framework and the socioeconomic perspective.
Though the ensemble mean of projected GHP of China for the historical period is relatively close to the reported data, there is large discrepancy among GHMs. During the his-torical period, discrepancy in hydropower potential is much smaller among GCMs, because the GCM climate data are bias corrected to a historical reference. It implies that vali-dation or bias correction may be helpful to reduce the uncer-tainty in the projections of GHMs. However, currently most GHMs, except for a few such as WaterGAP, are not calibrated against historical observations, and thus often show a large uncertainty in streamflow projections (Schewe et al., 2014). For annual estimates, it should be more effective and impor-tant to enhance the middle- and long-term hydrological pre-diction in order to fine tune the estimates of DHP and GHP. Therefore, validation and calibration of GHMs with hydro-logical observations (as with the WaterGAP model) are nec-essary in future studies which are effective in narrowing the differences among GHMs (Müller Schmied et al., 2014; Döll et al., 2016).
As stated, the uncertainty in the streamflow projections certainly propagates to the estimation of DHP. Though a universal reservoir regulation is applied to all modeled dis-charge, there is still a large spread across GCM-GHM com-binations. The large uncertainty in DHP should be mainly due to the large discrepancy of GCM climate data since the reservoirs used in this study are mostly located in areas with low model agreements in future discharge projections (see Fig. 1 in Schewe et al., 2014). This also partly explains why the total DHP (Fig. 5) shows somewhat larger spread than the total GHP (Fig. 3) of China.
reg-ulation rules, and other sources like lack of consideration of socioeconomic factors in the hydropower estimation.
4.1 Uncertainties from models and climate forcings
The GHP estimates are representative of the effect of climate change on hydropower if all of the natural runoff could be captured. The effect of climate change on DHP is an interme-diate estimate that takes into consideration the regulation of reservoirs as if they were operated for hydropower only. The combined direct and indirect impacts of climate change on hydropower can be very complicated, e.g., the more frequent extreme heat and drought may reduce power generation ca-pacity in the future (Bartos and Chester, 2015) which may affect the electricity supply from the state grid and therefore change the demand of hydropower generation. Nevertheless, the strong linkage between climate–streamflow–hydropower potential is one of the main ways that climate change af-fects hydropower. Climate change can directly modulate re-gional water availability, such as the increased temperature and depressed precipitation may give rise to drought events (Dai et al., 2004), while more intensive and spatially concen-trated rainfall may result in more floods (Wasko et al., 2016). The consequent streamflow variations will then directly af-fect GHP and the reservoir storage which is associated with DHP. Besides the temperature and precipitation, several cli-mate variables can alter river streamflow (e.g., Tang et al., 2013; Liu et al., 2014) and then affect hydropower poten-tial. In this study, streamflow changes under changing cli-mate conditions are projected by GHMs, and most of them include several climate variables, but two models use only temperature and precipitation as input (see Table S1). There-fore, this study presents the compound effects of the changes of multiple climate variables on hydropower potential. It is beyond the scope of this analysis to identify the contributions of all climate variables to the changes of hydropower poten-tial. We limit the current analysis of meteorological forcing to a discussion on changes in temperature and precipitation, which are main drivers for streamflow projections.
As an example, the relative annual temperature and precip-itation changes in 2035 and 2085 compared to the historical period are presented in Figs. S8 and S9, respectively. Tem-perature is projected to increase by more than 1.5◦C in most areas of China in the future under RCP2.6; it will increase by more than 1.5◦C (2◦C) in southern (northern) China in 2035, and by more than 5◦C in almost the whole of China
in 2085 under RCP8.5. Annual temperature and precipita-tion increase a bit more in 2035 than in 2085 under RCP2.6, while temperature will largely increase in 2085 and precip-itation will increase in most areas of China under RCP8.5. To a large extent, the spatial patterns of annual precipitation changes are in line with those of discharge changes in 2035, but they differ from the discharge changes in southern China in 2085, possibly due to significant warming.
The estimation of GHP is subject to large spread across the GCM-GHM ensemble, and most regions show poor agree-ment between models in the signs of the GHP changes (see Fig. S4). The large uncertainty in climate projections (Knutti and Sedlacek, 2013) certainly will propagate to the hydropower estimates as GHMs are sensitive to climate forc-ing (Müller Schmied et al., 2014). The GCM uncertainty pre-dominates in GHP estimates in this study. For both future pe-riods, the spread owing to differences between GCMs dom-inates the total ensemble spread in most of southern China for RCP8.5 and RCP2.6 and in some of NEC for RCP2.6 (Fig. S10). The ranges of GHP and DHP estimates across GHMs and GCMs are further summarized in Tables S4–S8, in terms of the 25th, 50th, and 75th percentiles of the ensem-ble of GCMs and GHMs, respectively.
The uncertainties in the DHP estimates, partially due to reservoir operations, are evaluated by looking at empirical parameters (α, β, Kc) in Eq. (1) through several sensitiv-ity tests (Table S3). The different values of these parame-ters represent different regulation efficiencies of reservoirs, and the experiments in Table S3 show the sensitivity of the DHP estimates to the regulation coefficients. Experiments withα=0.65, 0.75, 0.85 (used in this study), 0.95,β=1, 2 (used in this study), 3, andKc=0.4, 0.5 (used in this study), 0.6, are carried out, and one parameter value is changed for each experiment. These sensitivity tests show that es-timates of DHP are considerably sensitive to the parame-ter β (Fig. S12), which could adjust the monthly release via the weights between annual inflow and monthly inflow. Whenβ=3, the relative DHP changes would be smaller, and would have differences of about 2 % fromβ=2. To some extent, this indicates that adjusting regulation rules may mit-igate the impact of climate change on hydropower genera-tion in the future. The DHP is also sensitive to the parameter α(Fig. S11), which may affect the release coefficient (Ky); but it shows little sensitivity to the parameterKc(Fig. S13). We also attempt to demonstrate the uncertainty in DHP esti-mates arising from the assignment of reservoir IHCs. Two experiments with IHC decreased (0.9*IHC) and increased (1.1*IHC) by 10 % are further carried out (see Fig. S14), and they show very little differences from the estimates of DHP using the present IHC. Nevertheless, more accurate IHC data are urgently needed for the future investigation of regional water resources–energy management under climate change.
geomogra-phy (Fekete et al., 2010) and then produce different DHP es-timates. We further address here two main assumptions for estimating DHP: the effect of simple reservoir regulations and the lack of water withdrawals in the system for socioe-conomic water demand.
4.2 Uncertainties associated with reservoir operations Hydropower operations differ based on the reservoir storage and inflow characteristics, and if the plant is operated for gen-eral generation (daily load) or for capacity of generation dur-ing peak hour load. Furthermore, most reservoirs operated have multiple objectives to be combined with hydropower, implying even more complexities in hydropower operations. Large-scale water resources management modules have been efficient at evaluating the state of managed water resources over continents (Biemans et al., 2011). Although not oper-ational models, the research models mimic reasonably well the impact of impoundment (regulation and withdrawals) on flow over large areas. Usually, two types of release rules are used. (1) The flood control/hydropower rule mostly re-leases water uniformly over the year with interannual vari-ability in the release and minimizes spilling. With a quasi-constant release target over one whole operational year, the storage buffers the seasonality in flow (for larger reservoirs), which affects DHP estimates. (2) An irrigation rule tops off the reservoir storage as much as possible before the start of the irrigation season, and then releases water with a monthly pattern following the monthly demand anomalies. In our reg-ulation scheme, we only used the flood control/hydropower rule with no water or energy demand information. The es-timates of DHPs in this paper are therefore an upper bound of hydropower generation and consistent with the concept of potential with respect to an operational context with more complex water management for competitive water uses and uncertainties in water demand.
Adaptation of reservoir operations to the impact of cli-mate change can be complex as they will need to be adjusted for both changes in water resources and increased competi-tion between water uses (Vicuna et al., 2008, Vicuña et al., 2011; Finger et al., 2012; Jamali et al., 2013), and potentially to changes in energy demand and energy infrastructure as well. In our analysis where the reservoir operations depend on the historical long-term mean annual inflow, an increase (decrease) in mean annual inflow into reservoirs as well as the change in seasonality affect the estimation of DHPs. As release targets are maintained, the change in storage head for large reservoir storage and reservoir spilling/drying are driv-ing the estimates of DHP changes. No adaptation measure was applied to our reservoir operations, as it would add an-other level of uncertainty to be further quantified and evalu-ated with respect to the competing water uses as addressed next.
4.3 Other sources of uncertainties
The projected changes in hydropower potential indicate the impacts of climate change, but they do not represent future prospects because socioeconomic and technical evolutions are not considered. Therefore, more uncertainty may arise:
1. Anthropogenic water use is expected to increase along with the increase in temperature and population (Kendy et al., 2007; Elliott et al., 2014; Leng and Tang, 2014); however, it is not considered. Socioeconomic water de-mand has been the focus of recent research in global integrated assessment and is taken into consideration in association with the changes in population, indus-trial development, policy choices with respect to carbon emissions, economy between countries, and energy de-mands (Hejazi et al., 2014).
2. Changes in infrastructure should also be taken into consideration when estimating DHP. The South–North Water Diversion project, which was designed to di-vert about 44.8 billion m3water annually, would influ-ence the hydropower generation potential in the Yangtze River (Zhang, 2009).
3. Hydropower generation is affected by its potential gen-eration and by its integration into the electrical grid. The use of pumped-storage hydroelectricity (Huang and Yan, 2009), potential changes in seasonal energy de-mand, and the electricity price of the power grid may affect the actual hydropower generation of a region or a reservoir.
4. Variation in climate change-induced energy demand may also affect actual hydropower generation; e.g., in-creasing temperature may lead to more energy demand in summer and less in winter (Pereira-Cardenal et al., 2014). These cumulative effects on hydropower merit further study and associated uncertainty quantification. 4.4 Socioeconomic implications from hydropower
potential changes
would most likely need to be balanced by energy produc-tion from other sources, likely from costlier technologies, implying regional economic impact, which would need to be taken into consideration in the socioeconomic analyses. The socioeconomic analysis is beyond the scope of this paper. However, the regional assessment performed in this study provides the necessary information for integration into the regional version of IAMs for national sustainable mitigation and adaptation policy making. It also provides a first assess-ment for regional developers to create case studies in specific sites to determine the feasibility from a natural resource and economical perspective.
5 Conclusions
An overview of projected future changes in the GHP and DHP of China was presented using hydrological simulations derived from multiple GHMs and GCMs. A reservoir regu-lation scheme was incorporated to estimate the DHP using current infrastructure. Historical GHP simulation was evalu-ated at the regional scale (overall bias−7.2 %) and was gen-erally close to the latest surveyed GHP in China. Most GHP is located in SWC, SCC, and NWC, where there are both rich water resources and large topography gradients. Projections of future changes in hydropower potential of China are gen-erally consistent with previous studies (e.g., van Vliet et al., 2016). Two time slices, from 2020 to 2050 and from 2070 to 2099, were selected to further analyze the regional changes in China’s GHP and DHP.
The GHP of China is projected to change by−1.7 to+2 % in the near future (2020–2050), and increase by 3 to 6 % by the late 21st century (2070–2099). Large regional variations emerge: a relatively large decrease will occur in SWC and SCC, especially in summer, and some increase will occur in most areas of NC.
The annual DHP in China will decrease by about 2.2 to 5.4 % (0.7–1.7 % of total IHC) and 1.3 % to 4 % (0.4–1.3 % of total IHC) from 2020 to 2050 and from 2070 to 2099, respectively. These changes are mostly contributed by the large decrease in SCC and EC, where most reservoirs and large IHCs are located currently. The DHP will decrease with some regional disparities as well. It will mainly decrease in southern China (e.g., EC, SCC, and part of SWC), and will increase considerably in NC and the region of Tibet. China’s DHP also shows a small decrease in late spring and early summer and a relatively large decrease in other months.
The impact of climate change on hydropower is particu-larly of concern in two identified hotspot regions that have rich hydropower potential. One hotspot located in SWC shows increases of nearly 2 to 6 % and 4 to 11 % in the an-nual GHP from 2020 to 2050 and from 2070 to 2099, re-spectively. This region has the most hydropower plants cur-rently in planning phases or under construction, and will be the most important region for targeting hydropower develop-ment in China in the near future (GOSC, 2014). The result
herein suggests the necessity of considering climate change for future hydropower development. In another hotspot re-gion – the Sichuan and Hubei provinces – which holds nearly half of China’s total IHC and is closer to urban centers, the DHP will decrease by 2.6 to 5.7 % (0.46–0.97 % of total IHC) and 0.8 to 5 % (0.13–0.91 % of total IHC) from 2020 to 2050 and 2070 to 2099, respectively. Though the DHP seasonal-ity would be optimized (e.g., retain a high water level or in-crease release) to reduce the effects of monthly inflow de-crease for certain years, it is mostly subject to the streamflow seasonality during a long-term period according to the pa-rameterization of reservoir regulation. In this hotspot region, relatively small changes of monthly DHP will occur in late spring and early summer, while large decreases will occur in other months. If actual hydropower changes proportion-ally to the DHP under climate change, the reservoirs in this region might be unable to provide as much hydropower gen-eration as in the present day. The significant DHP decrease in dry season (e.g., in winter) will further increase challenges to managing the competitive water uses and regulation of reser-voirs.
The projected effects of climate change on GHPs and DHPs of China are related but in the opposite direction of change because most areas with high IHC show decrease in DHP while most areas with high GHP show increase in GHP. Even though GHPs are generally projected to increase by the second half of the 21st century, DHPs given the current infrastructure will not be able to mitigate the hydrological changes and thus will decrease without future update of reg-ulation rules. Those trends tend to be consistent even under the range of uncertainty captured by an ensemble of global climate models, hydrological models, and two bounding cli-mate change scenarios.
6 Data availability
All the discharge and runoff data used to estimate the hy-dropower potential are publicly available from the Inter-Sectoral Impact Model Intercomparison Project (ISI-MIP, https://www.isimip.org).
The Supplement related to this article is available online at doi:10.5194/hess-20-3343-2016-supplement.
Author contributions. Q. Tang and X. Liu designed the research, N. Voisin processed the reservoir data, X. Liu conducted analyses, Q. Tang, X. Liu, N. Voisin, and H. Cui wrote the manuscript.
Acknowledgements. We acknowledge the modeling groups (listed in Table S1 of this paper) and the ISI-MIP coordination team for providing the model data. This research is supported by the National Natural Science Foundation of China (41425002 and 41201201) and the National Youth Top-notch Talent Support Program in China.
Edited by: T. Kjeldsen
Reviewed by: two anonymous referees
References
Bahadori, A., Zahedi, G., and Zendehboudi, S.: An overview of Australia’s hydropower energy: Status and future prospects, Renew. Sust. Energ. Rev., 20, 565—569, doi:10.1016/j.rser.2012.12.026, 2013.
Bartos, M. D. and Chester, M. V.: Impacts of climate change on electric power supply in the Western United States, Nature Clim. Change, 5, 748–752, doi:10.1038/nclimate2648, 2015.
Biemans, H., Haddeland, I., Kabat, P., Ludwig, F., Hutjes, R. W. A., Heinke, J., von Bloh, W., and Gerten, D.: Impact of reservoirs on river discharge and irrigation water supply during the 20th century, Water Resour. Res., 47, W03509, doi:10.1029/2009WR008929, 2011.
Chang, X., Liu, X., and Zhou, W.: Hydropower in China at present and its further development, Energy, 35, 4400–4406, doi:10.1016/j.energy.2009.06.051, 2010.
China National Renewable Energy Centre (CNREC): China Re-newable Energy Outline 2012, available at: http://www.cnrec. org.cn/english/publication/2014-01-20-408.html (last access: 10 January 2016), 2013.
China renewable energy engineering institute (CREEI): Summary on the survey of water resources of China, China Electric Power Press, Beijing, 267, 2004. (in Chinese)
Dai, A., Trenberth, K. E., and Qian, T.: A Global Dataset of Palmer Drought Severity Index for 1870–2002: Relationship with Soil Moisture and Effects of Surface Warming, J. Hydrometeorol., 5, 1117–1130, doi:10.1175/JHM-386.1, 2004.
Davie, J. C. S., Falloon, P. D., Kahana, R., Dankers, R., Betts, R., Portmann, F. T., Wisser, D., Clark, D. B., Ito, A., Masaki, Y., Nishina, K., Fekete, B., Tessler, Z., Wada, Y., Liu, X., Tang, Q., Hagemann, S., Stacke, T., Pavlick, R., Schaphoff, S., Gosling, S. N., Franssen, W., and Arnell, N.: Comparing projections of future changes in runoff from hydrological and biome models in ISI-MIP, Earth Syst. Dynam., 4, 359–374, doi:10.5194/esd-4-359-2013, 2013.
Döll, P., Fiedler, K., and Zhang, J.: Global-scale analysis of river flow alterations due to water withdrawals and reservoirs, Hy-drol. Earth Syst. Sci., 13, 2413–2432, doi:10.5194/hess-13-2413-2009, 2009.
Döll, P., Douville, H., Güntner, A., Müller Schmied, H., and Wada, Y.: Modelling Freshwater Resources at the Global Scale: Challenges and Prospects, Surv. Geophys., 37, 195–221, doi:10.1007/s10712-015-9343-1, 2016.
Elliott, J., Deryng, D., Muller, C., Frieler, K., Konzmann, M., Gerten, D., Glotter, M., Florke, M., Wada, Y., Best, N., Eis-ner, S., Fekete, B. M., Folberth, C., Foster, I., Gosling, S. N., Haddeland, I., Khabarov, N., Ludwig, F., Masaki, Y., Olin, S., Rosenzweig, C., Ruane, A. C., Satoh, Y., Schmid, E., Stacke, T., Tang, Q., and Wisser, D.: Constraints and potentials of fu-ture irrigation water availability on agricultural production un-der climate change, P. Natl. Acad. Sci. USA, 111, 3239–3244, doi:10.1073/pnas.1222474110, 2014.
Fan, H., He, D., and Wang, H.: Environmental con-sequences of damming the mainstream Lancang-Mekong River: A review, Earth Sci. Rev., 146, 77–91, doi:10.1016/j.earscirev.2015.03.007, 2015.
Fekete, B. M., Wisser, D., Kroeze, C., Mayorga, E., Bouwman, L., Wollheim, W. M., and Vörösmarty, C.: Millennium Ecosys-tem Assessment scenario drivers (1970–2050): Climate and hy-drological alterations, Global Biogeochem. Cy., 24, GB0A12, doi:10.1029/2009GB003593, 2010.
Finger, D., Heinrich, G., Gobiet, A., and Bauder, A.: Projections of future water resources and their uncertainty in a glacierized catchment in the Swiss Alps and the subsequent effects on hy-dropower production during the 21st century, Water Resour. Res., 48, W02521, doi:10.1029/2011WR010733, 2012.
Frieler, K., Levermann, A., Elliott, J., Heinke, J., Arneth, A., Bierkens, M. F. P., Ciais, P., Clark, D. B., Deryng, D., Döll, P., Falloon, P., Fekete, B., Folberth, C., Friend, A. D., Gellhorn, C., Gosling, S. N., Haddeland, I., Khabarov, N., Lomas, M., Masaki, Y., Nishina, K., Neumann, K., Oki, T., Pavlick, R., Ruane, A. C., Schmid, E., Schmitz, C., Stacke, T., Stehfest, E., Tang, Q., Wisser, D., Huber, V., Piontek, F., Warszawski, L., Schewe, J., Lotze-Campen, H., and Schellnhuber, H. J.: A framework for the cross-sectoral integration of multi-model impact projections: land use decisions under climate impacts uncertainties, Earth Syst. Dynam., 6, 447–460, doi:10.5194/esd-6-447-2015, 2015. Gaudard, L., Gilli, M., and Romerio, F.: Climate Change Impacts
on Hydropower Management, Water Resour. Manag., 27, 5143– 5156, doi:10.1007/s11269-013-0458-1, 2013.
General Office of the State Council (GOSC): Energy Development Strategy Action Plan (2014–2020), available at: http://www.gov. cn/zhengce/content/2014-11/19/content_9222.htm (last access: 10 January 2016), 2014. (in Chinese)
Gosling, S. N. and Arnell, N. W.: Simulating current global river runoff with a global hydrological model: model revisions, vali-dation, and sensitivity analysis, Hydrol. Process., 25, 1129–1145, doi:10.1002/hyp.7727, 2011.
Hagemann, S. and Gates, L. D.: Improving a subgrid runoff param-eterization scheme for climate models by the use of high resolu-tion data derived from satellite observaresolu-tions, Clim. Dynam., 21, 349–359, doi:10.1007/s00382-003-0349-x, 2003.
Hamlet, A., Lee, S.-Y., Mickelson, K. B., and Elsner, M.: Effects of projected climate change on energy supply and demand in the Pa-cific Northwest and Washington State, Clim. Change, 102, 103– 128, 10.1007/s10584-010-9857-y, 2010.
Hamududu, B. and Killingtveit, A.: Assessing Climate Change Impacts on Global Hydropower, Energies, 5, 305–322, doi:10.3390/en5020305, 2012.
Han, S., Tian, F., and Hu, H.: Positive or negative correlation be-tween actual and potential evaporation? Evaluating using a non-linear complementary relationship model, Water Resour. Res., 50, 1322–1336, doi:10.1002/2013WR014151, 2014.
Hanasaki, N., Kanae, S., and Oki, T.: A reservoir operation scheme for global river routing models, J. Hydrol., 327, 22–41, doi:10.1016/j.jhydrol.2005.11.011, 2006.
Hanasaki, N., Kanae, S., Oki, T., Masuda, K., Motoya, K., Shi-rakawa, N., Shen, Y., and Tanaka, K.: An integrated model for the assessment of global water resources – Part 1: Model descrip-tion and input meteorological forcing, Hydrol. Earth Syst. Sci., 12, 1007–1025, doi:10.5194/hess-12-1007-2008, 2008. Hejazi, M., Edmonds, J., Clarke, L., Kyle, P., Davies, E.,
Chaturvedi, V., Wise, M., Patel, P., Eom, J., Calvin, K., Moss, R., and Kim, S.: Long-term global water projections us-ing six socioeconomic scenarios in an integrated assessment modeling framework, Technol. Forecast. Soc., 81, 205–226, doi:10.1016/j.techfore.2013.05.006, 2014.
Hejazi, M. I., Voisin, N., Liu, L., Bramer, L. M., Fortin, D. C., Hathaway, J. E., Huang, M., Kyle, P., Leung, L. R., Li, H.-Y., Liu, Y., Patel, P. L., Pulsipher, T. C., Rice, J. S., Tesfa, T. K., Vernon, C. R., and Zhou, Y.: 21st century United States emis-sions mitigation could increase water stress more than the climate change it is mitigating, P. Natl. Acad. Sci., 112, 10635–10640, doi:10.1073/pnas.1421675112, 2015.
Hempel, S., Frieler, K., Warszawski, L., Schewe, J., and Piontek, F.: A trend-preserving bias correction – the ISI-MIP approach, Earth Syst. Dynam., 4, 219–236, doi:10.5194/esd-4-219-2013, 2013. Hu, Y. and Cheng, H.: The urgency of assessing the greenhouse
gas budgets of hydroelectric reservoirs in China, Nature Clim. Change, 3, 708–712, doi:10.1038/nclimate1831, 2013.
Huang, H. and Yan, Z.: Present situation and future prospect of hy-dropower in China, Renew. Sust. Energ. Rev., 13, 1652–1656, doi:10.1016/j.rser.2008.08.013, 2009.
International Energy Agency (IEA): World Energy Investment Outlook: Special Report, available at: https://www.iea.org/ publications/freepublications/publication/WEIO2014.pdf (last access: 16 January 2016), 2014.
ISI-MIP: Hydropower potential data, available at: https://www. isimip.org, last access: 19 August 2016.
Jamali, S., Abrishamchi, A., and Madani, K.: Climate Change and Hydropower Planning in the Middle East: Implications for Iran’s Karkheh Hydropower Systems, J. Energ. Eng.-ASCE, 139, 153– 160, doi:10.1061/(ASCE)EY.1943-7897.0000115, 2013. Kao, S.-C., Sale, M. J., Ashfaq, M., Uria Martinez, R., Kaiser, D. P.,
Wei, Y., and Diffenbaugh, N. S.: Projecting changes in annual hy-dropower generation using regional runoff data: An assessment of the United States federal hydropower plants, Energy, 80, 239– 250, doi:10.1016/j.energy.2014.11.066, 2015.
Kaygusuz, K.: Hydropower and the World’s Energy Future, Energ. Source., 26, 215–224, doi:10.1080/00908310490256572, 2004. Kendy, E., Wang, J., Molden, D. J., Zheng, C., Liu, C., and
Steen-huis, T. S.: Can urbanization solve inter-sector water conflicts? Insight from a case study in Hebei Province, North China Plain, Water Policy, 9, 75–93, 2007.
Knutti, R. and Sedlacek, J.: Robustness and uncertainties in the new CMIP5 climate model projections, Nature Clim. Change, 3, 369– 373, doi:10.1038/nclimate1716, 2013.
Lehner, B., Czisch, G., and Vassolo, S.: The impact of global change on the hydropower potential of Europe: a model-based analysis, Energ. Policy, 33, 839–855, doi:10.1016/j.enpol.2003.10.018, 2005.
Lehner, B., Liermann, C. R., Revenga, C., Vörösmarty, C., Fekete, B., Crouzet, P., Döll, P., Endejan, M., Frenken, K., Magome, J., Nilsson, C., Robertson, J. C., Rödel, R., Sindorf, N., and Wisser, D.: High-resolution mapping of the world’s reservoirs and dams for sustainable river-flow management, Front. Ecol. Environ., 9, 494–502, doi:10.1890/100125, 2011.
Leng, G. and Tang, Q.: Modeling the Impacts of Future Climate Change on Irrigation over China: Sensitivity to Adjusted Projec-tions, J. Hydrometeorol., 15, 2085–2103, doi:10.1175/JHM-D-13-0182.1, 2014.
Leng, G., Tang, Q., Huang, M., Hong, Y., and Ruby, L.: Projected changes in mean and interannual variability of surface water over continental China, Science China Earth Sciences, 58, 739–754, doi:10.1007/s11430-014-4987-0, 2015.
Li, J. and Shi, L.: Brief Description of Hydropower Resources in China, Water Power, 32, 3–7, 2006. (in Chinese)
Liang, X., Lettenmaier, D. P., Wood, E. F., and Burges, S. J.: A simple hydrologically based model of land surface water and en-ergy fluxes for general circulation models, J. Geophys. Res., 99, 14415–14428, doi:10.1029/94jd00483, 1994.
Liu, J., Zuo, J., Sun, Z., Zillante, G., and Chen, X.: Sustainability in hydropower development – A case study, Renew. Sust. Energ. Rev., 19, 230–237, doi:10.1016/j.rser.2012.11.036, 2013. Liu, J., Zhao, D., Gerbens-Leenes, P. W., and Guan, D.: China’s
ris-ing hydropower demand challenges water sector, Scientific Re-ports, 5, 11446, doi:10.1038/srep11446, 2015.
Liu, W., Lund, H., Mathiesen, B. V., and Zhang, X.: Potential of renewable energy systems in China, Appl. Energy, 88, 518–525, doi:10.1016/j.apenergy.2010.07.014, 2011.
Liu, X., Zhang, X.-J., Tang, Q., and Zhang, X.-Z.: Effects of surface wind speed decline on modeled hydrological con-ditions in China, Hydrol. Earth Syst. Sci., 18, 2803–2813, doi:10.5194/hess-18-2803-2014, 2014.
Lu, Y.: Hydropower and sustainable development in China, in: Symposium on Hydropower and Sustainable Development, 27– 19 October 2004, Beijing, China, 2004.
Ma, H., Yang, D., Tan, S. K., Gao, B., and Hu, Q.: Impact of climate variability and human activity on streamflow decrease in the Miyun Reservoir catchment. J. Hydrol., 389, 317–324, doi:10.1016/j.jhydrol.2010.06.010, 2010.
Madani, K. and Lund, J.: Estimated impacts of climate warming on California’s high-elevation hydropower, Clim. Change, 102, 521–538, doi:10.1007/s10584-009-9750-8, 2010.
Majone, B., Villa, F., Deidda, R., and Bellin, A.: Impact of climate change and water use policies on hydropower potential in the south-eastern Alpine region, Sci. Total Environ., 543, 965–980, doi:10.1016/j.scitotenv.2015.05.009, 2016.
Maran, S., Volonterio, M., and Gaudard, L.: Climate change impacts on hydropower in an alpine catchment, Environ. Sci. Policy, 43, 15–25, doi:10.1016/j.envsci.2013.12.001, 2014.
Minville, M., Brissette, F., Krau, S., and Leconte, R.: Adaptation to Climate Change in the Management of a Canadian Water-Resources System Exploited for Hydropower, Water Resour. Manag., 23, 2965–2986, doi:10.1007/s11269-009-9418-1, 2009. Müller Schmied, H., Eisner, S., Franz, D., Wattenbach, M., Port-mann, F. T., Flörke, M., and Döll, P.: Sensitivity of simulated global-scale freshwater fluxes and storages to input data, hydro-logical model structure, human water use and calibration, Hy-drol. Earth Syst. Sci., 18, 3511–3538, doi:10.5194/hess-18-3511-2014, 2014.
Oleson, K. W., Lawrence, D. M., Gordon, B., Flanner, M. G., Kluzek, E., Peter, J., Levis, S., Swenson, S. C., Thornton, E., and Feddema, J.: Technical description of version 4.0 of the Community Land Model (CLM), NCAR Tech. Note NCAR/TN-4781STR, 257, available at: http://www.cesm.ucar.edu/models/ cesm1.0/clm/CLM4_Tech_Note.pdf (last access: 10 January 2016), 2010.
Pereira-Cardenal, S., Madsen, H., Arnbjerg-Nielsen, K., Riegels, N., Jensen, R., Mo, B., Wangensteen, I., and Bauer-Gottwein, P.: Assessing climate change impacts on the Iberian power system using a coupled water-power model, Clim. Change, 126, 351– 364, doi:10.1007/s10584-014-1221-1, 2014.
Pérez-Díaz, J. I. and Wilhelmi, J. R.: Assessment of the eco-nomic impact of environmental constraints on short-term hydropower plant operation, Energ. Policy, 38, 7960–7970, doi:10.1016/j.enpol.2010.09.020, 2010.
Piontek, F., Muller, C., Pugh, T. A. M., Clark, D. B., Deryng, D., Elliott, J., Colon Gonzalez, F. D. J., Florke, M., Folberth, C., Franssen, W., Frieler, K., Friend, A. D., Gosling, S. N., Hem-ming, D., Khabarov, N., Kim, H., Lomas, M. R., Masaki, Y., Mengel, M., Morse, A., Neumann, K., Nishina, K., Ostberg, S., Pavlick, R., Ruane, A. C., Schewe, J., Schmid, E., Stacke, T., Tang, Q., Tessler, Z. D., Tompkins, A. M., Warszawski, L., Wisser, D., and Schellnhuber, H. J.: Multisectoral climate im-pact hotspots in a warming world, P. Natl. Acad. Sci. USA, 111, 3233–3238, doi:10.1073/pnas.1222471110, 2014.
Pokhrel, Y. N., Oki, T., and Kanae, S.: A Grid Based Assessment of Global Theoretical Hydropower Potential, Annual Journal of Hydraulic Engineering, JSCE, 52, 7–12, 2008.
Pokhrel, Y. N., Koirala, S., Yeh, P. J. F., Hanasaki, N., Longuev-ergne, L., Kanae, S., and Oki, T.: Incorporation of groundwa-ter pumping in a global Land Surface Model with the
repre-sentation of human impacts, Water Resour. Res., 51, 78–96, doi:10.1002/2014WR015602, 2015.
Qiu, J.: China drought highlights future climate threats, Nature News, 465, 142–143, 2010.
Ramachandra, T. V. and Shruthi, B. V.: Spatial mapping of renew-able energy potential, Renew. Sust. Energ. Rev., 11, 1460–1480, doi:10.1016/j.rser.2005.12.002, 2007.
Resch, G., Held, A., Faber, T., Panzer, C., Toro, F., and Haas, R.: Potentials and prospects for renewable energies at global scale, Energ. Policy, 36, 4048–4056, doi:10.1016/j.enpol.2008.06.029, 2008.
Schaefli, B., Hingray, B., and Musy, A.: Climate change and hy-dropower production in the Swiss Alps: quantification of po-tential impacts and related modelling uncertainties, Hydrol. Earth Syst. Sci., 11, 1191–1205, doi:10.5194/hess-11-1191-2007, 2007.
Schewe, J., Heinke, J., Gerten, D., Haddeland, I., Arnell, N. W., Clark, D. B., Dankers, R., Eisner, S., Fekete, B. M., Colon-Gonzalez, F. J., Gosling, S. N., Kim, H., Liu, X., Masaki, Y., Portmann, F. T., Satoh, Y., Stacke, T., Tang, Q., Wada, Y., Wisser, D., Albrecht, T., Frieler, K., Piontek, F., Warszawski, L., and Kabat, P.: Multimodel assessment of water scarcity un-der climate change, P. Natl. Acad. Sci. USA, 111, 3245–3250, doi:10.1073/pnas.1222460110, 2014.
Stickler, C. M., Coe, M. T., Costa, M. H., Nepstad, D. C., McGrath, D. G., Dias, L. C. P., Rodrigues, H. O., and Soares-Filho, B. S.: Dependence of hydropower energy generation on forests in the Amazon Basin at local and regional scales, P. Natl. Acad. Sci., 110, 9601–9606, doi:10.1073/pnas.1215331110, 2013.
Sun, Y., Tian, F., Yang, L., and Hu, H.: Exploring the spatial variability of contributions from climate variation and change in catchment properties to streamflow decrease in a mesoscale basin by three different methods, J. Hydrol., 508, 170–180, doi:10.1016/j.jhydrol.2013.11.004, 2014.
Takata, K., Emori, S., and Watanabe, T.: Development of the minimal advanced treatments of surface interaction and runoff, Global Planet. Change, 38, 209–222, doi:10.1016/S0921-8181(03)00030-4, 2003.
Tang, Q., Oki, T., and Kanae, S.: A distributed biosphere hydro-logical model (DBHM) for large river basin, Annual Journal of Hydraulic Engineering, 50, 37–42, 2006.
Tang, Q., Hu, H., Oki, T., and Tian, F.: Water balance within in-tensively cultivated alluvial plain in an arid environment, Water Resour. Manag., 21, 1703–1715, doi:10.1007/s11269-006-9121-4, 2007a.
Tang, Q., Oki, T., Kanae, S., and Hu, H.: The influence of precipitation variability and partial irrigation within grid cells on a hydrological simulation, J. Hydrometeorol., 8, 499–512, doi:10.1175/jhm589.1, 2007b.
Tang, Q., Oki, T., Kanae, S., and Hu, H.: Hydrological Cy-cles Change in the Yellow River Basin during the Last Half of the Twentieth Century, J. Climate, 21, 1790–1806, doi:10.1175/2007JCLI1854.1, 2008.
Tang, Q., Huang, Z., Liu, X., Han, S., Leng, G., Zhang, X., and Mu, M.: Impacts of Human Water Use on the Large-scale Terrestrial Water Cycle, Advances in Earth Science, 30, 1091–1099, 2015. (in Chinese)
River basin, China, Hydrol. Earth Syst. Sci., 17, 4471–4480, doi:10.5194/hess-17-4471-2013, 2013.
van Beek, L. P. H., Wada, Y., and Bierkens, M. F. P.: Global monthly water stress: 1. Water balance and water availability, Water Re-sour. Res., 47, W07517, doi:10.1029/2010WR009791, 2011. van Vliet, M. T. H., Wiberg, D., Leduc, S., and Riahi, K.:
Power-generation system vulnerability and adaptation to changes in cli-mate and water resources, Nature Clim. Change, 6, 375–380, doi:10.1038/nclimate2903, 2016.
Vicuna, S., Leonardson, R., Hanemann, M. W., Dale, L. L., and Dracup, J. A.: Climate change impacts on high elevation hy-dropower generation in California’s Sierra Nevada: a case study in the Upper American River, Clim. Change, 87, 123–137, doi:10.1007/s10584-007-9365-x, 2008.
Vicuña, S., Dracup, J., and Dale, L.: Climate change impacts on two high-elevation hydropower systems in California, Clim. Change, 109, 151–169, doi:10.1007/s10584-011-0301-8, 2011.
Voisin, N., Li, H., Ward, D., Huang, M., Wigmosta, M., and Le-ung, L. R.: On an improved sub-regional water resources man-agement representation for integration into earth system models, Hydrol. Earth Syst. Sci., 17, 3605–3622, doi:10.5194/hess-17-3605-2013, 2013.
Wang, P., Dong, S., and Lassoie, J. P.: The Large Dam Dilemma: An Exploration of the Impacts of Hydro Projects on People and the Environment in China, Springer, Dordrecht, the Netherlands, 2013.
Warszawski, L., Frieler, K., Huber, V., Piontek, F., Serdeczny, O., and Schewe, J.: The Inter-Sectoral Impact Model Intercompar-ison Project (ISI–MIP): Project framework, P. Natl. Acad. Sci., 111, 3228–3232, doi:10.1073/pnas.1312330110, 2014.
Wasko, C., Sharma, A., and Westra, S.: Reduced spatial extent of extreme storms at higher temperatures, Geophys. Res. Lett., 43, 4026–4032, doi:10.1002/2016GL068509, 2016.
Wisser, D., Fekete, B. M., Vörösmarty, C. J., and Schumann, A. H.: Reconstructing 20th century global hydrography: a contribution to the Global Terrestrial Network- Hydrology (GTN-H), Hydrol. Earth Syst. Sci., 14, 1–24, doi:10.5194/hess-14-1-2010, 2010. World Energy Council (WEC): World energy resources 2013
survey, London, 468, available at: https://www.worldenergy.org/ wp-content/uploads/2013/09/Complete_WER_2013_Survey. pdf (last access: 16 January 2016), 2013.
Wu, Y. and Chen, J.: An Operation-Based Scheme for a Multiyear and Multipurpose Reservoir to Enhance Macroscale Hydrologic Models, J. Hydrometeor, 13, 270–283, doi:10.1175/JHM-D-10-05028.1, 2011.
Yan, Z., Peng, C., Yuan, D., and Qian, G.: General Description of the Re-check Work of the National Hydropower Resources Sur-vey, Water Power, 32, 8–11, 2006. (in Chinese)
Zhang, Q.: The South-to-North Water Transfer Project of China: Environmental Implications and Monitoring Strategy1, J. Am. Water Resour. As., 45, 1238–1247, doi:10.1111/j.1752-1688.2009.00357.x, 2009.