in the population sciences published by the Max Planck Institute for Demographic Research Konrad-Zuse Str. 1, D-18057 Rostock · GERMANY www.demographic-research.org
DEMOGRAPHIC RESEARCH
VOLUME 24, ARTICLE 12, PAGES 257-292
PUBLISHED 11 FEBRUARY 2011
http://www.demographic-research.org/Volumes/Vol24/12/ DOI: 10.4054/DemRes.2011.24.12
Research Article
A summary period measure of
immigrant advancement in the U.S.
John Pitkin
Dowell Myers
© 2011 John Pitkin & Dowell Myers.
This open-access work is published under the terms of the Creative Commons Attribution NonCommercial License 2.0 Germany, which permits use, reproduction & distribution in any medium for non-commercial purposes, provided the original author(s) and source are given credit.
1 Introduction 258 2 Measuring the advancement of immigrants 259 2.1 Absolute advancement, not relative 260 2.2 Domains of advancement 261
3 Temporal biases 262
3.1 Sources of temporal bias 262 3.2 Interdependence of temporal effects 264 3.3 Capturing the full range of ages and immigrant experience 266 4 Desired properties for a measure of the rate of advance 266 5 Constructing a summary measure of immigrant advancement 267 5.1 Discrete measured segments of change 267 5.2 Constructing the synthetic lifetime sequence of change 268 6 Outcome variables and data sources 271
6.1 Outcomes 271
6.2 Data 272
7 Results 275
7.1 Initial and expected lifetime attainments 275
7.2 Expected advances 275
7.3 Comparisons and discussion 278
8 Conclusions 279
9 Acknowledgments 281
References 282
A summary period measure of immigrant advancement in the U.S.
John Pitkin1
Dowell Myers2
Abstract
This paper proposes a method for summarizing the pace of advancement of the foreign-born population in a given period. The method standardizes for variations in the duration of residence or age composition of immigrant groups, attainments possessed by different groups when first observed after entry, and other temporal effects on measured advances, forming an index of Expected Lifetime Advance based on the pace of change in a period. The measure is applied to Mexican and Asian immigrants. Between the 1980s and the 1990s, the rates of advancement for Mexicans accelerated in six out of seven social, economic, and civic outcomes. Rates of advancement for Asians were similar in both decades. A worked example of the calculation of the index can be found in an Excel workbook published with the paper.
1. Introduction
The status attainment of immigrants to the U.S., including their pace of advancement while resident in the U.S., is a source of continuing debate. Despite a large volume of detailed research, surprisingly little is known about the general pace of advancement, how it varies between groups, and how rates of advancement among immigrants have varied between decades. Assessments of changes over time are subject to substantial biases due to variations in the composition of groups along major temporal dimensions, including age, length of residence, and age at arrival. In order to correct for these biases, this paper proposes a summary measure of immigrant advancement based on techniques of standardization and commonly available data.
The new measure of immigrant advancement proposed in this article summarizes the advances of immigrants at all ages and stages of the settlement process in the period between two censuses or surveys. Separate estimates are prepared for each of several outcome criteria, thus yielding a profile of immigrant advancement in different life domains. An essential feature of the proposed measure is that it distinguishes between attainment levels and incremental rates of advance in the intercensal period, thus separating out the cumulative effects of initial endowments and advances in prior periods. Rates of advancement are observed for distinct cohorts and are combined into a standardized index that is net of compositional effects, such as changes in age distribution, recency of arrival, and age at arrival. We call this index the Expected Lifetime Advancement (ELA) index. A separate index is compiled for each criterion variable of interest for immigrants’ status attainment or progress.
As a demonstration of the new measure, we estimate the advances of immigrants to the U.S. from two geographical regions over two decades. Advances are measured for seven indicators of cultural, educational, economic, and civic status. Taken together, the measured advances in different domains create a much fuller picture of the overall progress of first-generation immigrants than can be obtained from looking at any single outcome, and the differences observed between the decades illustrate how variable the pace of advancement can be in different periods.
made by immigrants. We are thus unable to answer the most basic questions, including “…[H]ow are the immigrants themselves doing?”(Smith and Edmonston 1997: 17), and whether immigrants have made faster or slower overall progress in different periods.
The results presented here demonstrate that the proposed measure provides answers to such questions. We find that immigrants from Mexico advanced more rapidly in a broad range of domains during the 1990s than they did during the 1980s, while Asian immigrants advanced at the same pace in the 1990s as in the 1980s. We hypothesize that the difference between origin groups is due to the effects of the Immigration Reform and Control Act (IRCA) of 1986, which benefited many more Mexicans than Asians. If confirmed, this hypothesis has important implications for the current debate about immigration policy and proposed reforms.
2. Measuring the advancement of immigrants
By immigrant advancement we mean the progress of the foreign-born population as measured by changes over a time interval in immigrants’ status or characteristics that are expected to change with age and longer residence in the U.S.. Advancement is distinct from the related concept of assimilation to the norms of the native-born population. The broad literature on immigrant status achievement focuses on immigrants’ attainments at particular times, but with relatively few exceptions does not compare attainments or measure advances over time.
One study of a single status outcome explicitly compared rates of advancement of the wages of immigrants between decades (Borjas and Friedberg 2009) by measuring attainments at several points in time. The authors found that the rate of assimilation between 1990 and 2000 for one cohort of immigrants—men who arrived in 1985-89 at ages 25-34—was slower than for the cohort of the same ages who arrived in the previous decade. A second study comparing immigrants of different origins (Duleep and Regets 1997) found that those who arrive with less human capital and poorer endowments start with lower wages than other groups but make more rapid gains at later stages. The implication is that the declines in the mean wages of new immigrants that took place in 1970-1990 should have led to more rapid increases in the mean wages of these same immigrants later in their careers, but this was not explicitly tested.
between groups and between decades, and earlier waves of immigrants were tracked across decades to find out to what extent they had converged with the native-born population. Vigdor concluded that assimilation declined during the 1980s, remained stable through the 1990s, and then increased slightly after 2000, in part due to more rapid cultural assimilation.
2.1 Absolute advancement, not relative
Like many studies of immigrant progress, Vigdor measured assimilation, a relative measure of varying gaps between immigrants and their native-born contemporaries. This provides a standard of comparison for immigrants as well as a statistical control for variations in those markets and other conditions which affect the entire population. In the case of wages, the implicit assumption is that labor market conditions affect native- and born workers equally, but not the gap between native- and foreign-born workers. However, such measures of assimilation do not measure rates of immigrant advancement.
The absolute advancements made by immigrants—whether in wages, English fluency, or rates of naturalization—are of greater and more general interest than the corresponding gaps with the born population. Advancements among the native-born offer at best an elastic standard of comparison, thus complicating the interpretation of measured assimilation.3 Before rushing to judgment on issues of assimilation, we must first attempt to accurately measure the pace of advancement among immigrants relative to their initial condition.
Although Vigdor’s measure is appealing in its apparent simplicity, the method is not transparent and leads to anomalies. Initial attainments and subsequent rates of advancement are not distinguished. Nor are immigrant advances distinguished from changes in the native-born population: convergence could occur or fail to occur due to changes in either population. For example, an increase in higher education levels among the native-born children of Mexican immigrants would perversely make the Mexican-origin population appear to be less assimilated (i.e., the gap between the native and the foreign-born population would widen) than if the children were to maintain their current low levels of education. This illustrates how an emphasis on gaps between immigrants and the native-born is a less reliable indicator than changes in absolute attainments.
3 For example, Borjas and Friedberg (2009) found that the acceleration of wage assimilation of low-skill
2.2 Domains of advancement
What are the appropriate criterion variables for measuring immigrant advancement? While wages have been an important focus of research on the economic success of immigrants, pay is hardly the only indicator or measure of immigrants’ advancement into the mainstream of American life. A large body of research has accumulated on immigrants’ advances in other areas, including studies on the acquisition of English language skills by Stevens (1994), Espenshade and Fu (1997), and Hakimzadeh and Cohn (2007); on the use of English in the home by Alba and Nee (2003); on the acquisition and use of English and linguistic isolation by Portes and Rumbaut (1996); on voting by Ramakrishnan and Espenshade (2001); on political party identification by Wong (2000); on homeownership by Alba and Logan (1992) and Myers and Lee (1998); on locational attainment by Alba and Logan (1991) and White and Glick (2009); and on occupational status by Toussaint-Comeau (2006) and White and Glick (2009). All of these domains should be addressed in an overall assessment of immigrant advancement. It is not necessary to combine them into a single summary; however, it would be useful to have a way to make comparisons between them.
Most studies of immigrant advancement treat a single or a closely related set of outcome variables in a single domain (e.g., English language skills, use of English, and linguistic isolation by Portes and Rumbaut, 1996). However, some studies treat multiple outcomes as being either causally related or as different dimensions of an underlying process. In the field of health research, for instance, immigrants’ use of English language is employed as a primary indicator of what health researchers characterize as acculturation (Marin et al. 1987; Mainous, Diaz, and Geesey 2008). In economics, the level of education is used as a measure of skills and human capital, as is English proficiency, and both are often analyzed in conjunction with earnings (Chiswick 1991, Sorensen and Enchautegui 1994, and Park 1999). In almost every case these other indicators are treated as explanatory variables for the process of immigrant advancement, rather than as manifestations of a related, parallel process.
assimilation: sociocultural and economic. White and Glick (2009) posited three clusters: educational achievement, labor market, and residential attainment. However, these clusters are not presented in such a way that they can be viewed in summary fashion. In contrast to other studies, the Park and Myers (2010) study of intergenerational mobility directly compared the mean changes in six outcome areas between immigrant parents and the children’s generation for four major race-ethnic groups when they had reached the same approximate age 25 years later.
3. Temporal biases
The advancement of first-generation immigrants is a process in time, and measuring it requires careful attention to temporal influences, the effects of which vary over time. Influential factors include the transformations that occur with increasing length of residence, the aging that accompanies longer periods of residence, differences in status attainments attributable to the age at arrival, and differences in status attainments due to the initial endowments that serve as starting points for trajectories of advancement. Their effects may be compounded by variations in the size of cohorts arriving in different periods. All of these factors cannot readily be addressed simultaneously, so compromises and short-cuts are regularly employed in empirical research. The unfortunate result is the introduction of temporal biases that vary—sometimes widely— across methods and outcomes. The biases amount to distortions that conflate the effects of interest with unrelated compositional differences, or with other unobserved temporal effects. Moreover, differences between the specifications adopted in different domains precludes meaningful comparisons between results.
3.1 Sources of temporal bias
improving over time.4 Initial levels of attainment and subsequent advancement must be separately identified and measured, and should not be conflated or confused.
A more widely recognized form of temporal bias is the cross-sectional cohort fallacy, which strings together age-specific or duration-specific attainments observed at a single point in time as if the cross-sectional sequence represented the longitudinal path of attainment. Although the error of using age cross-sections in this manner is widely recognized, the equivalent problem is commonly ignored when comparisons are made between duration groups. Scholars may resort to this technique when only a single cross-section is available.5 A well-known example of this type of error is found in Chiswick’s (1978) analysis of earnings by successively longer settled residents based solely on 1970 census data.6 This analysis was later challenged by Borjas (1985) after a second cross-section supplied by the 1980 census became available. The general conclusion was that a minimum of two observations in time are needed to measure actual changes by cohorts.
An unaccountedagecompositional shift creates bias when the status attainment of an older population is compared to that a younger population. The potential for bias in such cases is so obvious that researchers are generally careful to control for age when comparing groups or time periods; adjustment for age differences may well be the most common temporal control employed throughout the social sciences. A similar bias is created by an unaccounted shift in durational composition, when the flow of immigrant arrivals proceeds unevenly across decades. The resulting duration composition of the foreign-born residents will be skewed. For example, the acceleration of immigration from 1970 to 2000 greatly increased the numbers of recent arrivals relative to the longer resident previous arrivals.7 The leveling off of immigration after 2000 and the concurrent lengthening residence of earlier arrivals promises to shift the duration composition of the foreign-born to a longer settled average profile. The practical effect of duration differences is that, because recent arrivals have not had as much time to advance as immigrants of longer residence, an increase in the number of recent arrivals
4 An illustration of this biased interpretation is the comparison of homeownership attainment by Asians and
Latinos. The former attained high levels of homeownership shortly after arrival, with much less progress thereafter; while the latter exhibited substantial upward mobility that is sustained over three successive decades of lengthening residence (Myers and Lee 1998).
5 Several studies of immigrant cohort advancement have tapped available sources of true panel data (e.g.,
Duleep and Regets 1997 for wages, and Toussaint-Comeau 2006 for occupational status). However, limitations of population coverage, sample size, and historical depth in available panel surveys limit their wider use. The New Immigrant Survey is a particularly important new source that will enhance longitudinal understanding in the future.
6 See Hakimzadeh and Cohn (2007) for a more recent example.
7 In 1970, 47% of the foreign-born population had entered the U.S. more than 30 years previously; in 1990,
tends to lower average attainment levels for the foreign-born population.8 Thus, comparisons of immigrant advancement in different periods must also control for shifts in durational composition.
There are, of course, many other important control variables that should be employed when making comparisons, especially gender and country of origin. However, our focus on the temporal dimensions is not arbitrary, as these dimensions are by definition linked to each other and to every measurement of change over time. As we have seen, the problem is not that time and temporal dimensions are not addressed in other studies of immigrant advancement; it is that they are treated incompletely and inconsistently.
3.2 Interdependence of temporal effects
Efforts to control biases due to interdependence between temporal effects run afoul of the well-known temporal identification problem. To “hold constant” a temporal factor is to stop time on one dimension, while closely linked dimensions are hypothetically allowed to roll forward. The age-period-cohort identification problem is that dimensions are jointly defined, and are not statistically separable: period = cohort (year of birth) + age. However, in the case of immigrants, the identification difficulties are compounded. This problem is addressed in the double cohort analysis introduced by Myers and Lee (1996) and Myers and Cranford (1998). For every immigrant there are two important clocks. One starts at birth and tracks an immigrant’s age, and, by inference, stage of life. The other starts on the day of entry to the U.S. as an immigrant, and tracks the time spent in the U.S. and the stage of settlement.9 The age-period-cohort identification problem for birth cohorts is paralleled by a duration-period-cohort identification problem for immigrant entry cohorts. The two time scales interact because aging and duration are synchronous. Moreover, in addition to this scheme, the time spent in the U.S. may have different effects depending on the age at arrival as an immigrant.
This interdependence of temporal dimensions complicates the measurement of immigrant advancement in several ways. As time passes, immigrants grow older, the length of time they have spent in the U.S. increases, and new cohorts of arrivals of smaller or larger numbers enter the U.S., and together these factors alter the temporal
8 The effect of duration on immigrant status attainment is reviewed in Myers (2007: Chapter 6) and
demonstrated in the case of six different outcome measures. The effects on average advancement of the immigrant population are noted and discussed in Vigdor (2008).
9 Although the date of entry to the U.S. may be uncertain for circular migrants, this ambiguity is mostly
composition of the foreign-born. Moreover, the passage of historical time changes the economic and political context in ways that can help or impede immigrant advancement. Thus, a snapshot comparison of immigrant status attainment at one point of time embeds many factors, and comparisons between two points in time include both the historical changes and the simultaneous changes in age and duration of residence. Failure to account for all these temporal variables creates a bias of omitted temporal
dimensions, because the effects of unaccounted temporal dimensions become embedded
in the included dimensions. Without a standardized measure, variations in the specification or measurement of temporal variables almost invariably introduce biases and distort comparisons.
Researchers have gravitated toward different temporal specifications for the analysis of different outcome variables, because different temporal factors are more salient for particular outcomes. In a systematic comparison of age-at-arrival effects on different outcomes, Myers, Gao, and Emeka (2009) found that the effects of a young age at arrival are much greater for language acquisition than other outcomes, and have virtually no effect on some economic outcomes. Thus, studies of advances in domains other than language typically include age, rather than age at arrival, as an explanatory variable. Examples of these studies are Ramakrishnan and Espenshade (2001) and Wong (2000) for political participation, Sorensen and Enchautegui (1994) for earnings, and Toussaint-Comeau (2006) for occupational status. For homeownership, the time elapsed since arrival in the U.S. has been found to be as important as the current age (Myers and Lee 1998). In addition, the labor and housing market conditions at the time of entry have been found to be important for shaping subsequent career attainments (Borjas 1985, Myers and Lee 1998).
Another widely used strategy has been to selectively sample the population so as to suppress unwanted temporal biases, e.g., by limiting the analysis to only the adult population, typically age 25 and older. While this restriction eliminates one temporal bias, it introduces another. For a population of a given age, length of U.S. residence is perfectly correlated with age at arrival; when the population age distribution is truncated, as in this case, the correlation is reduced but not eliminated. Another sample selection technique chooses a single entry cohort to trace using panel data. This approach is limited by its necessarily narrow focus, and by the short temporal depth of available panel datasets.10
10 The first panel of the National Immigrant Survey of legal immigrants to the U.S. was first interviewed in
3.3 Capturing the full range of ages and immigrant experience
Biases due to correlation between the time since immigration and age at arrival can be suppressed if the population is further narrowed to a particular age group who arrived during a particular decade. For example, Borjas and Friedberg (2009) considered only those aged 25-34 who entered the U.S. in a specific decade. By focusing on a narrow segment of the demographic spectrum, this method obtains a temporally unbiased measure of advances, but loses generality because it necessarily excludes the advances made by the majority of immigrants who arrive at other ages. Though temporally unbiased, it is at best an indicator of the advances made by immigrants who arrived at other ages and in other decades. (Of the entire foreign-born population in 2000, 31% entered the U.S. between ages 25 to 34, 44% at younger ages, and 25% at older ages. U.S. Bureau of the Census 2003a.) Even if the benchmark group is the modal age at arrival, its advance may deviate from the overall average.
A more inclusive method of controlling temporal biases that is representative of immigrants at different stages of life and settlement is therefore needed.
4. Desired properties for a measure of the rate of advance
We seek a measure of the average rate of progress made by a population of immigrants. To achieve this purpose, the measure should
1. Be net of endowments and initial attainments, reflective of pure advancement;
2. Avoid the cohort cross-section fallacy;
3. Be independent of shifts in age or duration composition of the immigrant population;
4. Avoid bias from age at arrival effects; 5. Avoid bias from age effects;
6. Avoid bias from effects of time since arrival; and
7. Reflect the broadest possible range of immigrant experiences, not just those of a “typical” age or arrival cohort.
In addition, the measure should be valid without modification for different outcomes.
5. Constructing a summary measure of immigrant advancement
The measure proposed here takes an approach that aggregates and temporally standardizes the estimates for cohorts at different stages of life and stages in the immigrant settlement process. It can be thought of as the hypothetical cumulative
lifetime advance of a new immigrant who advances at each stage at the same rates as
immigrants in a given period. What we term the Expected Lifetime Advancement (ELA) index will be recognized as similar in construction to the total fertility rate (TFR), which combines the age-specific birth rates of women of different ages during a particular period. This widely used measure provides a period snapshot that brings together discrete segments of current average life experience as if they were experienced over a single individual’s lifetime. Our measure of the pace of immigrant advancement is analogous in that it is a composite picture of the average experience of the entire population of immigrants during a specific span of time. The ELA index synthesizes and summarizes the advances of cohorts at different stages of their lives and careers in terms of the lifecycle experience of a hypothetical “representative” or average career.
The method is general. It builds on net changes in status outcome for birth-arrival cohorts during a specified interval, e.g., between the 1990 and 2000 censuses. These changes are calculated using a hazard function, i.e., as a proportion of those who had not attained the status at the start of the interval. For each age at arrival (AAR), starting with the youngest, most recent, cohort in the initial period (e.g., 1990) it sums the positive net status changes at successive ages. This sum is the expected lifetime advancement (ELA) for the given AAR. The final step is to take a weighted average of ELAs for the various AARs using the age distribution of recently arrived immigrants as weights. This weighted average is the mean ELA.
5.1 Discrete measured segments of change
The ELA summarizes the advances made by different birth-arrival cohorts between two censuses toward a particular threshold of attainment, e.g., language proficiency, homeownership, etc. For each census, there is an observation of the share of each birth-arrival cohort who have attained the threshold, such as proficiency in spoken English.11
11 For some variables, such as wages or income, advances might be measured by the value of a continuous
variable. Here, the cohort share measure is generated by a 0/1 transformation; i.e., is equal to one if a person has attained the threshold level of the variable, and is otherwise equal to zero. The dichotomous
yN dN aN
x
,
Cohorts are defined by a common year of birth, b, and year of arrival, or entry, e. As of any census year, the cohort’s age, aN, and time since migration, or duration, dN, are determined as aN = yN – b and dN = yN – e, and the attainment of the cohort as of yN is .12
The discrete segments of change are defined as follows. If the interval between censuses, y2 – y1, is ∆ (10 years in the U.S.), then for any birth-arrival cohort
1) a2 – a1 = d2 – d1 = ∆ .
A cohort’s advance between census years y1 and y2 is calculated as the difference in the cohort’s attainment between the censuses,
2) 1
1 , 1 2
1 , 1 2
1 ,
1 ay d ay d
y d
a x x
r +Δ +Δ= +Δ +Δ−
This is defined for all birth-arrival cohorts in y2 for which, in y1, d1>0 and a1>0. It must be noted that new immigrants are initially observed in the first census after they arrive, and that some degree of post-arrival advancement may occur between their arrival and this observation.
5.2 Constructing the synthetic lifetime sequence of change
By combining the observed advances for different cohorts, we obtain a synthetic estimate of the expected advance to any age A>(ai+∆). This measure describes a hypothetical cohort making the advances actually observed for cohorts at each age, from (ai+∆) to A, and the corresponding duration during the period y1 to y2. We first transform the absolute change in attainment (proportional per capita) into a hazard function, which expresses advances as relative to the population “at risk” of advancing; i.e., those who have not already attained the status,
2 y
A ai
l
→13
3) /(1 1 )
1 , 1 2
1 , 1 2
1 , 1
y d a y
d a y
d
a r x
p +Δ +Δ= +Δ +Δ −
12 By assumption the population described is of a specific origin, so no index of origin is used. 13 We also estimated ELAs using a linear probability functional form. There were problems with
The total advance is then calculated as the cumulative hazard of advancing, 4) ) 1 ( * ) 1 ( 1 ) 1 ( * ... * ) 1 ( * ) 1 ( * ) 1 ( 1 2 , / ) ( 1 1 0 , 1 2 , 2 2 , 2 2 , 1 0 , 1 2 y k k ai ai A to k y a y ai A A y ai y ai y a y A ai p x p p p x l Δ Δ + Δ − = − Δ Δ + Δ Δ + → − − − = − − − − − =
∏
It would be possible to calculate the lifecycle advance after arrival at age ai by picking a sufficiently advanced target age A. Due to the small numbers of older immigrants, even in large census (PUMS) samples, the small average advances observed at older ages and longer durations as well as the very approximate coding of pre-1950 years of arrival (in U.S. censuses before 2000), we have topcoded the life cycle at age 75 and the settlement process at 30 years after entry. The effect of this topcoding can be assumed to be negligible.
Some measures of lifetime advance reach their peak at the maximum age because they are irreversible in principle or in practice; e.g., citizenship, educational attainment, and language ability. These can only decline on average as the result of selective emigration, mortality, or, in the case of language ability, dementia. Other outcome variables typically decline after a lifecycle peak at a younger age; e.g., earnings and occupational status. Homeownership is an intermediate case; declines after a lifecycle peak are possible through “trading down,” but are in practice found to be uncommon. A measure of expected lifetime peak advance that treats these variable patterns on a uniform basis therefore seems to be a more meaningful measure than the expected attainment at a specified advanced age, which is potentially lower and incorporates declines as well as advances. The lifetime advance in the period y1-y2 after arrival at age ai is therefore defined as
5)
(
2)
75 2
2 2
2 max , ,..., y ai y ai ai y ai ai y
ai l l l
L = → +Δ → + Δ →
This age and duration standardized mean lifetime advance in the period y1-y2, 2
y L
yR ai
n
is calculated using as weights the number of immigrants that entered at each age ai in reference year yR, ,
6)
∑
∑
= =
÷ ∗ =
74
0 0 7
2 2
to
ai ai to
yR ai yR
ai y ai y
n n
L L
4
Because it combines immigrants of all ages at arrival—including those in Generation 1.5 who are at the critical age for language learning and those who enter as adults—this measure may be difficult to interpret for some outcomes.14 We therefore also consider the mean lifecycle expected advances for immigrants in two broad age groups separately, the mean lifecycle expected advance for Generation 1.5 immigrants,
7)
∑
∑
= =
< = ∗ ÷
14
0 0 1
2 2
15 to
ai ai to
yR ai yR
ai y ai y
n n
L L
4
and the mean lifecycle expected advance for adult immigrants,
7’)
∑
∑
= =
>= = ∗ ÷
74
15 15 74
2 2
15 to
ai ai to
yR ai yR
ai y ai
y L n n
L
It should be noted that the Expected Lifetime Advance (ELA) index differs from the total fertility rate because it is bounded above by 1.0. In this respect it more closely resembles the probability of first marriage, but even here the analogy is not exact because some attainments are reversible, e.g. homeownership.
An example of the base data and calculation of mean expected lifetime advances is shown in the appendix. As an aid for those wishing to better understand or apply the ELA, complete worked examples of the calculation of ELAs for one attainment can be found in an Excel workbook published with this paper.
14 Mean expected lifetime advances for different ages at arrival vary widely from the overall mean. There are
6. Outcome variables and data sources
6.1 Outcomes
We demonstrate the application of the proposed measure by calculating expected lifetime advances in two periods—from 1980 to 1990 and from 1990 to 2000—from the shares of the census population who have reached specified thresholds for the following outcome characteristics.
Fluency in spoken English (speak English only or speak it “very well”).
High school completion or GED equivalent.
College-level education (represented by 16 years or more of education, or a four-year college degree, such as a B.A.)
Higher occupational status is attained if a person is employed in a professional or managerial occupation. This characteristic was specifically selected because attaining this status requires a high level of education and/or training, or involves responsibility for personnel or equipment.15
Better earnings are attained if a person’s individual earnings for the previous
calendar year exceed the federal poverty standard for a family of four with two children. This summarizes in a single variable the combined effects of rates of labor force participation, wage rates, and hours worked.
Homeownership is attained if a person is either a householder or the spouse of
householder and lives in a household that owns its housing unit. It is a per capita measure, not directly comparable with a homeownership rate for households, and treats the two genders equally. This per capita definition summarizes household formation and tenure choice in a single variable.
U.S. citizenship is attained through naturalization and is calculated only for
individuals who are foreign-born of noncitizen parents.
Advances are calculated as 10-year decadal increases in the percentage of the population who attained the above thresholds.
These variables are grouped in broad domains of immigrant integration: English proficiency and education represent acculturation and acquisition of human capital;
15 Includes managers, professionals, supervisors in any field, sales proprietors, farm operators and managers,
earnings, occupation, and homeownership represent socioeconomic status; and citizenship represents civic incorporation. This list of variables covers a broad range but is not exhaustive; the measure can with equal validity be applied to other attainments.
ELAs are calculated here for immigrants in two large origin groups: those born in Mexico and those of Asian or Pacific Island race.16 These groups comprised 29.5% and 23.2% of the foreign-born population in 2000, respectively. The Asian-origin population is more heterogeneous than the Mexican-born population, and it would be possible to calculate expected lifetime advances for immigrants from specific Asian nations. However, our purpose here is to compare the advances of large segments of the immigrant population with known differences in status attainments.
6.2 Data
Advancement in each of the outcome areas is measured by the inter-census changes in average attainments of birth/arrival/origin cohorts in the 5% Public Use Microdata Samples (PUMS) of the long form (sample) questions in the censuses of 1980, 1990, and 2000. It must be noted that these are not true panel data, but are rather quasi-panel data, as individuals are not followed over time; they are instead compared over time by the use of independent random samples of individuals drawn from the same cohorts. The measured change in the mean attainment of a cohort of immigrants is equal to the mean change in the cohort’s attainment, and includes sampling variations and any changes in the cohort’s characteristics that might be caused by selective emigration, mortality, or changes in population coverage between censuses.
Cohort membership is determined by four characteristics: age, citizenship, year of entry, and country of birth. Of these, only year of entry seems potentially problematic due to the possibility of inconsistent responses in different censuses. In the 1980 and 1990 censuses, this item is from responses to a question asked of persons born in a foreign country: “When did [he] come to the United States to stay?” Potential responses to this question were in interval categories (e.g., 1975 to 1980, or before 1950). In the 2000 census, the question was revised, asking for an exact year of entry: “When did this person come to live in the United States?” Despite the slight changes in wording and response format, there is no evidence of inconsistencies in aggregate responses to this item between 1990 and 2000. A sample survey in which respondents to the 2000 census were re-interviewed (Singer and Ennis 2003) found a “low” degree of inconsistency for questions related to place of birth, citizenship, and year of entry, as well as to age. Out
16 This includes all persons of any Asian or Pacific Island race. The number of immigrants of more than one
of 58 items tested, 16 were in the favorable “low” category. This apparent stability of individual responses suggests that the questions provide reliable measures of the concept. Pitkin (2010) compared populations of exact year of entry cohorts in the 2000 census and the 2008 American Community Survey, with controls for net emigration, and found negligible differences.
Even if the classifying variables are measured consistently in different censuses, however, changes in cohort populations due to emigration or mortality could potentially affect estimates of average advancement. If there are such effects, a net population measure that includes effects of selective migration may be preferable for the purposes of evaluating the aggregate effects of immigration. However, in order to gauge individual success, the analyst would prefer to have a measure of average individual advancement. Stevens (1994), Borjas (1995), and others have speculated that emigration is sufficiently selective to bias population-based estimates of changes in attainment. Lubotsky (2007) found indications of such an effect in retrospectively matched data on earnings. However Lubotsky’s inference of highly selective emigration rates and upward bias in quasi-panel estimates of earnings growth was weakened by the very low match rates and limited controls for immigrants’ origin in his study. However, Myers (2004) reviewed data on levels of educational attainment of four recently arrived cohorts and found that they were nearly stable across three recent censuses; the lone exception was an increase in college completion among cohorts in their twenties. These findings are plausible. In sum, the evidence of biases in quasipanel measures of immigrant advancement between 1980 and 2000 is mixed. If biases do exist, it can be assumed that they are not large.17
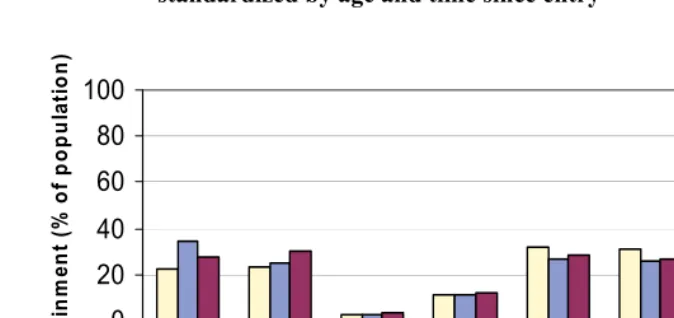
Descriptive data on the shares of the adult population ages 15-74 who currently reach the seven threshold levels of attainment are shown in Figure 1 for the Mexican-born population. The levels of attainment, standardized by age and time since entry to the U.S., range from 2.5% for B.A. education in 1980, to 34.6% for English fluency in 1990.18 The standardized levels of attainment for the foreign-born Asian population are higher (Figure 2).
17 Myers (2004) noted that immigrants who have lived in the U.S. for less than five years are most vulnerable
to selective emigration bias because of their high rates of mobility.
18 The effect of standardization to the 1990 age-duration distribution is to raise most 2000 attainments above
Figure 1: Current attainments of immigrants, ages 15-74, born in Mexico, standardized by age and time since entry
0 20 40 60 80 100
Eng lish F
luent
Educ ation:
HS+
Edu cation:
BA+
Occupat ion
Earn ings >
Pov
Hom eown
ership Citiz
enship
A
tt
ai
n
m
ent
(
%
of
p
opul
at
ion)
1980 1990 2000
Figure 2: Current attainments, ages 15-74, foreign-born Asians, standardized by age and time since entry
0 20 40 60 80 100
Eng lish F
luent
Edu cation: H
S+
Educ ation: B
A+
Occupati on
Earn ings
> P ov
Home owne
rship Citize
nship
C
ha
n
ge
in a
tt
ai
nm
ent
(
%
o
f pop
ul
at
ion)
7. Results
7.1 Initial and expected lifetime attainments
We now turn to the results of the summary measure of immigrant advancement. Mean initial and expected lifetime attainments for the Mexican-born population are shown in Figure 3 for 1980-1990 as empty and solid blue (lightly shaded) circles, and for 1990-2000 as empty and solid brown (darker) circles. Initial attainments in high school education and earnings are somewhat higher in the later decade, but in other areas they are similar in the two decades. By contrast, the lifetime attainments in four domains— high school education, earnings, homeownership, and citizenship—are substantially higher for the later than for the earlier decade, and are slightly higher in two others, B.A. education and occupation. By sharp contrast, the expected lifetime attainment for English fluency is substantially lower in 1990-2000 than in 1980-1990.
7.2 Expected advances
Figure 3: Initial and lifetime attainments, 1980-1990 and 1990-2000, immigrants age 15-74 and born in Mexico
0 10 20 30 40 50 60 70 80 90 100 Engl ish Fl
uent
Educ ation
: HS+
Educat ion: BA+ Occu pation Earni ngs >
Pov Home owne rship Citize nshi p A tt ain m en t ( p er ce n t o f c o h o rt p o p u la tio n )
1980-90 Lifetime attainment^ 1990, <5 years in U.S. 1990-2000 Lifetime attainment^ 2000, <5 years in U.S.
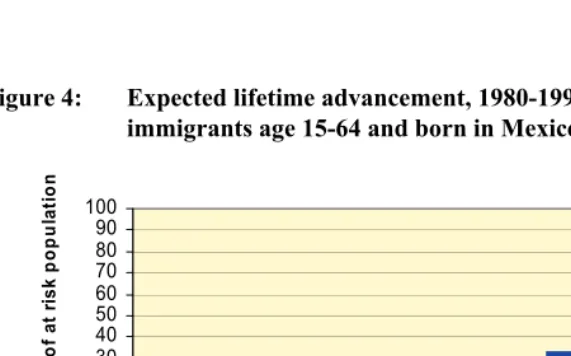
Figure 4: Expected lifetime advancement, 1980-1990 and 1990-2000, immigrants age 15-64 and born in Mexico
0 10 20 30 40 50 60 70 80 90 100 Engl ish F
luen t
Edu catio
n: HS +
Educ atio
n: B A+ Occu patio n Earn ings
> P ov Home owner ship Citiz enshi p L if et im e A d van ce % o f at r isk p o p u lat io n
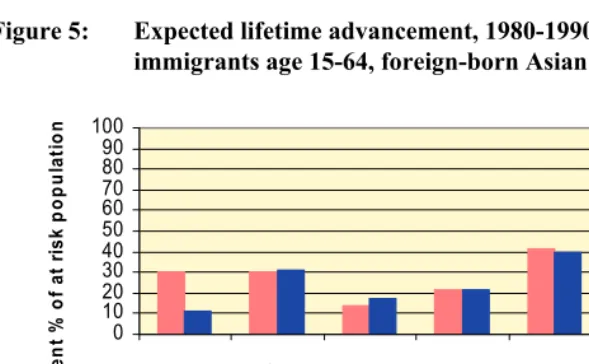
A quite different picture emerges for Asians. The rates of advancement were more similar in the two decades and even slightly slowed for homeownership19 (Figure 5). The only outcome for Asians for which advances were greater in the 1990s than the 1980s was citizenship. As for the Mexican-born population, expected lifetime increases in English proficiency were slower in the later decade.
Figure 5: Expected lifetime advancement, 1980-1990 and 1990-2000, immigrants age 15-64, foreign-born Asian
0 10 20 30 40 50 60 70 80 90 100
Engl ish Fl
uent
Edu catio
n: H S+
Educat ion: B
A+
Occu
patio n
Earni ngs >
Pov
Home
owne
rship Citiz
ensh ip
A
tt
ain
m
en
t %
o
f a
t r
is
k p
o
p
u
la
tio
n
1980-1990 lifetime advance^ 1990-2000 lifetime advance^
It is worth remembering that these advances are net of initial attainments observed after entry, and that these initial attainments have given Asians a large advantage over Mexicans. It also should be noted that the descriptive age- and duration-standardized current attainments shown in Figure 1 reveal some similar patterns for the Mexican-born—i.e., improvements over time in education and occupational status, as well as slower English language acquisition after 1990 than before—but reveal scant evidence of a post-1990 acceleration of advances in earnings, homeownership, and citizenship.20
19 Higher initial attainments in the 1990s may be due to shifts in the national origin of Asian immigrants, a
source of variability not present among Mexican-born immigrants.
20 The expected lifetime attainments are, of course, generally higher than current attainments because they
7.3 Comparisons and discussion
The lifecycle advances estimated in this paper improve on the age-standardized status measures shown in Figure 1. Although that measure is successful in correcting for some temporal biases, other factors are unaddressed, including the critical distinction between initial attainments and subsequent advances. Nor can the standardized measure of attainments detect differences between relatively fixed characteristics, such as educational attainment, and more fluid achievements, such as homeownership. In addition, the current status measure is unable to detect changes in the pace of advancement between decades. The proposed method offers a measure that is sensitive to changes in tempo.
The finding that advances by Mexican-born immigrants accelerated during the 1990s, though similar to the trend for native-born Hispanics, calls for an explanation. We think this outcome is not implausible for the following reasons. (1) Legalization through the provisions of the 1986 Immigration Reform and Control Act (IRCA) removed barriers to employment, financing, education, and mobility for two million immigrants from Mexico, but for only 0.13 million immigrants born in Asian countries.
(2) Geographic dispersion of immigrants from Mexico outside established gateway
states and metropolitan areas between 1990 and 2000 gave them greater access to higher paying and higher status jobs (Singer, Hardwick, and Brettell 2008). (3) General
labor market conditions between 1990 and 2000 raised incomes at the lower end of the
income distribution, including those of Mexican immigrants. During the 1990s, median constant dollar earnings of full-time male workers rose 5.3%, after falling 4.0% between 1980 and 1990.
The finding of a marked decline in English language acquisition at later stages of settlement after 1990 for both Mexican and Asian immigrants has not been previously reported, and seems anomalous. This trend is at odds with the acceleration in social and economic advances for Mexicans, as well as the stability of advances in other areas for Asians. However, the finding is robust: it is seen not only in the expected lifetime advance measure, but also in the age-standardized current attainments (Figure 1). Only the former measure, however, makes clear the extent of the slowdown, and the fact that it is due to slower advances following initial attainments observed after entry. Further investigation is needed to determine whether this slowdown is due to differences in data collection instruments, or whether it represents a true slowdown in the pace of English language acquisition; and, also, whether this trend has continued since 2000.
8. Conclusions
The summary measure of immigrant advancement proposed in this paper provides new answers to the question of how rapidly immigrants advance on average in different periods after arriving in a new country. We were led to develop this measure as a way to resolve inconsistencies in the empirical treatment of temporal effects. Although a wealth of empirical studies report measurements of immigrant status attainment in specific domains, it is difficult to compare their findings due to substantial variations in the treatment of temporal effects. These variations mainly spring from the temporal identification problems created by the functional interdependence of different temporal dimensions.
Immigration researchers must not only deal with the well-known age-cohort-period identification problem, but also with the parallel temporal identity between duration, entry cohort, and the age of immigrants. Parametric solutions to these problems all require omitting one or more temporal dimensions (by assumption), segmenting the population narrowly, or both. Furthermore, the challenges of interpreting and comparing results are compounded by the interconnection between the two cohort identities.
Other factors peculiar to immigration preclude the formulation of easy solutions to this problem and compound the difficulties of making comparisons across studies and over time. As a consequence of large fluctuations in the rate of immigration, the temporal composition of the foreign-born population is in constant flux, with marked changes in the distributions of ages, duration of U.S. residence, and age at arrival. As a result, misspecification or bias in measuring the effects of any of these variables is consequential.
There are also large differences in assumptions frequently made about the starting point and standard of comparison for measuring immigrants’ advances. For the purposes of measuring advancement, we argue for separating the advancements in status made by immigrants after entry from their initial status attainments, which are largely determined by the skills and other endowments they bring with them to the U.S. To address the identification problems in a consistent manner we have proposed a temporally standardized summary measure of the average pace of immigrant advancement. Our proposed Expected Lifetime Advancement (ELA) index is adjusted for current age, age at arrival, and length of residence in the U.S. It explicitly controls for compositional shifts in age and duration of immigrant residence that can distort aggregate measures of immigrant status advancement, and it separates the effects of initial attainments or endowments from subsequent advances.
method allows for a more accurate and comprehensive appreciation of the pace of the advancement of immigrants after their arrival in the U.S. than other measures can provide. Its potential usefulness is illustrated by calculations made here for immigrants from Mexico and Asia in the U.S. between 1980 and 2000. The finding that Mexican immigrants on average progressed more rapidly in the 1990s than in the 1980s is significant, and may have implications for immigration policy. However, the ELA does not eliminate the need for either longer term cohort studies of advancement trajectories across multiple decades, or multivariate parametric studies of the effects of temporal and other variables on the pace of immigrants’ progress. Rather, it should be viewed as a complement to such methods, and as another device in the analyst’s toolkit.
The analyst should understand that the ELA is not an all-purpose device and be aware of its limitations, which include the following:
• It is a summary measure which describes the average experience of a population in a particular period, not the experience of any individual, either in a given period or over a lifetime.
• It summarizes advancement for different arrival and birth cohorts in a particular period, and should not be used as a projection of future advancement without a comparison with advancement rates in other periods. The ELA is “expected” in a statistical sense, and is not a prediction of future average advances.
• It is sensitive to the assumed distribution of ages at arrival. When comparing periods with very different age-at-arrival distributions, a distribution that is representative of different periods should be employed.
• It does not reflect declines in reversible characteristics, such as homeownership and earnings. It is an expected lifetime peak advance. In periods in which there are substantial declines in a characteristic—e.g., homeownership in 2007-2010—another measure that allows for decreases might provide a better summary of average experience.
• The ELA can only be applied to the advances of the first immigrant generation and is not applicable to the second-generation children of immigrants who make greater gains than their parents’ generation in fields such as formal education and proficiency in English.
assimilation of the foreign-born or as a control group for measuring period-to-period variations in advancement due to contextual economic and other conditions.
• For continuous variables, the ELA is sensitive to the choice of threshold for defining status attainment. Different cut-offs may be appropriate when measuring the advances of immigrants of different origins.
Despite these limitations and with these caveats, the ELA offers a means of summarizing concisely a wide range of immigrant experience over a span of time, and with a minimum of temporal bias. The proof of its utility will be found in its application to other immigrant groups and other periods beyond those considered in this paper.
9. Acknowledgments
References
Alba, R.D. and Logan, J.R. (1991). Variations on Two Themes: Racial and Ethnic Patterns in the Attainment of Suburban Residence. Demography 28(3): 431-453.
doi:10.2307/2061466.
Alba, R.D. and Logan, J.R. (1992). Assimilation and Stratification in the Homeownership Patterns of Racial and Ethnic Groups. International Migration Review 26(4): 1314–1341. doi:10.2307/2546885.
Alba, R.D. and Nee, V. (2003). Remaking the American Mainstream: Assimilation and
Contemporary Immigration. Cambridge: Harvard University Press.
Bean, F.D. and Stevens, G. (2003). America’s Newcomers and the Dynamics of Diversity. New York: Russell Sage.
Borjas, G.J. (1985). Assimilation, Changes in Cohort Quality, and the Earnings of Immigrants. Journal of Labor Economics 3(4): 463-489.doi:10.1086/298065. Borjas, G.J. (1995). Assimilation and Changes in Cohort Quality Revisited: What
Happened to Immigrant Earnings in the 1980s? Journal of Labor Economics 13(2): 201-245.doi:10.1086/298373.
Borjas, G.J. and Friedberg, R.M. (2009). Recent Trends in the Earnings of New Immigrants to the United States. Cambridge: National Bureau of Economic Research (NBER Working Paper No. 15406).
Chiswick, B.R. (1978). The Effect of Americanization on Earnings of Foreign-Born Men. Journal of Political Economy 86(5): 897-921.doi:10.1086/260717.
Chiswick, B.R. (1991). Speaking, Reading, and Earnings Among Low-skilled Immigrants. Journal of Labor Economics 9: 149-170.doi:10.1086/298263. Duleep, H.O. and Regets, M.C. (1997). Measuring Immigrant Wage Growth Using
Matched CPS Files. Demography 34(2): 239-249.doi:10.2307/2061702.
Espenshade, T.J. and Fu, H. (1997). An analysis of English-language proficiency among U.S. immigrants. American Sociological Review 62(2): 288-305.
doi:10.2307/2657305.
Hakimzadeh, S. and Cohn, D’V. (2007). English usage among Hispanics in the United States. Washington, DC: Pew Hispanic Center (report).
Mainous, A.G. III, Diaz, V.A., and Geesey, M.E. (2008). Acculturation and Healthy Lifestyle Among Latinos With Diabetes. Annals of Family Medicine 6: 131-137.
doi:10.1370/afm.814.
Marin, G., Sabogal, F., Marin, B.V., Otero-Sabogal, R., and Pérez-Stable, E.J. (1987). Development of a short acculturation scale for Hispanics. Hispanic Journal of
Behavioral Sciences 9(2): 183-205.doi:10.1177/07399863870092005.
Myers, D. (2004). Accuracy of data collected by the census question on immigrants' year of arrival. Los Angeles: University of Southern California School of Policy, Planning, and Development (Working PaperPDRG04-01).
Myers, D. (2007). Immigrants and Boomers: Forging a New Social Contract for the
Future of America. New York: Russell Sage Foundation.
Myers, D. and Cranford, C.J. (1998). Temporal differentiation in the occupational mobility of immigrant and native-born Latina workers. American Sociological Review 63(1): 68-93.doi:10.2307/2657478.
Myers, D., Gao, X., and Emeka, A. (2009). The Gradient of Immigrant Age-at-Arrival Effects on Socioeconomic Outcomes in the U.S. International Migration Review 43(1): 205-229.doi:10.1111/j.1747-7379.2008.01153.x.
Myers, D. and Lee, S.W. (1996). Immigration cohorts and residential overcrowding in Southern California. Demography 33(1): 51-65.doi:10.2307/2061713.
Myers, D. and Lee, S.W. (1998). Immigrant trajectories into homeownership: a temporal analysis of residential assimilation. International Migration Review 32(3): 593-625.doi:10.2307/2547765.
Park, J.H. (1999). The earnings of immigrants in the United States: the effect of English-speaking ability. The American Journal of Economics and Sociology 58(1): 43-56.
Park, J.H. and Myers, D. (2010). Intergenerational Mobility in the Post-1965 Immigration Era: Estimates by an Immigrant Generation Cohort Method.
Demography 47(2): 369-392.doi:10.1353/dem.0.0105.
Pitkin, J. (2010). Consistency of Year of Entry Data in the 2000 Census and the 2006-2007 American Community Survey. Applied Demography: Population
Association of America Committee on Applied Demography Newsletter
23(1): 7-8.
Ramakrishnan, S.K. and Espenshade, T.J. (2001). Immigrant Incorporation and Political Participation in the United States. International Migration Review 35(3): 870-909.doi:10.1111/j.1747-7379.2001.tb00044.x.
Singer, A., Hardwick, S.W., and Brettell, C.B. (eds.). (2008). Twenty-First-Century
Gateways Immigrant Incorporation in Suburban America. Washington:
Brookings Institution Press.
Singer, P. and Ennis, S.R. (2003). Content reinterview survey: Accuracy of data for selected population and housing characteristics as measured by reinterview. Washington: U.S. Census Bureau (Census 2000 Evaluation Report No. B.5). Smith, J.P. and Edmonston, B. (1997). Chapter 1: The Immigration Debate. In: Smith,
J.P. and Edmonston, B. (eds.). The New Americans: Economic, Demographic,
and Fiscal Effects of Immigration. Washington: The National Academies Press:
14-19.
Sorensen, E. and Enchautegui, M.E. (1994). Immigrant Male Earnings in the 1980s: Divergent Patterns by Race and Ethnicity. In: Edmonston, B. and Passel, J.S. (eds.). Immigration and Ethnicity: The Integration of America’s Newest Arrivals. Washington: The Urban Institute Press: 139-162.
Stevens, G. (1994). Immigration, Emigration, Language Acquisition, and the English Language Proficiency of Immigrants in the United States. In: Edmonston, B. and Passel, J.S. (eds.). Immigration and Ethnicity: The Integration of America’s Newest Arrivals. Washington: The Urban Institute Press: 163-185.
Toussaint-Comeau, M. (2006). The Occupational Assimilation of Hispanic Immigrants in the U.S.: Evidence from Panel Data. International Migration Review 40(3): 506-536.doi:10.1111/j.1747-7379.2006.00034.x.
U.S. Census Bureau (1971). Census of Population and Housing, 1970 [United States]: Public Use Samples [electronic resource]. Washington: U.S. Census Bureau http://dx.doi.org/10.3886/ICPSR00018.
U.S. Census Bureau (1993a). Census of Population and Housing, 1990 [United States]: Public Use Microdata Sample: 5-Percent Sample [electronic resource]. Washington: U.S. Census Bureau. http://dx.doi.org/10.3886/ICPSR09952. U.S. Census Bureau. (2000). Long Form Questionnaire. Washington: U.S. Census
U.S. Census Bureau (2003). The relationship between the 1990 Census and Census 2000 industry and occupation classification systems. Washington: U.S. Census Bureau (Technical Paper 65).
U.S. Census Bureau (2003a). 2000 Census. 5-Percent Public Use Microdata Sample (PUMS) Files [electronic resource]. Washington: U.S. Census Bureau. http://www2.census.gov/census_2000/datasets/PUMS/FivePercent/.
Vigdor, J.L. (2008). Measuring Immigrant Assimilation in the United States. New York: Manhattan Institute (Civic Report 53).
White, M.J. and Glick, J.E. (2009). Achieving Anew: How New Immigrants Do in
American Schools, Jobs, and Neighborhoods. New York: Russell Sage.
Wong, J.S. (2000). The Effects of Age and Political Exposure on the Development of Party Identification Among Asian American and Latino Immigrants in the United States. Political Behavior 22(4): 341-371. doi:10.1023/A:
Appendix:
Mean Lifetime Expected Advancement, Sample Data and Calculation
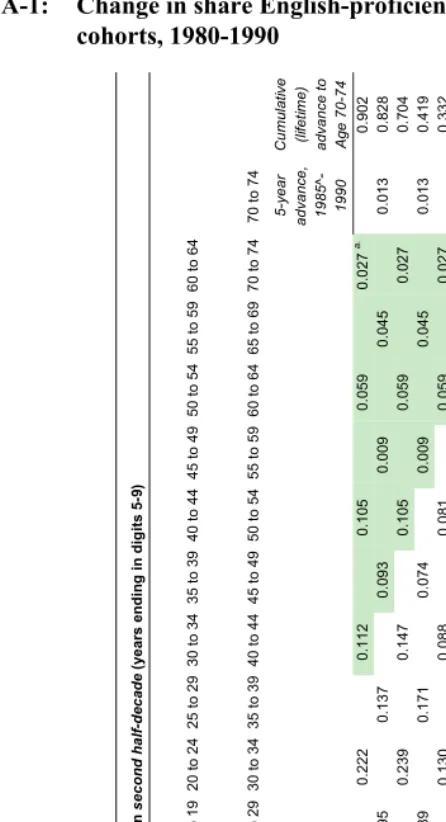
Examples of base data and calculation of Expected Lifetime Advancement (ELA) are shown in this appendix for one origin group, Mexican-born immigrants; and for one attainment, proficiency in English; between the censuses of 1980 and 1990.21 Input data and calculations of combined advances for cohorts at different ages at arrival are shown in Tables A-1 and A-2. These advances are compiled in Table A-3 and are in turn combined into ELAs in Table A-4.
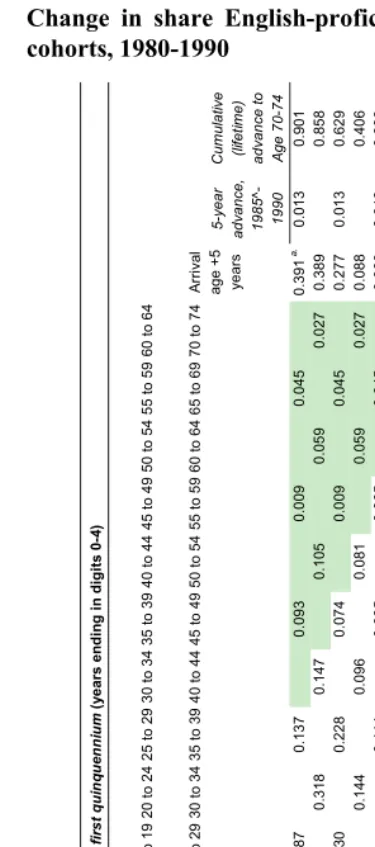
Table A-1 shows the 10-year advances for all those cohorts who arrived in the U.S. in years ending in digits five through nine; the “second half-decade” cohorts are arrayed by their ages at arrival (rows) and their ages in 1980 and 1990 (columns).22 The fifth row, for example, shows the advances made by cohorts who arrived at the modal age of arrival, 20-24. The first entry in the row (0.130) shows the 1980-1990 net increase in the share fluent in English for the cohort who were aged 20-24 in 1980, and who entered the U.S. between 1975 and 1979. The next entry (0.088) shows the increase in the share for the cohort who were aged 30-34 in 1980, and who entered the U.S. between 1965 and 1969. These increases are calculated as shares of the cohort who had not attained fluency in English at the start of the decade; i.e., as a hazard function transformation.
It should be noted that the final age of the cohort in each cell as of 1990 is the same as the initial age as of 1980 for the second cohort to the right. The lifetime maximum advance of a cohort from arrival at ages 20-24 to ages 70-74 can therefore be obtained as the cumulative increase in the “hazard” of speaking English fluently implied by the increases in this row, or 0.332, with each cell representing the proportional decline in fluency in a different 10-year age and duration of residence span. An additional calculation is required for those cohorts who arrived at ages ending in digits five through nine, such as at ages 15-19 (fourth row of the table), because the oldest final 10-year age for each chain is 65 to 69, and is therefore short of the final age for the other cohorts. To equalize the spans of experience for the two sets of cohorts, an estimated five-year advance from ages 65-69 to 70-74 (equal to one-half of the 10-year advance to ages 70-74 of the oldest cohort that arrived at the same age, shown in Table
21 Defined as speaking only English at home or speaking another language at home and speaking English
“very well.”
22 The assignment of ages at arrival is approximate, due to the use of interval codes for year of entry in
A-2) is included in the lifetime maximum advances for cohort chains that otherwise end at ages 65-69.
Since the census does not ask about the language ability of children younger than age five, the level of English fluency for the cohort in the first cell in Table A-1, at ages zero to four, is set to zero.23
The comparable advances made by cohorts who arrived in years ending in digits zero to four, the “first half-decade,” are shown in Table A-2.24 Since the first cohort in each row is first observed more than five years after arrival in the U.S., the cohort “chains” in this table are missing the first five years of advance that are included for the “second half-decade” arrival cohorts in Table A-1. (The initial age for the first cell in each row in Table A-1 is equal to the age at arrival; here it is five years older.) Therefore, in order to obtain advances from arrival to ages 70-74 on a consistent basis with the cohorts in Table A-1, five-year advances from arrival are estimated25 (in the third-to-last column in Table A-2), and are included in the total lifetime advance from arrival.
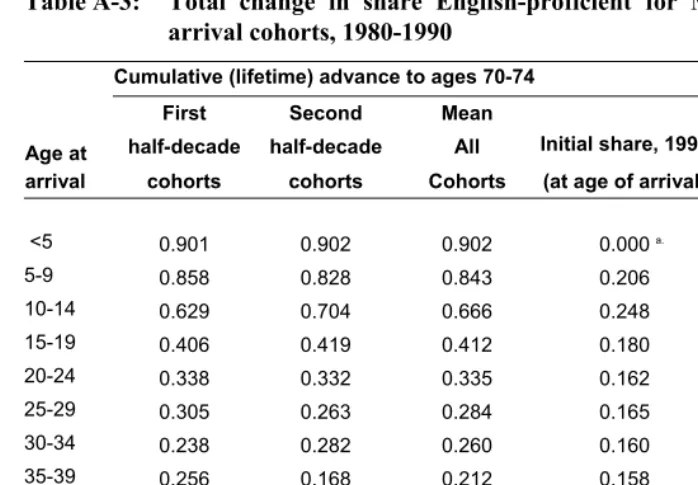
The lifetime advances to ages 70-74 are shown in the last column of Table A-2. The separate estimates for two chains of cohorts who arrived at each age (in Tables A-1 and A-2) are combined into a single mean estimate lifetime advance to ages 70-74, and are shown in Table A-3.
The populations of the cohorts that arrived in 1985-1989 (Table A-3, column 4) are then used as the basis for weighted, age-duration standardized means combining the total advances for different ages at arrival (Table A-4). The mean total expected advance for all ages of arrival is 0.356. In other words, if all immigrants from Mexico were to increase their proficiency in English during their lives at the same rate as the cohorts of Mexican-born immigrants who were the same age and had the same duration of residence in the U.S. did during the 1980s, then the fraction who speak English fluently would rise by 35.6% over their lifetime.
The mean lifetime expected advances for different ages at arrival vary widely from the overall mean, with particularly large differences found between cohorts arriving before and after the critical age for language learning. For this reason, we also calculate
23 This assumption is necessary if the advances of those immigrants who arrived before age five are to be
included in the analysis and overall summary measure of immigrant advances. Alternatively, cohorts who arrived before age five can be excluded from the analysis.
24 Comparison of Tables 2 and 3 will reveal that advances for some second half-decade arrival cohorts are
identical to first half-decade arrival cohorts at the next-lower age at arrival. These equalities are due to the coding of all years of arrival prior to 1960 in just two categories: 1950 to 1959 and before 1950 (shaded cells in Table 2 and 3) in censuses before 2000.
25 It is estimated as the difference between the end-of-decade attainment at the first observed age and the
in Table A-4 the mean expected advance for Mexican immigrants who arrive before age 15, or 0.698; and for those who arrive at older ages, or 0.253.
It is also of interest to compare these advances with the attainments of English fluency at the first post-entry census in 1990, a population-weighted mean of 0.161 for all ages at arrival combined (Table A-4 column 1). Since these new immigrants have been in the U.S. for a mean of approximately 2.5 years,26 and the rate of advance for most variables is most rapid immediately after arrival, this observed level of attainment includes a substantial but unmeasured degree of advancement in addition to the attainments as of the immigrants’ day of arrival. The mean lifetime expected advances plus the mean attainments at the first post-entry census give us a mean expected lifetime
attainment of 51.8% for Mexican-born immigrants of all ages at arrival. This can be
compared, for example, with the 29.3% of all Mexican immigrants who spoke fluent English as of the 1990 census.