Image Denoising by Non-Parametric Statistical Model of Wavelet
Coefficients
Anuradha Nayak
1Abhishek Verma
21
Student
2Assistant Professor
1,2Department of Electrical Engineering
1,2
Jabalpur Engineering College, Jabalpur, India - 482011
Abstract— Today, the transmission of information takes place mainly through digital images and videos, but the images obtained after transmission is often corrupted with noise. It is necessary to clean or denoise the received image for its further use. In this work a new image denoising algorithm by using a non-parametric statistical model of wavelet coefficient is presented. The proposed non-parametric statistical model is more suitable than conventional models to formulate the marginal distribution of wavelet coefficients, which exploits MAP estimation-based image denoising algorithm, which further exploits the proposed non-parametric model as the prior image model.
Key words: DWT, Wavelet Thresholding
I. INTRODUCTION
Images have become an important part of our life in this era. The use of computer algorithms to perform image processing on digital images is considered as digital image processing. The necessity of digital image processing stems from two principal application areas: the first being the
improvement of pictorial information for human
interpretation and the second being the processing of a scene data for an autonomous machine perception [2]. Digital images often get corrupted by noise during digitization or transmission. The various factors that corrupt the image by noise are acquisition of images with CCD camera, sensor temperatures & light levels that can affect the amount of noise in the resulting image. The presence of noise is unavoidable. It is necessary to remove the added noise from noisy image before using it further. Denoising of images is an important task in image processing and analysis, it plays a vital role in various applications including medical imaging and preprocessing for computer vision. The main objective of image denoising is to improve the visual quality of an image by reducing noise from it. Various image denoising techniques have been developed to minimize the effect of noise from the digital image. A method based on wavelet transformation has been used widely. Wavelet transform provides scale based decomposition. Most of the noise tends to represented by wavelet coefficients at the finer scale. It gives better result than FFT [3].
Wavelet denoising methods include shielding denoising method, wavelet shrinkage method etc. Wavelet shrinkage method is widely used due to characteristics of simple operation and excellent effect [1]. The method was proposed by Prof. Donoho D.L. and Johnstone from Stanford university in 1992 [4]. Later, soft threshold, Stein unbiased risk estimate (SURE) threshold, Bayes threshold denoising method etc. were introduced in order to get optimized result in denoising.
II. WAVELET DOMAIN IMAGE DENOISING
Wavelet transform is a powerful tool in image processing, and a series of algorithms are proposed for image denoising based on it [10]. There are various techniques for image denoising which are using wavelet. The advantage of using such estimation approaches is provided by algorithm of fast implementation. To remove noise without excessive smoothing of important details, a denoising algorithm to be spatially adaptive. The wavelet representation, due to its sparsity, edge detection and multire solution properties, naturally facilitates such spatially adaptive noise filtering [5]. Wavelet domain can be sub categorized into linear and nonlinear techniques.
III. DISCRETE WAVELET TRANSFORM
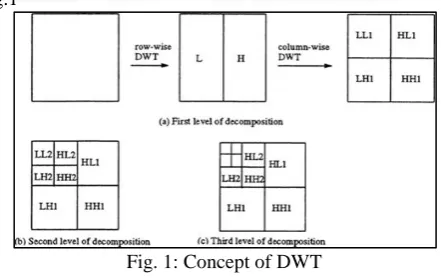
[image:1.595.316.537.461.600.2]A discrete wavelet transform is any wavelet transform for which the wavelets are discretely sampled. DWT implementation is easy & it reduces the required computation time & resources. In DWT, the image is divided or decomposed into four sub bands and critically sub sampled. It separates an image into a lower resolution approximation image (LL) as well as horizontal (HL), vertical (LH), and diagonal (HH), detail components [6]. These four sub bands arise from separable applications of vertical and horizontal filters. The concept is shown by a fig.1
Fig. 1: Concept of DWT
IV. WAVELET THRESHOLDING
Wavelet Thresholding is a signal estimation technique that exploits the capability of wavelet transform for signal denoising [7]. This technique operates in the orthogonal wavelet domain, wherever each coefficient is thresholded by comparing against a threshold; if the coefficient is smaller than the threshold it is set to zero, otherwise, it is reserved or modified [5]. Thresholding can be categorized as:
A. Hard Thresholding
Hard thresholding sets to zero any element whose absolute values is lower than the threshold.
TH= {x,
|x| ≥ t
B. Soft Thresholding
Soft thresholding extends hard thresholding by shrinking the magnitude of the remaining coefficients by, producing a smooth rather than abrupt transition to zero.
Ts= {sign (x)(|x| − t),
|x| > t
0, otherwise (4.2) In general, it is observed that the soft thresholding is much better than hard thresholding and yields more visually pleasant images. This is because the hard thresholding is discontinuous and yields abrupt artifacts in the recovered images.
The techniques of thresholding are mentioned as: 1) Visu-Shrink:
Visu-Shrink is also called as Universal threshold. For denoising applications, Visu-Shrink is found to yield a highly smoothed estimate. This is because the universal threshold is derived under the constraint that with high probability, the estimate should be at least as smooth as the signal [8]. The Visushrink threshold is evaluated by the following expression:
𝑡 = 𝜎√2 log 𝑀 (4.3)
Where M is the number of pixels in the image and 𝜎 is the variance.
However, since this thresholding technique “kills” the greatest number of coefficients, it also may mistakenly eliminate the most signal. Therefore, Universal threshold involves the greatest risk of loss of the signal containing coefficients.
2) Sure Shrink
A threshold chooser based on Stein’s Unbiased Risk Estimator (SURE) was proposed by Donoho and Johnstone and is called as Sure Shrink. This method specifies a threshold value tj for each resolution level j in the wavelet transform which is referred to as level dependent thresholding [11]. By applying SURE over a range of threshold, the minimum risk is determined. The Sureshrink threshold is defined as:
t∗= min(t, σ√2logM) (4.4) Where, t represent the value that minimizes Stein’s Unbiased Risk Estimator, 𝜎 is the noise variance.
3) Bayes Shrink:
Bayes shrink is an adaptive data driven threshold for image denoising via wavelet soft threshold. The threshold is driven in a Bayesian frame work and its assumed Generalized Gaussian distribution (GGD) for the wavelet coefficient in each detail sub band and try to find the threshold T minimizes the Bayesian Risk [9]. The Bayes threshold is defined as:
tB= σ2
σs2 (4.5)
Where, 𝜎² is the noise variance and 𝜎s is the signal variance without any noise. It performs better than Visu Shrink.
V. PERFORMANCE PARAMETERS
A. Mean Squared Error (MSE)
Mean Squared Error (MSE) is one of the earliest tests that were performed to test if two pictures are similar. A function could be simply written according to equation given as:
M. S. E. =1
n ∑(Xi− Xi ∗)2 n
i=1
(5.1)
B. Peak Signal to Noise Ratio (PSNR)
Peak Signal to Noise Ratio (PSNR) is a better test since it takes the signal strength into consideration (not only the error). PSNR is used for measurement or the check of quality of the reconstruction of an image or frames of video. The inputs used for comparison here is the unprocessed data, and the reconstructed data after extraction process. PSNR is basically a general approximation to the human perception of reconstructed data quality. PSNR is generally defined in terms of the MSE. The expression can be given as:
PSNR = 10log10(MAXl 2
MSE) (5.2)
Here,𝑀𝐴𝑋𝑙 is the maximum possible image pixel value. In case of when the pixels are represented using 8 bits / sample, 𝑀𝐴𝑋𝑙 is taken equal to 255.
C. SSIM (Structural Similarity)
The main problem about the MSE & PSNR is that they are not similar to what similarity means to human visual system (HVS). The Structural Similarity Index (SSIM) quality assessment index is based on the computation of three terms, namely the luminance term, the contrast term and the structural term. The overall index is a multiplicative combination of the three terms.
SSIM = (2μxμy+ c1)(2σxy+ c2) (μx2+ μy2+ c1)(σx2+ σy2+ c2)
(5.3)
Where 𝜇𝑥is the average of x, 𝜇𝑦is the average of y, 𝜎𝑥, 𝜎𝑦are the standard deviation, 𝜎𝑥𝑦 is the cross-covariance for images x, y, and & c1, c2 are two variables to stabilize the division with weak denominator.
D. Mean Absolute Error (MAE)
The Mean Absolute Error (MAE) is a quantitative parameter used to measure how close forecasts or predictions are to the eventual outcomes. The mean absolute error is given by:
MAE =1
n∑|fd− f| = 1 n n i=1 ∑|ei| n i=1 (5.4)
As the name suggests, the mean absolute error is an average of the absolute error|𝑒𝑖| = |𝑓𝑑− 𝑓| , where 𝑓𝑑 is the prediction and 𝑓 the true value.
VI. PROPOSED ALGORITHM
Image denoising is an important topic in the field of image processing where the main objective is to improve the visual quality of an image by reducing noise from it. Numerous image denoising techniques have been developed to minimize the effect of noise occurred due to various noise sources. The main aim is to preserve the image details & local geometries while removing the undesirable noise.
exploits the proposed non-parametric model as the prior image model. A statistical approach is exploited in this work to perform image denoising. The performance of the proposed model is compared with an image denoising algorithm [1].
A. Steps of Proposed Algorithm
1) Read the input image.
2) If color image is chosen as input, convert it into gray scale. Since color image is having 3 different levels from 0-255 for each R, G, & B colors, the algorithm becomes more complex. Color to Gray scale conversion of image for making image gray scale pixel value range from 0 to 255.
3) Resize input image to speed up the computation. 4) Read other parameters like wavelet type, noise level. 5) Add Gaussian noise in dB of desired noise level. 6) Perform N-Level DWT decompositions and by using
different Wavelet types. For better results perform more level decompositions. In our work we have done 5-level decomposition, after this improvement is very less. 7) Estimate the noise value by using Kernel Density
Estimator (KDE), which is a modified version of Bayesian Rule MAP Estimator.
8) Repeat step 7 for given number of wavelet
decompositions.
9) Perform IDWT and select noise free image from LH, HL & HH components.
10) Denoised Image Reconstruction & Calculation of SSIM & PSNR.
VII. IMPLEMENTATION AND COMPARISON
A. Flow Chart
Fig. 2: Detailed flow chart of proposed algorithm
B. Comparison Table
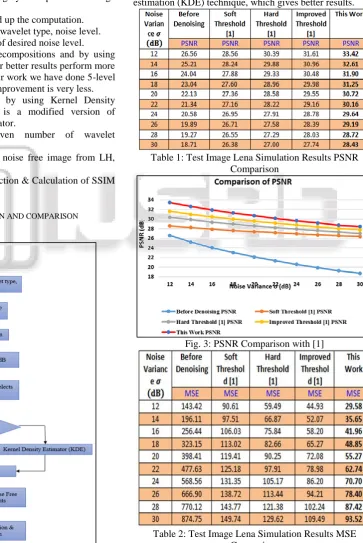
A comparison of this proposed image denoising method by non-parametric statistical model of wavelet coefficients with the base paper [1] is mentioned in the table 1 and table 2 respectively. The proposed non-parametric statistical model is more suitable than conventional models to formulate the marginal distribution of wavelet coefficients, which exploits MAP estimation-based image denoising algorithm, which exploits the proposed non-parametric model as the prior image model. In the base work authors tried modifications in this work we have focused on denoising of wavelet coefficients at the decomposition levels using kernel density estimation (KDE) technique, which gives better results.
Table 1: Test Image Lena Simulation Results PSNR Comparison
[image:3.595.173.537.212.756.2]Fig. 3: PSNR Comparison with [1]
Fig. 4: MSE Comparison with [1]
VIII. SIMULATION RESULTS
For the simulation the proposed algorithm is implemented using MATLAB. It shows Lena image with mean and variances. Another image is also shown with after added Gaussian noise with MSE and PSNR in the results. Results show the denoised image of Lena with improved MSE and PSNR.
In simulation we have done the simulations with two different wavelets ‘Haar’ and ‘Symlet’, using non-parametric statistical model of wavelet coefficients.
Fig. 5(a): Original Lena Image
Fig. 5(b): Noisy Lena Image with 𝜎 =5 dB
[image:4.595.307.549.69.228.2]Fig. 5(c): Denoised Lena Image by proposed method Fig. 5(a), 5(b), 5(c).Denoising Effect Comparison
Table 3: Test Image Lena Simulation Results
IX. CONCLUSION
In this thesis, investigation of several well-known algorithms for image denoising is carried out & their performance with their methodologies have examined. A new algorithm based on the Haar & Symlet wavelet using non-parametric statistical model of wavelet coefficients is developed. This shows better performance in comparison with the other existing algorithm. However, AWGN or Gaussian noise was considered in this work. The image is contaminated with AWGN is denoised using non-parametric statistical wavelet coefficients model. Effects of different wavelet bases on the denoising performance were examined. Since the evolve wavelets are better for image denoising, because of their sparseness, energy compactness, & correlation properties. In this work 5-level wavelet decomposition has been implemented & thresholding is applied to these levels, which is the uniqueness of this work. Also to estimate the noise at these decomposition levels two different estimators MAP & KDE are used simultaneously. MATLAB simulations show better PSNR performance upto 2 dB & MSE is half compared to algorithms of similar complexity given in [1]. Visual analysis also shows promising results.
X. FUTURE SCOPE
In the future, work can be done to provide more effective solutions for the identified problems. In addition, the presented image denoising techniques can be tested on other gray scale image datasets for further establishing their efficacy. Also the work can be extended to denoising of color images as well as video sequences.
[image:4.595.50.292.402.749.2]these limitations is given by the use of Complex Wavelet Transforms (CWT). These variants of wavelet transforms can be used for future enhancement of denoising techniques.
REFERENCES
[1] Liqiang Shi,”An improved image denosing algorithm,” Seventh IEEE International Conference on Measuring Technology and Mechatronics Automation, 2015 [2] Kumar and F. Shaik, Image processing in diabetic
related causes, Forensic and medical bioinformatics, 2016
[3] S.Y. Pattar, “Image denoising techniques using wavelet,” IJIRSET vol.2, Issue 12, December 2013 [4] David L. Donoho and Iain M. Johnstone, “Minimax
estimation via wavelet shrinkage,” The Annual of statistics, vol.26, No.3, 879-921, 1998
[5] Vinita Arun Chaudhari, Prof. Shrikant Lade,”A review on image denoising techniques using wavelet transform methods,” IJRDET, vol.3, Issue 4, October 2014 [6] Yuhui Li, Wei Gou and Bo Li,”A new digital
watermark algorithm based on the DWT and SVD,” IEEE 10th International symposium on distributed computing and application to business, engineering and science, 2011
[7] Miss Pallavi Charde,”A review on image denoising using wavelet transform and median filter over AWGN channel,” IJTEEE, vol.1, Issue 4, 2013
[8] Rajesh Kumar Rai, Jyoti Asnani, T.R. Sontakke, “Review of Shrinkage techniques for image denoising,” IJCA, vol.42, No.19, March 2012
[9] Rajesh Kumar Rai, Trimbak R. Sontakke,
“Implementation of image denoising using
Thresholding techniques,” IJCTEE, vol.1, Issue 2
[10]LIU Qian, YANG Xing-qiang, LI Yun-liang,
“Literature review of image denoising methods,” Computer Aided Drafting, Design and Manufacturing vol. 24, No.1, pp. 18, March 2014
![Fig. 4: MSE Comparison with [1]](https://thumb-us.123doks.com/thumbv2/123dok_us/462274.1045750/4.595.50.285.65.274/fig-mse-comparison-with.webp)
