Satellite Image Fusion Technique using Integration of
IHS Transform and Contrast based Wavelet Packet
s
G. Dheepa
Ph.D Scholar,
Department of Computer Science,
Erode Arts and Science College, Erode, Tamilnadu, India
S.Sukumaran,
Ph.D. Associate Professor, Department of Computer Science,Erode Arts and Science College, Erode, Tamilnadu, India
ABSTRACT
The development of new imaging methods in various fields arise the need of meaningful combination of all available image datasets. Image fusion is the process of integrating complementary information from multiple image sensor data to create a fused image output. The new image generated should contain a more accurate description of the scene than any of the individual source images and is more suitable for human visual and machine perception or further image processing and analysis tasks. This technique is used in satellite remote sensor images to fuse high resolution panchromatic (PAN) image with the low resolution multispectral (MS) image to form a single high resolution multispectral image. Among the existing fusion techniques, wavelet based methods have proved to produce improved results. This paper proposes a novel method to fuse PAN image and MS image by integrating Contrast based Discrete Wavelet Packet Transform (DWPT) and Intensity Hue Saturation (IHS) technique. Firstly, the advantages of using DWPT over DWT are given in brief. Then the proposed algorithm is explained. Finally, its performance is evaluated using various quality assessment metrics which shows that the proposed method is superior to the other existing methods.
Keywords
Image fusion, Remote sensing, Wavelet Packet Transform, IHS Transform.
1.
INTRODUCTION
Satellite images play a major role in GIS to provide up-to-date and reliable information on Earth’s resources. Most earth resource satellites such as SPOT, IRS, Landsat 7, IKONOS, QuickBird, etc... collect a high spatial resolution PAN image and multiple MS images with significant low spatial resolution. Many remote sensing applications require images with both high-spatial and high spectral resolutions, especially for GIS based applications since high spectral resolution aids in identification of objects more distinctly while high spatial resolution allows locating the objects more clearly. Image fusion is a technique used to integrate the geometric detail of a high-resolution PAN image and the color information of a low-resolution MS image to produce a high-resolution MS image [1]. Applications for integrated image datasets include earth resources inventorying, urban mapping and monitoring and environmental / agriculture assessment, and change detection [2].
Some preprocessing steps are to be carried out before fusing the images. Due to the different sensor viewpoints, there might exist some miscorrespondence between several points of the observed scene. Therefore image registration is done before fusing the images. It is the process of establishing point-by-point correspondence between a number of images, describing the same scene. Also the PAN image has a
different spatial resolution from that of MS images. Therefore, resampling of MS images to the spatial resolution of PAN is another essential step to bring the MS images to the same size of PAN.
In the recent years, many fusion methods such as (IHS) transform, High-Pass Filtering (HPF) method, Laplacian pyramid [3] and wavelet transform, etc... have been proposed. The IHS transform is the most commonly used fusion technique because it can effectively separate a standard RGB (Red, Green, Blue) image into spatial (I) and spectral (H, S) information. But in a stand-alone IHS fusion method the color quality of the fused image strongly depends on the resemblance between the high spatial resolution image (PAN) and the intensity image (I) of the low spatial resolution MS image. If the grey value distribution of the IHS intensity image is close enough to that of the panchromatic image, the IHS fusion method can well preserve the color information [4].If there is much difference it will cause a substantial color distortion.
Among the existing methods, wavelet transform based methods are found to give better results. The advantage of wavelet transform is that it can provide efficient localization in both space and frequency domains. The wavelet transform comes in many forms. The most common of them is Discrete Wavelet Transform (DWT). Stephane Mallat proposed the filter–bank implementation scheme of DWT [5]. DWT method decomposes only low frequency band in a higher scale, the high frequency bands are not taken into account, so that it omits some useful details of the images.
On the other hand, wavelet packets, which are extension of wavelets, besides decomposing low frequency band in a higher scale, it also decomposes high frequency band in higher scale. Therefore, the wavelet packet transform can obtain more detail information in time-frequency domains compared with wavelet transform. So it is apt to fuse satellite remote sensor images. Pu et al. [6] suggested a contrast based image fusion method used in the wavelet domain. After decomposition, directive contrast is computed for all decomposed images to fuse them. The concept of directive contrast can be extended for WPT domain.
2.
WAVELET PACKET TRANSFORM
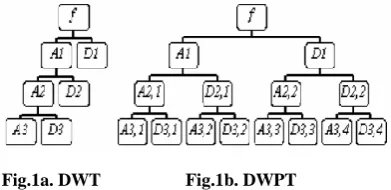
Discrete Wavelet Packet transform (DWPT) which is an extension of DWT, besides decomposing approximate subimage, also decomposes every detail subimage in a higher scale [7]. The difference between DWT and DWPT is shown in Figure 1a, Figure 1b.
Fig.1a. DWT Fig.1b. DWPT
[image:2.595.69.265.135.230.2]Wavelet packet decomposition divides the frequency space into various parts and allows better frequency localization of signals. Additionally, it can adaptively choose corresponding bands according to the features of the analyzed signals to match the signals spectrums in order to increase the time-frequency resolution ratios. The structure of 2-level DWPT is shown in Figure 2.
Fig 2. 2-D Discrete wavelet packet transforms
Every detail subimage can come into being four new sub-images through transform, and the new subimage’s size is a quarter of former subimage. The structure of subimages through gradual levels transform is like a four-branch tree.The wavelet decomposition algorithm is:
k L L n L n k k L L n L n kg
d
d
h
d
d
2 1 2 2 22
1
2
1
The wavelet packet re-construction algorithm is:
L k L n L L k L n L n
k
d
h
d
h
d
2 2
2 2where hk , gk are orthogonal conjugate filter coefficients.
2.2 Directive contrast
According to Human Visual System (HVS) the local luminance contrast of images is defined as [8]:
B H B B L L L L L
C
where L and LB represent the local luminance and the
luminance of the local background. Generally, LB is regarded
as local low frequency and hence, L−LB=LH is treated as local
high frequency. A modified sequence of directive contrast for WPT is defined .The Horizontal contrast ( H
i
C ), Vertical contrast ( V
i
C ) and Diagonal contrast (CiD) are defines as:
AHV D
l i A D C A V C A H C l i D i l i V i l i H i , , , , 1 , , , The 2 level DWPT of an image is shown in Figure 3 in which the bolded block A2 is the low frequency part for finding directive contrast.
A2 H2,H H1,A H1,H
V2,V D2,D H1,V H1,D
V1,A V1,H D1,A D1,H
[image:2.595.363.492.187.284.2]V1,V V1,D D1,V D1,D
Fig. 3. 2 level DWPT of an image
3.
PROPOSED FUSION ALGORITHM
USING INTEGRATION OF DWPT AND
IHS TRANSFORM
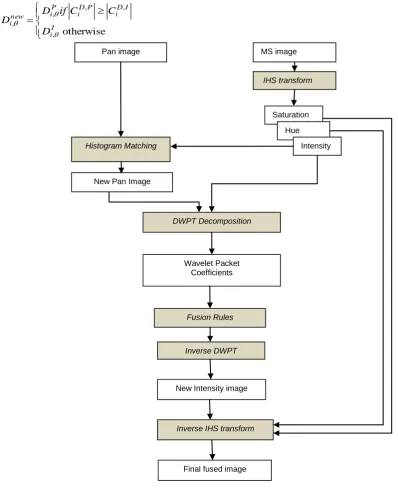
Though wavelet based fusion method can well retain the color information, the spatial detail from a PAN is often different from that of a MS band having the same spatial resolution because of their spectral range difference which introduces some color distortion into the fusion results. Hence, to overcome the limitations and utilize the merits of both methods, we integrate IHS and DWPT technique to form a new fusion method. The flow scheme of the proposed method is given in Figure 4.
As a preprocessing step, both the PAN and MS images are registered geometrically so that both have the same size. The fusion algorithm is given as follows:
1. Using IHS transform, the MS image is transformed into IHS components.
2. The PAN image is histogram matched to that of the Intensity image (I) to get a new PAN
3. The new PAN image and Intensity image (I) are l-level decomposed using DWPT.
4. For each frequency the sequence of directive contrast is found. The directive contrast for PAN and Intensity image is denoted as Cl,P,Cl,I
where
A
,
H
,
V
,
D
and l is the decomposition level. [image:2.595.63.270.320.389.2]otherwise
,
, ,
, ,
I i
I D i P D i P i new i
D
C C
if D D
[image:3.595.91.490.75.566.2]
Fig. 4. Flow scheme of proposed IHS –DWPT fusion method
where 1il,
A
,
H
,
V
,
D
andHinew, , newi
V, , Dinew, are the new horizontal, vertical and diagonal components of the fused image.
6. For the fusion of low frequency (approximate part) we use median instead of averaging.
) , ( lP lI new
l A A
A median
7. Perform inverse discrete wavelet packet transform (IDWPT) to construct fused new Intensity image which has the spatial detail of PAN image and has a high correlation (similar grey value distribution) with the Intensity (I) image of IHS transform.
8. Using inverse IHS transform, the new intensity together with hue and saturation components are transformed back to RGB space to get the final fused image.
4.
EXPERIMENTAL RESULTS
In order to verify the validity of the algorithm, this paper selects the Quickbird satellite imagery as experiment data. The spatial resolution of original panchromatic Quickbird image is 0.7m while the spatial resolution of multispectral image is 2.8m. After matching, the two images have 0.7m spatial resolution in which the MS images have 4 wave bands information- Red, Green, Blue and Near Infrared bands. To completely utilize the available wave bands information, and match the wavelength range of the participating in fusion band4, Band3 and band1 was for R, G, B, respectively. The
Histogram Matching
Wavelet Packet Coefficients Pan image
New Pan Image
MS image
IHS transform
Saturation
Hue
Intensity
DWPT Decomposition
Fusion Rules
Inverse DWPT
New Intensity image
Inverse IHS transform
IHS transform, wavelet transform and wavelet packet transform was performed by using the Matlab software.The decomposition level is fixed to 2.The re-sampled and the registered panchromatic image and multispectral image of the same area were presented in Figure 5 and Figure 6
[image:4.595.347.503.123.264.2]respectively. The resampled multispectral and Pan bands are then fused using IHS transform, DWT and the proposed IHS-DWPT algorithm. The corresponding fusion results are shown in Figure 7a, Figure 7b and Figure7c.
[image:4.595.97.238.127.248.2]Fig.5 Original Panchromatic Image
Fig.6 Resampled MS Image
Fig. 7a. IHS fusion result
Fig. 7b. DWT fusion result
Fig. 7c. Proposed IHS-DWPT fusion result
5. RESULT ANALYSIS
By observing the results visually; the IHS method enhances the detail information of the image, but the image distortion degree is larger because IHS transform directly substitutes the high-resolution PAN image for I component of the MS image, then reverse IHS is used to get fused image . The DWT method enhances the spatial information and color information when compared to IHS, but still a little color distortion exits which is apparently visible. The proposed IHS-DWPT fusion method integrates the spatial information of the PAN and spectral informationof the MS image into a single fused image very well.The colors in the fusion result look close to that of the original MS images, and spatial details as detailed as the original PAN image. It well preserves both the spatial and original spectral content. In order to quantitatively evaluate the performance of each fusion method, a statistical comparison is done. Mathematical methods were used to judge the quality of fused image in respect to their improvement of spatial resolution while preserving the spectral content of the data. The correlation coefficient is most widely used similarity metric. Another commonly used assessment metric is the Root Mean Square Error (RMSE). Multimodal statistical indices such as UIQI and ERGAS have also been calculated to compare the fusion results.
Correlation Coefficient (CC)
The correlation coefficient measures the closeness or similarity in small size structures between the original and the fused images. It ranges from -1 to +1.Values close to +1 indicates that they are highly similar while the values close to -1 indicate that they are highly dissimilar.
N
i N
j
N
i N
j j i j
i N
i N
j
j i j
i
F F S
M MS
F F S M MS CC
1 1 1 1
2 , 2
, 1 1
, ,
) ( ) (
) )(
(
where CC is the Correlation Coefficient, F is the fused image and i and j are pixels, MS is the multispectral data
Root mean square error (RMSE)
The RMSE was computed from the standard deviation and the mean of the fused and the original image.
2
2F MS F
MS
M
M
[image:4.595.95.240.286.400.2] [image:4.595.339.516.611.662.2]where
MS is standard deviation of multispectral image,F
is standard deviation of fused image; MSM equals to mean value of multispectral image, and
M
F equals to mean value of multispectral image. The best possible value is zero. ERGAS
ERGAS is the abbreviation of Erreur Relative Globale Adimensionnelle de Synthèse (Relative global dimensional error).It calculates the amount of spectral distortion and the formula is given by:
N
i i
i
M B RMSE N
l h ERGAS
1
2 2
) (
) ( 1
100
where N is the number of bands involved in fusion, h/l is the ratio of the spatial resolution of original Pan and MS images. Miis the mean value for the original spectral image Bi.
ERGAS values larger than 3 stands for synthesized images of low quality, while less than 3 represent a satisfactory quality [20].
Universal Image Quality Index (UIQI)
The UIQI [13] measures how much of the salient information contained in reference image is transferred to the fused image. UIQI is devised by considering loss of correlation, luminance distortion and contrast distortion. The range of this metrics varies from -1 to +1 and the best value is 1.
2 2 2 2
2
2
B A
B A
B A
B A
B A
AB
UIQI
whereσ represents the standard deviation and µ represents the mean value. The first term in RHS is the correlation coefficient, the second term represents the mean luminance and the third measures the contrast distortion. The range of this metrics varies from -1 to +1 and the best value is 1.
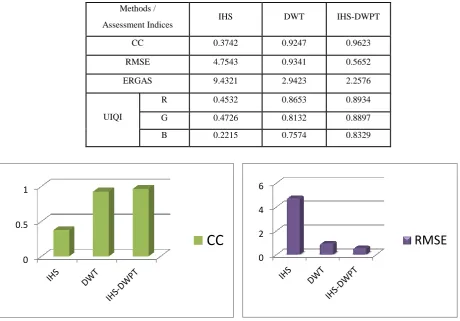
[image:5.595.77.538.316.637.2]The quantitative evaluation results are shown in Table.1. To simplify the comparison of the different fusion methods, the values of quantitative indicators CC, RMSE, ERGAS and UIQI of the fused images are provided as chart in Fig.8a, Figure 8b, and Figure 8c and Figure 8d respectively.
Table.1. Evaluation results of fusion methods
Fig. 8a. Correlation coefficient for fusion methods Fig. 8b. RMSE value of fusion methods
0 0.5 1
CC
0 2 4 6
RMSE
Methods /
Assessment Indices IHS DWT IHS-DWPT
CC 0.3742 0.9247 0.9623
RMSE 4.7543 0.9341 0.5652
ERGAS 9.4321 2.9423 2.2576
UIQI
R 0.4532 0.8653 0.8934
G 0.4726 0.8132 0.8897
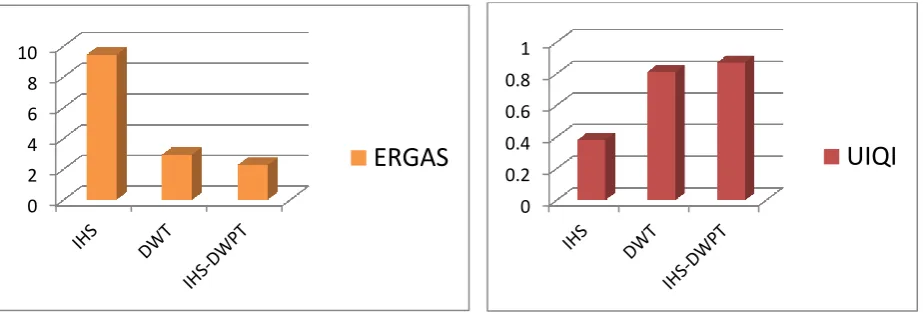
Fig. 8c. ERGAS value for fusion methods Fig. 8d. UIQI of fusion methods
From the visual inspection results and the quantitative results, it can be seen that the experimental results are in conformity with the theoretical analysis. When comparing the results, the CC of the proposed method is significantly higher which shows that it preserves the color of the MS image better than the other two fusion methods.
The RMSE between the proposed fusion image and the original MS image shows a lower value than other methods which means the color distortion of the fused image is less. When the ERGAS value is compared, proposed method has the lowest value and is less than three which represents satisfactory quality. The UIQI for the proposed method is higher than other two methods and is nearest to one which shows a large amount of salient information is transferred to the fused image. Therefore, the proposed method shows better performance and has obvious advantages when compared to IHS transform and DWT fusion. Based on the experimental results, the proposed IHS-DWPT integration method is very efficient for fusing images.
6. CONCLUSION
This paper presents a new approach to fuse high-resolution panchromatic image and low resolution multispectral image using integration of IHS-DWPT technique. The main benefit of DWPT is that it allows better frequency localization of signals. The extended definition of directive contrast is mathematically more accurate than the common definition. The performance of the proposed fusion method is analyzed using various quantitative indicators and compared with the commonly used stand-alone IHS and DWT method. The fusion techniques IHS and DWT provide superior visual high resolution MS images but ignore the requirement of high-quality synthesis of spectral information producing more spectral distortion. The proposed method shows better performance in terms of the high-quality synthesis of spectral information while retaining the spatial content of the Pan image and it provides better result qualitatively and quantitatively. This work infers that the new fusion technique using Integration of IHS Transform and Contrast based Wavelet Packetsshows excellent results than existing multi-resolution fusion methods and intends to focus more on wavelet packet based fusion techniques to improve the existing.
7. REFERENCES
[1] Anjali Malviya and S.G.Bhirud ,“Image Fusion of Digital Images”, Int. J. Recent Trends in Engineering, Vol.2, No.3, November 2009, pp. 2-4.
[2] Ehlers M., S. Klonusa, P. Johan and P. Rosso , “Multi-sensor image fusion for pansharpening in remote sensing”, International Journal of Image and Data Fusion, Vol. 1, No. 1, March 2010, pp. 25–45
[3] K.Shivsubramani, P soman, Krishnamoorthy, “Implementation and Comparative Study of Image Fusion Algorithms”, International Journal of Computer Applications (0975 – 8887) Volume 9, No.2, November 2010, pp.3-6.
[4] T.M.Tu, S.C.Su, H.C.Shyu, and P.S.Huang, “A new look at IHS-like image fusion methods,” Inf. Fusion, vol.2, no. 3, 2001, pp 177–186.
[5] S G Mallat, “A theory for multiresolution signal decomposition: The wavelet representation”, IEEE Trans. PAMI, 11(7), 1989, pp 674-693
[6] T. Pu and G. Ni, “Contrast based Image Fusion using the Discrete Wavelet Transform,” Optical Engineering, vol. 39, no. 8, pp. 2075-2082, 2000.
[7] Z. Xiong, K. Ramchandran, M.T. Orchad, “Wavelet packet image coding using space-frequency quantization,” IEEE Transactions on Image Processing, vol. 7, pp. 160–174, 1998.
[8] A. Toet, L. J. Ruyven, and J. M. Valeton, “Merging thermal and visual images by a contrast pyramid,” Optical Engineering, vol.28, pp. 789–792, 1989. [9] Wenbo W, Y.Jing, and K. Tingjun , “Study Of Remote
Sensing Image Fusion And Its Application In Image Classification” The Int. Archives of the Photogrammetry, Remote Sensing and Spatial Information Sciences, Beijing ,Vol. XXXVI, Part B7, 2008, pp. 1141-1146
[10]Chibani, Y., and A. Houacine, “The joint use of the IHSTransform and the redundant wavelet decomposition for fusing multispectral and panchromatic images”, International Journal of Remote Sensing, 23(18), 2002, pp 3821–3833.
[11]J.G.Liu, “Smoothing filter-based intensity modulation: A spectral preserve image fusion technique for improving
0 2 4 6 8 10
ERGAS
0 0.2 0.4 0.6 0.8 1
[image:6.595.77.539.73.231.2]spatial details,” Int. J. Remote Sens., vol. 21, no. 18, 2000, pp. 3461–3472.
[12]J. N´u˜nez, X. Otazu, O. Fors, A. Prades, V. c Pal`a, and R.Arbiol, “ Multiresolution-Based Image Fusion with Additive Wavelet Decomposition,” IEEE Transactions on Geoscience and Remote Sensing, vol.37, 1999, pp.1204 – 1211.
[13]T. Ranchin and L. Wald, “Fusion of high spatial and spectral resolution images: The ARSIS concept and its implementation,” Photogramm. Eng. Remote Sens., vol. 66, no. 1, 2000, pp. 49–61.
[14]B.Aiazzi, L.Alparone, S.Baronti, and A.Garzelli, “Context-driven fusion of high spatial and spectral resolution images based on over sampled multi-resolution analysis,” IEEE Trans. Geosci. Remote Sens., vol. 40, no. 10, Oct. 2002, pp. 2300–2312.
[15]K. Amolins, Y. Zhang, and P. Dare, “Wavelet based image fusion techniques - An introduction, review and
comparison,” ISPRS Journal of Photogrammetry & Remote Sensing, vol.62, 2007, pp. 249–263. [16]Ehlers M., S. Klonusa, P. Johan and P. Rosso ,
“Multi-sensor image fusion for pansharpening in remote sensing”, International Journal of Image and Data Fusion, Vol. 1, No. 1, March 2010, pp. 25–45.
[17]A. Goshtasby and S. G. Nikolov, “Image fusion: Advances in the state of the art”, Editorial- Science Direct, Special Issue on Image fusion, 8(2), April 2007, pp 114-118
[18]Wang Z. and A.C. Bovik, “A universal image quality index,” IEEE Signal Process Lett., 9(3), 2002, pp. 81-84.