MULTI-OBJECTIVE ARTIFICIAL BEE COLONY (MOABC)
ALGORITHM TO IMPROVE CONTENT-BASED IMAGE
RETRIEVAL PERFORMANCE
1ANIL KUMAR MISHRA, 2Dr.MADHABANANDA DAS, 3DR.T.C.PANDA
1
Associate Professor, Orissa Engg. College, BBSR
2Sr.Professor, KIIT UNIVERSITY,BBSR 3Principal, Orissa Engg College, Bhubaneswar.
E-mail: [email protected]
ABSTRACT
Multi-objective optimization has been a difficult area and focus for research in fields of image processing. This paper presents anoptimization algorithm based on artificial bee colony (ABC) to deal with multi-objective optimization problems in CBIR. We have introduce to multi-object ABC algorithms is based on the intelligent scavenging behaviour for content base images. It uses less control parameters, and it can be efficiently used for solving for multi object optimization problems. In the current work, MOABC for discrete variables hasbeen developed and implemented successfully for the multi-objective design optimization of composites. The proposed algorithm is corroborated using the standard test problems, and simulation results show that the proposed approach is highly competitive and can be considered a viable alternative to solve multi-objective optimization problems.Finally the performance is evaluated incomparison with other nature inspired techniques which includes Multi-objective Particle Swarm Optimization (MOPSO) and Multi-objective Genetic Algorithm (MOGA). The performance of MOABC is better as par with thatof MOPSO,MOGA and ABC for all the loading configurations.
Keywords: Multi-objective optimization, Structural optimization, Artificial Bee Colony (ABC), Feature Extraction.
1. INTRODUCTION
Content-based image retrieval, is a method which expenditures visual contents to search images from bulky scale image databases according to users interests it is also known as query by image content. Since 1900s Content-based image retrieval has been an active and fast advancing research area. [1][5] CBIR comes to picture when many application with large image database, traditional methods of image indexing have recognized to be unsatisfactory. Finger print scanning system, Automatic face recognition system, Medical image database, Trademark image registration are the application of Content-based image retrieval (CBIR). [6][7] The process of CBIR consists of three stages namely Image acquisition, Feature Extraction and Similarity Matching. In CBIR first of all query image undergoes the three stages as mentioned above. The query image is then compared with the images in the image database. All the images in the database undergo feature extraction so that the resultant feature vector can be compared with the feature vector of the query
image. The closest image in comparison with the query image from the feature database is return [8][10].
Multi objective optimization is defined as a problem of finding a vector of decision variables which fulfils constraints and enhances a vector function whose element characterizes the objective functions and these functions form a mathematical description of performance criteria which are usually in clash with each other [9] [11]. Therefore, the term Multi objective optimization means finding such a solution which would give the values of all the objective functions acceptable to the decision maker. Economics, Finance, Optimal control, optimal design, and Radio resource management are the some application of Multi objective optimization. To solve Multi objective optimization problem there are some methods are used like a No-preference method, Priori method, Posteriori method, Interactive method.[12][13]
numerous methods for processing of low level cues are distinguished by the characteristics of domain-images.[14] The performance of these methods is tested by various issues like image resolution, intra-image illumination variations, non-homogeneity of intra-region and inter-region textures, multiple and occluded objects etc. [4] [15] The other key trouble, is a gap between inferred understanding semantics by pixel domain processing using low level cues and human perceptions of visual cues of given image[16]. The content based image retrieval system comprises of multiple inter-dependent tasks performed by various phases and Inter-tuning of all these phases of the content based retrieval system is unavoidable for over all good results. The diversity in the images and semantic-gap generally enforce parameter tuning & threshold-value specification suiting to the requirements [17].
In 2005 Karaboga proposed the artificial bee colony algorithm (ABC) is an optimization algorithm based on the intelligent foraging behaviour of honey bee swarm [18]. In ABC model, the colony consists of three groups of bees namely employed bees, onlookers and scouts. In this model it is assumed that there is only one artificial employed bee for each food source [19]. Employed bees go to their food source and come back to hive and dance on this area. The employed bee whose food source has been abandoned becomes a scout and starts to search for finding a new food source [2]. Onlookers watch the dances of employed bees and choose food sources depending on dances. Optimal multi-level thresholding, MR brain image classification, cluster analysis, face pose estimation and 2D protein folding etc. these are the applications of ABC [20].
2. RELATED RESEARCHES: A REVIEW
Despite a plenty of works available in the literature, a handful of significant research works are reviewed here.
Chih-Chin Laiet.al [21] have discussed about a user-oriented mechanism for CBIR method and in this paper we used interactive genetic algorithm. IGA is a branch of evolutionary computation. The main difference between IGA and GA is the construction of the fitness function, i.e., the fitness is determined by the user’s evaluation and not by the predefined mathematical formula. A user can interactively determine which members of the population will reproduce, and IGA automatically generates the next generation of content based on the user’s input. Through repeated rounds of
content generation and fitness assignment, IGA enables unique content to evolve that suits the user’s preferences. Based on this reason, IGA can be used to solve problems that are difficult or impossible to formulate a computational fitness function, for example, evolving images, music, various artistic designs, and forms to fit a user’s aesthetic preferences. In this paper IGA is employed to help the users identify the images that are most satisfied to the users’ need.
Lei Wu et.al [22] have proposed a method on Tag Completion for Image Retrieval, the proposed method falls into the category of semi-supervised learning in that both tagged images and untagged images were exploited to find the optimal tag matrix. In this proposed method also evaluated tag completion by performing two sets of experiments, i.e., automatic image annotation and tag based image retrieval. In this proposed method, they focus on a study the problem of tag completion where the goal was to automatically fill in the missing tags as well as correct noisy tags for given images.
Yingying Wang et.al [23] have proposed a model image classification as a Multiple Instance Learning (MIL) problem, by regarding each image as a bag composed of different regions/patches. In this proposedmethod rate distortion multiple instance learning (RDMIL) to take advantage of witnesses to improve the performance of MIL for image classification task. The objective function of RDMIL was decomposed into two convex sub-problems, which can be solved by alternating technique. Especially they design a sequential method to effectively optimize the RD sub problem. Experimental results on two real-world datasets demonstrate the proposed RDMIL algorithm was effective and promising. That approached well illustrates the generative process of witnesses and measures the diverse importance of instances in a probabilistic approach.
H. B Kekre et.al [24] have proposed a method on the selection of suitable similarity measure for content based image retrieval. It contains the analysis done after the application of similarity measure named Minkowski Distance from order first to fifth. It was also explains the effective use of similarity measure named correlation distance in the form of angle ‘cosθ’ between two vectors. In
the features of images in the form of four statistical moments namely Mean, Standard Deviation, Skewness and Kurtosis.
Ramadass Sudhir et.al [25] proposed an algorithm image retrieval technique, which used YUV colour space and wavelet transform approach for feature extraction. Firstly, the colour space was quantified in non-equal intervals, then constructed one dimension feature vector and represented the colour feature. Similarly, the texture feature extraction was obtained by using wavelet. Finally, colour feature and texture feature were combined based on wavelet transform. Based on the colour feature, the rich colour images, such as the type of landscape images or planes, the colour characteristics of the use of regular search colours can be similar to the image. The use of colour and texture features of wavelet transform was more suitable for segmentation of objects and classification of related image from thousands of images. In which the retrieved images were much similar when the YUV is used and the retrieval time is also less when comparing with the previous RGB and HSV methods.
B.Ramamurthy et.al [26] have proposed to retrieve the medical images from huge volume of medical databases. This requires the pre-processing, feature extraction, classification, retrieval and indexing steps in order to develop an efficient medical image retrieval system. In this proposed work, for pre-processing step, the image segmentation method have been carried out, for feature extraction, basic shape feature has been extracted using canny edge detection algorithm, and for classification, K-means classification algorithm has been used. They have realize that Canny Edge Detection and K-means clustering algorithms are quite useful for retrieval of relevant images from image database. The results of this proposed indicate that the proposed approach offers significant performance improvements in retrieval of medical images. Further, by fine tuning of shape feature extraction and using other shape feature extraction methods, performance of the retrieval process can be improved more.
This paper is organised as follows: basics of multi-objective problems in CBIR are presented in Section 3. Details of the problem and its formulation are explained in Section 4. The numerical results and discussions are presented in Section 5. Finally, the comparison of nature inspired techniques and conclusions are given in Sections 6.
3. PROPOSED METHODOLOGY USING
ARTIFICIAL BEE COLONY
ALGORITHM FOR CONTENT BASED IMAGE RETRIEVAL
The main aim of the propose approach is to design a method to improve the content-based image retrieval performance. We have to propose a multi-objective optimizationmodel for a content base image with the aid of the ABC.
In previous paper [28], we have to used single-objective optimization problem for content-based image retrieval performance but we get :
s
x
x
f
in
(
)
;
∈
m
(1) wheref is a scalar functionSis the (implicit) set of constraints.
In this paper, we have use multi object optimization technique with mathematical modelling is called “Pareto optimality”. Let X be n-dimensional search space, and
F
i(
x
)
,
i
=
1
...
k
be k objective functions defined over X. Furthermore, let0
...
1
)
(
x
≤
G
i , i= 1…m, be m inequality constraints. Then, the multi-objective problem can be defined as finding a vector, x=(x1,x2,....xn)T∈X that satisfies the constraints, and optimizes the vector function,))
(
...,
),
(
),
(
(
)
(
x
f
1x
f
2x
f
x
F
=
n (2) Where n>1and F is the set of constraints defined above. The space in which the objective vector belongs is called the objective space, and the image of the feasible set under f is called the attained set.}
),
(
:
{
y
R
y
f
x
x
S
C
=
∈
n=
∈
(3) The scalar concept of “optimality” does not apply directly in the multi-objective setting. Here the notion of Pareto optimality has to be introduced. Essentially, a vectorx
*∈
S
is said to be Pareto optimal for a multi-objective problem if all other vectorsx
∈
S
have a higher value for at least one of the objective functionsf
i, withi
=
1
,
2
,...
n
or have the same value for all the objective functions.3. 1. Content Based Image Retrieval with Multi-objective optimization
thisapproach,Image process algorithms square measure accustomed extract feature extraction that representimage properties like color, texture, and shape that square measure the visual features. To retrieve the query image from the database images, a similarity measures are notice to check the likeness between a question image and database images. One among the most sanctifications of the CBIR approach is the possibility of an automatic retrieval process, instead of the traditional keyword-based approach, which usually requires very laborious and time-consuming previous annotation of database images. The CBIR technology has been employed
in many applications like fingerprint
identification, diverseness data systems, digital libraries,crime interference, medicine, historical analysis etc.
3.2. Feature Extraction
In this paper, we present a novel article bee colony (ABC) algorithm to solving multi-objective optimization problems, namely, multi-objective artificial bee colony (MOABC). In our algorithm, we use all three type feature extraction, color, texture and shape.
3.2.1. Color Feature Extraction
A content-based image retrieval system is presented that computes color similarity among images i.e. it supports querying with respect to color. Color is one of the most important features of objects in image. The color histogram of each image is then stored in the database. When the user does the search by specifying the query image, the system registers the proportion of each color of the query image and goes through all images in the database to find those whose color histograms match those of the query most closely. The color histogram is widely used as an important color feature indicating the content of the image, due to its robustness to scaling, orientation, perspective, and occlusion of images. Initially, a smoothening operation is performed over each frame of the shot segmented clips. Anisotropic diffusion is utilized in our proposed CBVR approach for the smoothening of the frames, prior to color histogram. For, a sequence of frames, the anisotropic diffusion is given by
(
c
a
b
t
f
)
div
t
f
=
∇
∂
∂
)
,
,
(
(4)where,
div
( )
∇
f
is the divergence operator.t
f
∂
∂
is the diffusion co-efficient and denotes thegradient.
c
b
a ,
,
is followed by a normalization function which converts the three dimensional vector into a single dimensional vector. Thus, the color histogram, another important feature for the proposed CBVR scheme is extracted3.2.2. Texture Feature Extraction:
Texture is a feature that is quite difficult to describe, and subjected to the difference of human perception, and it is hard to extracted by segmentation, because segmentation unable to extract the whole texture but the texture element. Given a texture vector which is indicated as
{
x
x
x
n
}
x
=
1
,
2
,
K
,
, where n is the dimension of thefeature vector. We model thedistribution of all samples by the following formula [27]
∑
=
= M i
i ip x
x p 1 ) ( ) |
( λ ω (5)
where pi( x) is a normal PDF, component of the GMM.
i
µ Mean vector
i
R Covariance matrix:
(
)
(
)
− − −= i T i− i
i
i x R x
R x
p µ µ
π 1 2 / 1 2 1 exp | | 2 1 ) ( (6)
Were, ωiis the weight of the component
) ( x
pi , 0<ωi <1for all components,
1
=
∑
ω
i . Mixture model specified in equation (4) is called the Gaussian Mixture Model (GMM).3.3.3. Shape Feature Extraction
Multi-objective optimizationwith Pareto optimal solution
In this paper, introduce a multi-objective optimization technique by using the ABC. The proposed ABC algorithm is performing as neighbourhood search model that fine tunes the neighbourhood search property from employed and onlooker bees that helps to converge faster than conventional MOPSO and MOGA. This optimization algorithm is giving the benchmark model in eq. (2).
=
∀
=
=
∀
≥
=
∀
≤
≤
∈
=
p
x
h
p
x
g
n
u
x
l
R
x
D
i i
i i n
,....
1
,
0
)
(
,....
1
,
0
)
(
,....
1
:
(7)
where m is number of objectives;
Dis feasible search space;
x= {x1 x2 x3 x4 x5……….. xn}T is the set of n dimention
decision variable
R is the set of real numbers;
Rnis n-dimensional hyper-plane or space; and
li and ui are lower and upper limits of ith decision
variable.
The MOOP should simultaneously optimize the all function and produce Pareto optimal solutions. Paretofront is a set of Pareto optimal (non-dominated) solutions,being considered optimal, if no objective can be improvedwithout sacrificing at least one other objective.
4. MULTI-OBJECTIVE
OPTIMIZATIONWITH ABC ALGORITHM
In the ABC algorithm, the colony of artificial bees is classified into three categories: employed bees, onlookers, and scouts. Employed bees are associated with a particular food source that they are currently exploiting or are “employed” at. They carry with them information about this particular source and share the information to onlookers. Onlooker bees are those bees that are waiting on the dance area in the hive for the information to be shared by the employed bees about their food sources and then make decision to choose a food source. A bee carrying out random search is called a scout. In the ABC algorithm, the first half of the colony consists of the employed artificial bees, and the second half includes the onlookers. For every food source, there is only one employed bee. Onlookers are placed on the food sources by using a probability-based selection process. As the nectar amount of a food source increases, the probability value with which the food source is preferred by onlookers increases.
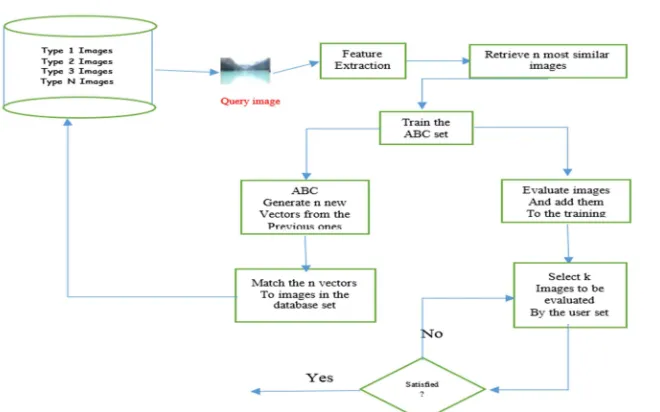
[image:5.612.148.478.468.674.2]The set of all the multi objectives vectors, is called the multi-optimization problem with image can be seen in Fig.1
In our propose algorithm, we use multi-objective optimization concept with ABC and archive strategy to make the algorithm converge to the MOPSO and MOGA. The best advantage of MOABC is that it could use less control parameters to get the most competitive performance. In order to demonstrate the performance of the MOABC algorithm, we compared the performance of the MOABC with those of MOGA, MOPSO optimization algorithms on several two-objective test problems and three-objective functions.
In the initialization phase, the ABC algorithm generates randomly distributed initial food source positions
F
(x
)
of solutions,F
(x
)
where denotes the size of employed bees or onlooker bees. Each solutionF
(
x
)
=
(
f
1(
x
),
f
2(
x
),
...,
f
n(
x
))
is an
-dimensional vector. Here,n
is the number of optimization parameters. And then evaluate each nectar amount. In the ABC algorithm, nectar amount is the value of benchmark function.Employed Bees’ Phase
In the employed bees’ phase, each employed bee finds a new food source
V
i in the neighbourhood ofits current source
x
i. The new food source is calculated using the following expression:)
(
ij kjij ij
ij
x
x
x
V
=
+
Φ
−
(8)where
k
∈
(
1
,
2
,
3
....
m
)
andj
∈
(
1
,
2
,
3
....
n
)
are randomly chosen indexes andk
≠
i
.
Φ
ijk is a random number between [-1, 1]. It controls the production of a neighbour food source position aroundx
ij. Then employed bee compares the newone against the current solution and memorizes the better one by means of a greedy selection mechanism.
Onlooker Bees’ Phase
In the onlooker bees’ phase, each onlooker chooses a food source with a probability which is related to the nectar amount (fitness) of a food source shared by employed bees. Probability is calculated using the following expression:
(9) Here
f
i is fitness function andfit
i is the fitness after a transformation.Scout Bee Phase
In the scout bee phase, if a food source cannot be improved through a predetermined cycles, called “limit”, it is removed from the population, and the employed bee of that food source becomes scout. The scout bee finds a new random food source position using
∑
==
M
i i
i i
fit fit p
1 (10)
Here
M
is the number of food source andf
i isfitness function of the ith food source. Finally, chose a candidate solution based on the section probability by “roulette wheel section”, method. The best ones then get quite the same selection probability as the others and the algorithm stops progressing.
Pseudo code of MOABC algorithm:
1.Step 1:Generates randomly distributed initial food source in cycle = 1
2.Step 2: Initialize the food source positions (solutions)
3.Step 3: Evaluate the nectar amount (fitness function ) of food sources
4. repeat
5.Step 4: Employed Bees’ Phase
6. For each employed bee
7. Produce new food source positions 8. Calculate the value
9. If new position better than previous position
10. Then memorizes the new position and forgets the old one. 11.End For.
12.Step 5: Calculate the values for the solution.
13.Step 6: Go to 2nd Phase (Onlooker Bees) 14. For each onlooker bee
15. Chooses a food source depending on 16. Produce new food source positions 17. Calculate the value
18. If new position better than previous position
19. Then memorizes the new position and forgets the old one. 20. End For
21.Step 7: Go to 2nd Phase (Scout Bee Phase) 22. If there is an employed bee becomes scout
23. Then replace it with a new random source positions 24.Step 8: Memorize the best solution achieved so far
25.Step 9: Cycle = cycle + 1.
26.Step 10: until cycle = Maximum Cycle Number
27.Evaluate each particle in the size of home
28.Step 11:Perform the Pareto dominance check for all the particles:
29.if the Calculated value is best xi is dominated by the newsolution, then xi is replaced by thenew solution.
After Step 11.The proposed algorithm performance of the approach is based on the precision; recall and F-measure cross over points. After evaluating Euclidean distance of the query image, the precision and recall values are generated using the following equations (11), (12) and (13) in[29].
5. EXPERIMENTAL RESULT
In the following, we will first describe the benchmark functions used to compare the performance of MOABC with MOPSO and MOGA. And then we will investigate the performance of the MOABC. For this algorithm, we constrained optimization problem is a considered. The problem involves as large no of decision variables. The propose technique is tested on the five different objective image database of
retrivd images of no Total
retreived images
relevant of
No precision
. .
= (11)
database in images relevant of no Total
retreived images relevant of No recall
. .
= (12)
recall precision
recall precision measure
F
+ =
− 2 * (13)
We use a convergence measure for exclusive computing the extent of convergence to the Pareto optimal and compare the solution with another algorithms. Since, the test problem is consider the retrieved, checks the accuracy of images. We have to calculate the uniform distribution (on the f1-f2-f3
---fm-1) solution on the Pareto-optimal. For each
point in the (M-1) diminution plane fmis calculated
form the Pareto optimal value.
MOABC Application and Performance Evaluation
In this test, we have taken 10 variable (n=10) T1
problem have find out Pareto optimal solution. We use home size of N=100 and the parameter of solution is ps=1 and ns=15
P
m=
1
/
n
and20
=
mn
. In this paper, we have consider five testfor the performance of the proposed algorithms are discussed in table 1. This problemhas the difficulty that a part of the unconstrained Paretooptimal solution is not feasible. Thus the resulting constrained Pareto optimal solutionis a concatenation of thefirst constraint boundary and some part of unconstrainedPareto optimal region. Here the constrained Pareto optimal set is a subset ofthe unconstrained Pareto-optimal set, which gives difficulty in finding the true Pareto optimal region for thealgorithm.
5.1. Result of Color Feature
(a)
(b)
Figure. 2: a) query image, b) Result of the Color Feature
5.2. Result of Shape Feature
(a)
(b)
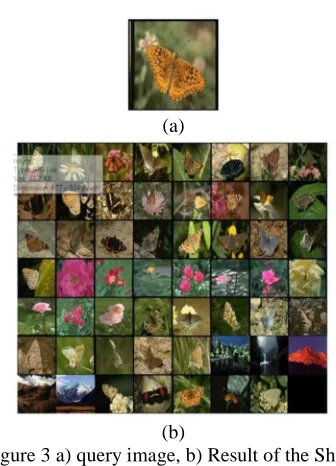
Figure 3 a) query image, b) Result of the Shape Feature
5.3. Result of Texture Feature
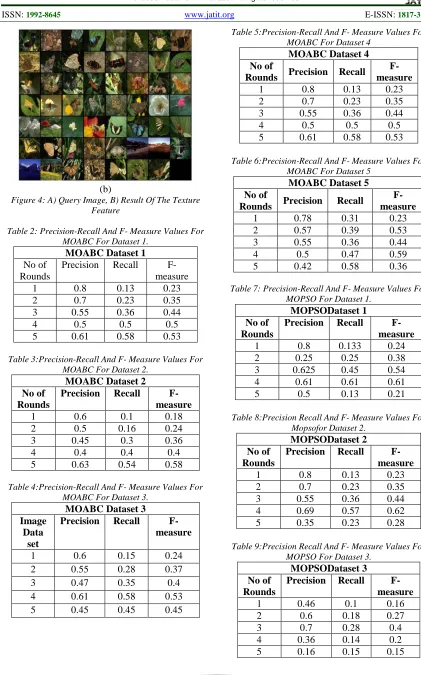
[image:8.612.331.499.311.544.2](b)
[image:9.612.89.510.67.742.2]Figure 4: A) Query Image, B) Result Of The Texture Feature
Table 2: Precision-Recall And F- Measure Values For MOABC For Dataset 1.
MOABC Dataset 1
No of Rounds
Precision Recall F-measure 1 0.8 0.13 0.23 2 0.7 0.23 0.35 3 0.55 0.36 0.44 4 0.5 0.5 0.5 5 0.61 0.58 0.53
Table 3:Precision-Recall And F- Measure Values For MOABC For Dataset 2.
MOABC Dataset 2 No of
Rounds
Precision Recall F-measure
[image:9.612.99.290.309.412.2]1 0.6 0.1 0.18 2 0.5 0.16 0.24 3 0.45 0.3 0.36 4 0.4 0.4 0.4 5 0.63 0.54 0.58
Table 4:Precision-Recall And F- Measure Values For MOABC For Dataset 3.
MOABC Dataset 3 Image
Data set
Precision Recall F-measure
1 0.6 0.15 0.24 2 0.55 0.28 0.37 3 0.47 0.35 0.4 4 0.61 0.58 0.53 5 0.45 0.45 0.45
Table 5:Precision-Recall And F- Measure Values For MOABC For Dataset 4
MOABC Dataset 4 No of
Rounds Precision Recall F-measure
1 0.8 0.13 0.23 2 0.7 0.23 0.35 3 0.55 0.36 0.44 4 0.5 0.5 0.5 5 0.61 0.58 0.53
Table 6:Precision-Recall And F- Measure Values For MOABC For Dataset 5
MOABC Dataset 5 No of
Rounds Precision Recall
F-measure
1 0.78 0.31 0.23 2 0.57 0.39 0.53 3 0.55 0.36 0.44 4 0.5 0.47 0.59 5 0.42 0.58 0.36
Table 7: Precision-Recall And F- Measure Values For MOPSO For Dataset 1.
MOPSODataset 1 No of
Rounds
Precision Recall F-measure
1 0.8 0.133 0.24 2 0.25 0.25 0.38 3 0.625 0.45 0.54 4 0.61 0.61 0.61 5 0.5 0.13 0.21
Table 8:Precision Recall And F- Measure Values For Mopsofor Dataset 2.
MOPSODataset 2 No of
Rounds
Precision Recall F-measure
1 0.8 0.13 0.23 2 0.7 0.23 0.35 3 0.55 0.36 0.44 4 0.69 0.57 0.62 5 0.35 0.23 0.28
Table 9:Precision Recall And F- Measure Values For MOPSO For Dataset 3.
MOPSODataset 3 No of
Rounds
Precision Recall F-measure
[image:9.612.99.293.438.540.2]Table 10:Precision recall and F- measure values for MOPSO for dataset 4.
MOPSODataset 4 No of
Rounds
Precision Recall F-measure
[image:10.612.324.511.113.213.2]1 0.35 0.26 0.29 2 0.45 0.32 0.37 3 0.52 0.38 0.43 4 0.27 0.2 0.22 5 0.275 0.255 0.26
Table 11:Precision recall and F- measure values for MOPSO for dataset 5.
MOPSODataset 5 No of
Rounds
Precision Recall F-measure
1 0.5 0.19 0.27 2 0.5 0.24 0.32 3 0.4 0.28 0.33 4 0.38 0.15 0.21 5 0.26 0.242 0.25
Table 12:Precision recall and F- measure values for MOGA for dataset 1.
MOGADataset 1 No of
Rounds
Precision Recall F-measure
1 0.7 0.12 0.2 2 0.36 0.1 0.18 3 0.46 0.15 0.24 4 0.61 0.61 0.61 5 0.7 0.23 0.35
Table 13:Precision recall and F- measure values for MOGA for dataset 2.
MOGADataset 2 No of
Rounds
Precision Recall F-measure
1 0.33 0.22 0.26 2 0.26 0.18 0.21 3 0.5 0.34 0.4 4 0.73 0.5 0.59 5 0.53 0.22 0.31
Table 14:Precision recall and F- measure values for MOGA for dataset 3.
MOGADataset 3 No of
Rounds
Precision Recall F-measure
1 0.16 0.129 0.14 2 0.13 0.33 0.18 3 0.25 0.19 0.21 4 0.36 0.28 0.31 5 0.25 0.23 0.23
Table 15:Precision recall and F- measure values for MOGA for dataset 4.
MOGADataset 4 No of
Rounds
Precision Recall F-measure
1 0.25 0.18 0.2 2 0.2 0.14 0.16 3 0.375 0.27 0.31 4 0.55 0.4 0.46 5 0.125 0.116 0.12
[image:10.612.103.287.255.366.2]
Table 16:Precision recall and F- measure values for MOGA for dataset 5.
MOGADataset 5 No of
Rounds
Precision Recall F-measure
1 0.23 0.21 0.21 2 0.33 0.3 0.31 3 0.16 0.15 0.15 4 0.26 0.242 0.25 5 0.325 0.26 0.28
Table 17:Precision recall and F- measure values for ABC for dataset 1.
ABCDataset 1 Image
Data set
Precision Recall F-measure
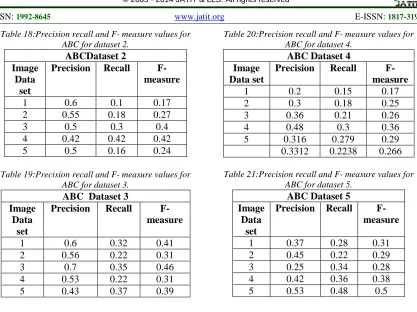
[image:10.612.327.511.375.475.2]Table 18:Precision recall and F- measure values for ABC for dataset 2.
ABCDataset 2 Image
Data set
Precision Recall F-measure
1 0.6 0.1 0.17 2 0.55 0.18 0.27 3 0.5 0.3 0.4 4 0.42 0.42 0.42 5 0.5 0.16 0.24
Table 19:Precision recall and F- measure values for ABC for dataset 3.
ABC Dataset 3 Image
Data set
Precision Recall F-measure
1 0.6 0.32 0.41 2 0.56 0.22 0.31 3 0.7 0.35 0.46 4 0.53 0.22 0.31 5 0.43 0.37 0.39
Table 20:Precision recall and F- measure values for ABC for dataset 4.
ABC Dataset 4 Image
Data set
Precision Recall F-measure
1 0.2 0.15 0.17 2 0.3 0.18 0.25 3 0.36 0.21 0.26 4 0.48 0.3 0.36 5 0.316 0.279 0.29 0.3312 0.2238 0.266
Table 21:Precision recall and F- measure values for ABC for dataset 5.
ABC Dataset 5 Image
Data set
Precision Recall F-measure
[image:11.612.173.435.410.519.2]1 0.37 0.28 0.31 2 0.45 0.22 0.29 3 0.25 0.34 0.28 4 0.42 0.36 0.38 5 0.53 0.48 0.5
Table 22: Mean precision values for different datasets of retrieval obtained by the proposed MOABC and other existing algorithms for CBIR.
Mean precision values
MOABC MOPSO MOGA ABC
Dataset 1 0.632 0.557 0.566 0.514
Dataset 2 0.516 0.618 0.47 0.4
Dataset 3 0.536 0.456 0.3 0.564
Dataset 4 0.632 0.373 0.23 0.404
[image:11.612.174.434.550.659.2]Dataset 5 0.632 0.408 0.261 0.3312
Table 23: Mean recall values for different datasets of retrieval obtained by the proposed MOABC and other existing algorithms for CBIR.
Mean recall values
MOABC MOPSO MOGA ABC
Dataset 1 0.36 0.3146 0.242 0.232
Dataset 2 0.3 0.304 0.292 0.192
Dataset 3 0.362 0.17 0.2212 0.296
Dataset 4 0.36 0.283 0.2318 0.336
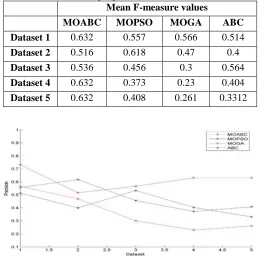
Table 24: Mean F-measure values for different datasets of retrieval obtained by the proposed MOABC and other existing algorithms for CBIR.
Mean F-measure values
MOABC MOPSO MOGA ABC
Dataset 1 0.632 0.557 0.566 0.514
Dataset 2 0.516 0.618 0.47 0.4
Dataset 3 0.536 0.456 0.3 0.564
Dataset 4 0.632 0.373 0.23 0.404
Dataset 5 0.632 0.408 0.261 0.3312
Figure. 5:Precision values for MOABC, MOPSO and MOGA and ABC with 5 dataset
Figure. 6: recall values for MOABC, MOPSO and MOGA and ABC with 5 dataset
[image:12.612.180.431.409.540.2] [image:12.612.181.430.574.708.2]Compared to other optimization technique, our proposed work has produced better results. Our proposed work has performed satisfactorily when its color, texture and shape feature was tested on the five different database.From the fig 5 to fig. 9 is observed that the propose MOABC has the precision rate as 88% and recall rate 70%, but the other three algorithms have lesser and also F-measure of the MOABC is also better than the individual MOPSO, MOGAand ABC algorithm. After the inclusion of the feature extraction, based on the given query image, the retrieved color, texture and shape feature from images.
In the all five differentdataset retrieval were performed by querying five different images and for every dataset we get precision, recall and F-measure values is determined. The precision and recall value comparison between the proposed extensive algorithms features extraction based on multi-objective optimization systems shows that the performance of the proposed system is best over that of the existing systems. Thus the comparisons are made using multiple features such as color, texture, shape that the proposed MOABC algorithm performs better than the individual MOPSO, MOGAand ABC algorithm
6. CONCLUSION
In this paper the new method (MOABC) is introducing multi-optimized updation in ABC algorithm, MOPSO and MOGA instead of single optimization Search. Here it is implemented in MATLAB and is tested by using different evaluation functions. The parameter position is optimized for multiple object and the values of the propposed method is compared with single object MOPSO,MOGAand ABC algorithm. In the proposed method the fitness values are seems to be better for the Precision Recall andF-measure value found to be better in all single evaluationalgorithems. From the above results it is clear that the MOABC is the better multi-object optimization technique while comparing to MOPSO, MOGAand ABC algorithm
REFERENCES
[1] Binitha S, S Siva Sathya, “A Survey of Bio inspired Optimization Algorithms”, International Journal of Soft Computing and Engineering, Vol. 2, No. 2, pp. 137-151, 2012. [2] Nabeel Mohammed and David McG.
Squire,"Effectiveness of ICF features for collection-specific CBIR", 9th International
Workshop on information Systems and Applications, Vol. 7836, pp. 83-95, 2013. [3] Jun Wang, Sanjiv Kumar, and Shih-Fu
Chang,"Semi-Supervised Hashing for Large Scale Search", IEEE Transactions on Pattern Analysis and Machine Intelligence, Vol. 34, No. 12, pp. 2393- 2406, 2012.
[4] Ju Han and Kai-Kuang Ma, “Fuzzy Color Histogram and Its Use in Color Image Retrieval”, IEEE Transactions on Image Processing, Vol. 11, No. 8, August 2002. [5] Dacheng Tao, Xiaoou Tang, and Xuelong Li,
“Which Components are Important for Interactive Image Searching?”, IEEE Transactions on Circuits and Systems for Video Technology, Vol. 18, No. 1, January 2008. [6] Marıa Jimena Costa, Alexey Tsymbal, Matthias
Hammon, Alexander Cavallaro, Michael Suhling,Sascha Seifert and Dorin Comaniciu,"A Discriminative Distance Learning–Based CBIR Framework for Characterization of Indeterminate Liver Lesions", Vol. 7075, pp. 92-104, 2012.
[7] Yong Rui, Thomas S. Huang, Michael Ortega and Sharad Mehrotra, “Relevance Feedback: A Power Tool for Interactive Content-Based Image Retrieval”, IEEE Transactions on Circuits and Video Technology, Vol. 8, No. 5, pp. 644-655, 1998
[8] Juan C. Caicedo, Fabio A. Gonzalez and Eduardo Romero, “A Semantic Content-Based Retrieval Method for Histopathology Images”, Information Retrieval Technology, Vol. 4993,pp. 51-60, 2008.
[9] Robert Huitl, Georg Schroth, Sebastian Hilsenbeck, Florian Schweiger and Eckehard Steinbach,"VirtualReference View Generation for CBIR-based Visual Pose Estimation", pp. 993-996, 2012.
[10] Sri Rama Krishna, A. Guruva Reddy, M.N.Giri Prasad, K.Chandrabushan Rao, M. Madhavi, "Genetic Algorithm Processor for Image Noise Filtering Using Evolvable Hardware," International Journal of Image Processing, Vol. 4, No. 3, Pp.240-251, 2010.
[11] Jakia Afruz, Va Juanna Wilson,"Frequency Domain Pseudo-color to Enhance Ultrasound Images," In. Proc. of Computer and Information Science, Vol. 3, No. 4, Pp. 24-34, Nov. 2010. [12] Grant J. Scott, Matthew N. Klaric, Curt H.
IEEE Transactions On Geoscience and Remote Sensing, VOL. 49, pp. 5, 2011.
[13] H. B. Kekre and Kavita Sonawane,"Effect of Similarity Measures for CBIR Using Bins Approach", International Journal of Image Processing, Vol. 6, pp. 182-190, 2012.
[14] Edward Kim, Sameer Antani, Xiaolei Huang, L.Rodney Long and Dina Demner-Fushman,"Using Relevant Regions in Image Search and Query Refinement for Medical CBIR", Society for Imaging Informatics in Medicine, Vol. 21, pp. 280-289. 2207.
[15] Gerald Schaefer, "Content-Based Image Retrieval – Some Basics", Advances in Intelligent and Soft Computing, Vol. 103, pp 21-29, 2011.
[16] Ch. Kavitha, B. Prabhakara Rao and A. Govardhan,"Image Retrieval Based On Color and Texture Features of the Image Sub-blocks", International Journal of Computer Applications, Vol. 15, No.7, pp. 975 – 8887, 2011.
[17] Sushil Kumar Singh, Aruna Kathane,"Various Methods for Edge Detection in Digital Image Processing," International journal of computer science and technology, Vol. 2, No. 2, Pp. 188-190, June 2011.
[18] Md. Mahmudur Rahman, Bipin C. Desai, Prabir Bhattacharya, “Supervised Machine Learning based Medical Image Annotation and Retrieval”, IEEE Transactions on Pattern Analysis and Machine Intelligence, Vol.29 , No. 3, pp. 394-410, 2007
[19] Thomas M. Deserno, Sameer Antani and Rodney Long, “Ontology of Gaps in Content-Based Image Retrieval” Journal of Digital Imaging, Vol. 22, No. 2, pp. 202-215, 2009. [20] Milos Subotic, Milan Tuba and
NadezdaStanarevic, “Different approaches in parallelization of the artificial bee colony algorithm”, International Journal of Mathematical Models And Methods in Applied Sciences, Vol. 5, No. 4, pp. 755-762, 2011 [21] Chih-Chin Lai, and Ying-Chuan Chen,"A
User-Oriented Image Retrieval System Based on Interactive Genetic Algorithm", IEEE Transactions on Instrumentation and Measurement, Vol. 60, No. 10, pp. 1-10, 2011. [22] Lei Wu, Rong Jin and Anil K. Jain,"Tag
Completion for Image Retrieval", IEEE Transactions On Pattern Analysis and Machine Intelligence, Vol. 35, No. 3, pp. 716-727, 2013. [23] Yingying Wang, Chun Zhang and Zhihua
Wang,"Rate Distortion Multiple Instance
Learning For Image Classification", IEEE International Confrence On Image Prossecing, PP. 3235-3240, 2013.
[24] H. B. Kekre and Kavita Sonawane,"Bin Pixel Count, Mean and Total of Intensities Extracted From Partitioned Equalized Histogram for CBIR", International Journal of Engineering Science and Technology, Vol. 4, pp. 1233- 1240, 2012.
[25] Ramadass Sudhir and S. Santhosh Baboo,"An Efficient CBIR Technique with YUV Color Space and Texture Features", Computer Engineering and Intelligent Systems, Vol. 2, No.6, pp. 78-85, 2011.
[26] B.Ramamurthy and K.R.Chandran,"CBIR: Shape-Based Image Retrieval Using Canny Edge Detection and K-Means Clustering Algorithms for Medical Images", International Journal of Engineering Science and Technology, Vol. 3, No.1, pp. 1870-1880, 2011. [27] H.B.Kekreand Dhirendra Mishra, "Color Feature Extraction for CBIR", International Journal of Engineering Science and Technology (IJEST), Vol. 3 No.12 December 2011
[28] Mishra Anil Kumar, Das Madhabananda and Panda T. C. “A Hybrid Swarm Intelligence Optimization for Benchmark Models by Blending PSO with ABC”, International Review on Modelling & Simulations, Vol. 6, No., pp. 291, 2013.