M E T H O D O L O G Y
Open Access
A bioinformatics approach to distinguish plant
parasite and host transcriptomes in interface
tissue by classifying RNA-Seq reads
Daisuke Ikeue
1, Christian Schudoma
2,5, Wenna Zhang
2, Yoshiyuki Ogata
1, Tomoaki Sakamoto
3, Tetsuya Kurata
3,
Takeshi Furuhashi
4,6, Friedrich Kragler
2and Koh Aoki
1*Abstract
Background:The genusCuscutais a group of parasitic plants that are distributed world-wide. The process of parasitization starts with aCuscutaplant coiling around the host stem. The parasite’s haustorial organs then establish a vascular connection allowing for access to the phloem content. The host and the parasite form new cellular connections, suggesting coordination of developmental and biochemical processes. Simultaneous monitoring of gene expression in the parasite’s and host’s tissues may shed light on the complex events occurring between the parasitic and host cells and may help to overcome experimental limitations (i.e. how to separate host tissue fromCuscutatissue at the haustorial connection). A novel approach is to use bioinformatic analysis to classify sequencing reads as either belonging to the host or to the parasite and to characterize the expression patterns. Owing to the lack of a comprehensive genomic dataset fromCuscutaspp., such a classification has not been performed previously.
Results:We first classified RNA-Seq reads from an interface region between the non-model parasitic plant
Cuscuta japonicaand the non-model host plantImpatiens balsamina. Without established reference sequences, we classified reads as originating from either of the plants by stepwise similarity search againstde novoassembled transcript sets ofC. japonicaandI. balsamina, unigene sets of the same genus, and cDNA sequences of the same family. We then assembledde novotranscriptomes from the classified read sets. We assessed the quality of the classification by mapping reads to contigs of both plants, achieving a misclassification rate low enough (0.22-0.39%) to be used reliably for differential gene expression analysis. Finally, we applied our read classification method to RNA-Seq data from the interface between the non-model parasitic plantC. japonicaand the model host plantGlycine max. Analysis of gene expression profiles at 5 parasitizing stages revealed differentially expressed genes from bothC. japonicaandG. max, and uncovered the coordination of cellular processes between the two plants. Conclusions:We demonstrated that reliable identification of differentially expressed transcripts in undissected interface region of the parasite-host association is feasible and informative with respect to differential-expression patterns.
Keywords:Cuscuta japonica,Cuscuta reflexa, Classification, Parasitic plant, Transcriptome, Parasite-host interaction
* Correspondence:[email protected]–u.ac.jp 1
Graduate School of Life and Environmental Sciences, Osaka Prefecture University, 1–1 Gakuen–Cho, Naka–Ku, Sakai, Osaka 599–8531, Japan Full list of author information is available at the end of the article
Background
In angiosperms, approximately 4000 species are parasitic to some extent [1]. Parasitic plants have evolved from at least 11 independent clades [2]. They depend, partly or entirely, on a host plant for acquisition of water and nutrients. The ability to consume water and nutrients from the host plant affects the appearance and metabol-ism of parasitic plants. In general, parasitic plants either partially lost the capacity of photosynthetic production (hemiparasitic plants) or entirely depend on host plants (holoparasitic plants) [3].
The genus Cuscuta is a prominent group of parasitic plants. It consists of 150–200 species that are distributed world-wide [4]. Some Cuscuta spp. are known to infest fields, thereby leading to crop losses. Although seedlings of Cuscuta are self-sufficient, mature plants have no roots, and their leaves are reduced to small scales. Para-sitism of Cuscutastarts with sensing the host plant and coiling around the host stem. This action is followed by formation of prehaustorium structures from meri-stematic cells [5]. Invasion of the host tissue by the hau-storium is initiated by production of a set of enzymes degrading the host cell wall [6] and inducing a host defense response (also reported for herbivores and path-ogens [7]). According to the degree of defense response of the host plant to prevent the haustorium from reach-ing the vascular tissue or from establishreach-ing a functional conduit, the interaction between parasite and host plants can be classified as compatible or incompatible [8,9]. In a compatible host, aCuscuta-host feeding connection is usually established by the formation of new vascular tis-sue connecting the pre-existing host vasculature to the Cuscuta vasculature. Dye tracer experiments showed both an apoplastic [8] and a symplastic exchange [10] of small molecules between the species. Additionally, the transfer of macromolecules such as mRNA [11,12], and siRNA [13] as well as viruses [14] indicates the existence of a symplastic parasite-host interface. Furthermore, mi-croscopy studies demonstrated the presence of protoxy-lem cells in the interface between Cuscuta and host tissues [8]. Even when Cuscuta attaches itself to an in-compatible host, transfer cells specializing in water and nutrient uptake are initiated at the interface, but the trans-fer of nutrients via the phloem sieve tube does not occur [8]. Obviously, in both compatible and incompatible inter-actions, tight coordination of growth and differentiation between a parasite plant and its host is essential. It is chal-lenging, however, to assign the underlying molecular events to specific cells belonging toCuscutaor its host.
The formation of these cellular structures at the cell-to-cell interface seems to tighten the physical connection, thus making it difficult to detach cells of the parasite from host cells to investigate gene expression profiles of re-spective plants. Given that morphological markers exist,
the individual tissues can be isolated using laser microdis-section and subjected to RNA-Seq (whole-transcriptome shotgun sequencing) analysis [15]. Nevertheless, the Cus-cuta tissue at the interface represents a highly complex branched structure composed of haustorial tissue and searching hyphae [16]. Thus, in most instances, this tissue is too complex to be dissected and analyzed in a simple fashion. An alternative method could be to classify RNA sequencing data using a bioinformatics approach. For in-stance, in transcriptomic analysis of Cuscuta pentagona using RNA-Seq (whole-transcriptome shotgun sequen-cing), reads originating from the host plant were removed using the reference sequences of compatible hosts [15,17,18]. In the analysis of RNA movement between C. pentagona and host plants (Arabidopsis and tomato), similar read classification based on the similarity to the host’s reference sequences was performed to distinguish transcripts from parasite plant and host plant [12]. Since complete genome sequences for Cuscuta spp. and their natural hosts are not available, the above classification and filtering cannot be used. However, the latest next-generation sequencing technology provides sufficient depth (numbers of reads) and sequence length to classify reads and to identify specific expression patterns.
Results and discussion
Classifying RNA-Seq reads derived from two non-model plants
We attempted to identify genes expressed in the interface region formed between two non-model plants, the para-siteC. japonica, and the host,I. balsamina(Figure 1). Our first aim was to assemblede novotranscriptome sets using RNA-Seq reads obtained from the interface region with-out physically dissecting either the parasite’s or host’s tis-sues. Instead of using physical dissection, we employed a bioinformatic approach to classify the reads into two groups; 1)C. japonica, and 2)I. balsamina. As references for classification of the reads, sequence sets of the tran-scriptome were assembled from samples of C. japonica andI. balsaminathat grew independently and were not in contact (nc; Figure 2). Sets of RNA-Seq reads derived from C. japonica(Cj_nc_reads) andI. balsamina(Ib_nc_reads)
can be considered non-contaminated. We assembled the reads from these sets into 62,648 Cj_nc_contigs and 25,301 Ib_nc_contigs, respectively. The difference in con-tig numbers could be due to the tissue specificity of the gene expression in theC. japonicasubapical stem and the I. balsaminastem.
The reads obtained from the interface region (Fig-ure 1C) in whichC. japonicaparasitized toI. balsamina (CjIb_if_reads; Figure 2) were classified using three se-quential rounds of mapping. First, we mapped the CjI-b_if_reads separately to the contigs from tissues that were not-in-contact, Cj_nc_contigs and Ib_nc_contigs. Reads that were uniquely mapped onto either Cj_nc_ contigs or Ib_nc_ contigs were classified as originating fromC. japonicaorI. balsamina, respectively (Figure 2). The reads that remained unmapped at this point likely contained transcripts specific to the interface region. To distinguish C. japonica reads from I. balsamina reads, we used previously published unigene sets ofC. pentagona and C. suaveolens [17,18]. In addition, we constructed a novel contig set ofC. reflexa, the species phylogenetically closest to C. japonica [4]. This analysis was performed using RNA-Seq reads from self-parasitizing tissue in which the subapical region ofC. reflexaformed haustorial connections to distant parts of its own stem or to other C. reflexa individuals feeding on tomato. The C. reflexa transcriptome was assembled from 308,147,540 paired-end reads and consisted of 165,213 contigs (Cr_contigs, Table 1). We performed the second classification by mapping the reads that remained unmapped in the first classification onto theseCuscuta-genus unigene sets. The mapping reads were then considered as originating from C. japonica (11,001,253 reads). During the final step, we mapped the remaining reads to the NCBI nt (nucleotide) database. If reads mapped to nucleotide entries from Convolvulaceae or Balsaminaceae families, they were con-sidered to be derived fromC. japonicaorI. balsamina, re-spectively. This step revealed additional 26,045C. japonica and 9,393I. balsaminareads.
After this stepwise classification, 73% (75,842,928 reads) of the sequence information from the interface re-gion (104,521,554 CjIb_if_reads) could be mapped to C. japonica, whereas 8.2% (8,502,752 reads) mapped to I. balsamina (Figure 2). This difference in the numbers of classified reads was probably due to difference in the concentration of RNA in the parasite and the host tis-sues. The amount of total RNA per mg fresh weight of not-in-contact stem tissue of C. japonicawas 16.8 ± 6.5-fold greater than that in anI. balsaminasample of equal mass (Additional file 1). Thus, in the interface-region samples that contained nearly equal amounts of parasite and host tissues, a larger number of C. japonica reads was expected. In a previous study on the associations be-tween C. pentagona and Arabidopsis and C. pentagona
A
C
B
b
c
IF
2
ndIb
1
stIb
1
stIb
2
ndIb
Cj
Cj
Figure 1Experimental setup ofC. japonica-I. balsaminaassociation. (A)C. japonica(Cj) made parasite-host association to the first
I. balsaminaindividual (1stIb, left). Elongated
C. japonicaattached to the secondI. balsaminaindividual (2ndIb, right) and made
parasite-host association. Interface region (IF) was sampled from the secondI. balsamina(2ndIb, right). Black triangles indicate an
elongated stem ofC. japonica.(B)Magnified image of the interface region on the stem surface of the firstI. balsamina(1stIb).(C)Magnified
image of the interface region of the secondI. balsamina(2ndIb). Tissue
and tomato, the interface regions contained higher por-tions of host reads (51% fromArabidopsisand 86% from tomato) [12]. The discrepancy with the present study might be due to the fact that the interface region in this study was sampled from the stem ofC. japonicacloser to the apex (1 cm from the tip) than the region used in the C. pentagonastudy (>7.5 cm from the tip) [12], and there-fore resulted in a higher percentage ofC. japonicareads.
De novoassembly and annotation
The classified reads from the interface region (Cj_Ibif_-reads and Ib_Cjif_(Cj_Ibif_-reads) were merged with the respect-ive read set from not-in-contact tissues (Cj_nc_reads or Ib_nc_reads). The merged read sets were used for de novotranscriptome assembly using Velvet/Oases [19,20].
The assembled C. japonicaand I. balsamina transcrip-tomes consisted of 60,124 contigs (Cj_contigs_ci1, me-dian length 599 bp, average length 980 bp; Table 1) and 27,594 contigs (Ib_contigs, median length 1,026 bp, aver-age length 1,276 bp; Table 1).
TheC. reflexa transcriptome used in read classification was based on 308,147,540 paired-end reads as input forde novoassembly using Trinity (version r20140717) [21]. The raw assembly consisted of 165,213 Cr_contigs (246,886 transcript variations, with median length 377 bp, average length 620 bp; Table 1). We could predict ORFs in 89,456 C. reflexacontigs (median length 330 bp). Of these contigs, 64,442 contained full-length ORFs (median length 363 bp).
These numbers of assembled transcripts may be an overestimation for the actual numbers of genes expressed
Cj_nc_reads CjIb_if_reads Ib_nc_reads
Cj_nc_contigs Ib_nc_contigs
assembly mapping assembly
Cuscuta-genus unigene sets
nt
Cj_contigs_ci1 Ib_contigs
assembly
Cj_Ibif_reads Ib_Cjif_reads
mapping
mapping unmapped
unmapped mapped
mapped
mapped to Convolvulaceae
mapped to Balsaminaceae
mapped
not-in-contact tissue of Cj interface-region tissue not-in-contact tissue of Ib
Paired read filtering
114,056,994 104,521,554 88,469,356
62,648 25,301
64,815,630 8,493,359
11,001,253
26,045 9,393
75,842,928 8,502,752
68,646,214 7,234,748
60,124 27,594
assembly Paired read
filtering
Figure 2Schematic diagram of classification of reads. Dotted lines indicate that mapping was performed. Solid lines indicate that assembly or classification was performed. Abbreviations: Cj,C. japonica; Ib,I. balsamina; nc, not-in-contact; if, interface region. Numbers indicate the numbers of reads.
Table 1De novoassembly and annotation ofC. reflexa,C. japonica,andI. balsaminacontigs
C. reflexa(Cr_contigs) C. japonica(Cj_contigs_ci1) I. balsamina(Ib_contigs) Library type Illumina, 90 bp paired-end Illumina, 101 bp paired-end Illumina, 101 bp paired-end
Assembler Trinity Velvet/Oases Velvet/Oases
Assembled reads 308,147,540 182,703,208 95,704,104
Number of contigs 165,213 60,124 27,594
Median contig length 377 bp 599 bp 1,026 bp
Average contig length 620 bp 980 bp 1,276 bp
ORF predicted 89,456 (54%) 59,768 (99%) 27,507 (99%)
in the tissues. This overestimation is possibly due to the presence of alleles, alternatively spliced transcripts, and fragmented transcripts. Further refinement will be re-quired on the basis of annotation.
The gene ontology (GO) category distributions for Cj_contigs_ci1 and Ib_contigs, based on the similarity to the RefSeq database [22] and TAIR10 [23], did not have a bias toward any specific categories (Additional file 2). A similarity search for transcripts of other plants re-vealed that C. japonica transcripts showed the highest similarity to C. reflexa, and showed lower similarity to parasitic plants belonging to the Orobanchaceae family (Additional file 3).
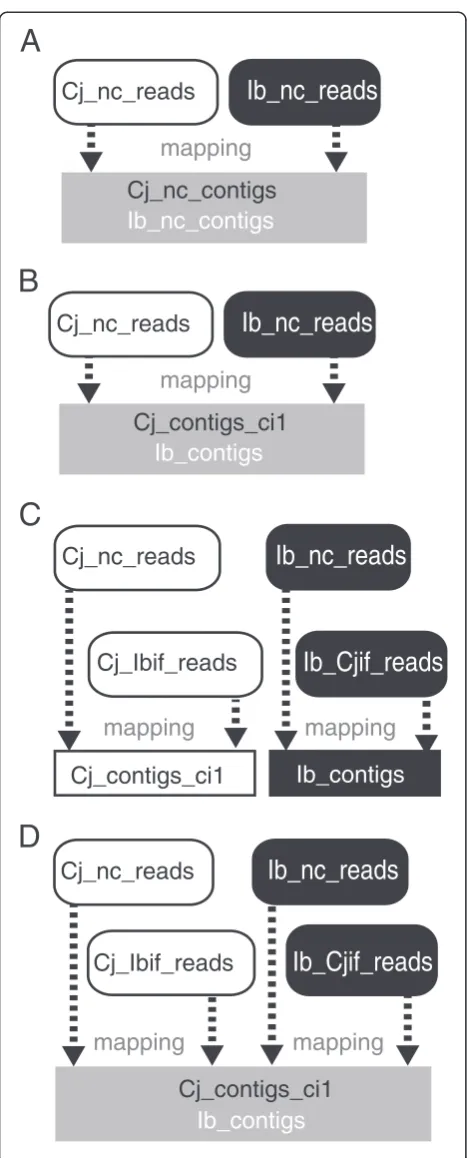
Quality assessment of read classification
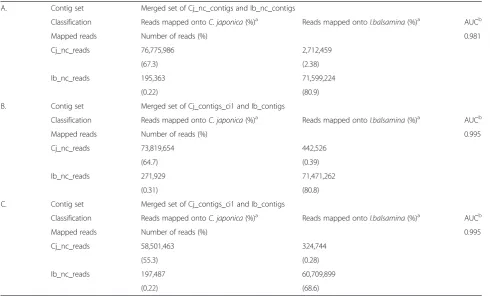
The transcripts ofC. japonicaand I. balsamina werede novo assembled from all reads including those obtained from the interface region. This fact prompted us to esti-mate the extent of misclassification ofC. japonica reads asI. balsaminatranscripts or vice versa. To this end, we performed a competitive mapping. In conventional cases, RNA-Seq reads obtained from an organism are mapped solely onto the reference sequence of that or-ganism. Here, our strategy was to map reads onto both C. japonica and I. balsamina contigs. A binary choice was made based on a higher mapping score (identity and e value) in order to assign reads to one of the two spe-cies. Since using reads from the interface-region samples would make it harder to properly discriminate the true and false source organisms, we used only Cj_nc_reads and Ib_nc_reads for our estimation.
Misclassification during mapping will inevitably occur due to the presence of homologous transcripts between C. japonicaandI. balsamina(Additional file 3). To esti-mate the extent to which this misclassification can be attributed to the presence of homologous transcripts, we mapped Cj_nc_reads and Ib_nc_reads to a merged dataset consisting of Cj_nc_contigs and Ib_nc_contigs (Figure 3A). Because Cj_nc_contigs and Ib_nc_contigs were assembled separately from the two nonoverlapping read sets, any instance of misclassification had to occur due to the presence of identical sequences in the parasite and the host. According to this test, the background rates of false classification were revealed as: 2.38% (Cj_nc_reads mapped to Ib_nc_contigs) and 0.22% (Ib_nc_reads mapped to Cj_nc_contigs; Table 2A).
In comparison with this mapping, we mapped Cj_nc_reads and Ib_nc_reads to a merged transcript set consisting of Cj_contigs_ci1 and Ib_contigs (Figure 3B). During this round of mapping, an instance of false as-signment could be attributed to read misclassification that occurred prior to the assembly of Cj_contigs_ci1 and Ib_contigs, in addition to transcript homology. Here, 0.39% of Cj_nc_reads were mapped to Ib_contigs and
0.31% of Ib_nc_reads were mapped to Cj_contigs_ci1 (Table 2B), suggesting that these cross-mapped reads were misclassified. We estimated the rate of false classi-fication under more stringent conditions where only exact matches were allowed. The frequency of false as-signments of Cj_nc_reads to Ib_contigs decreased to 0.28% and that of Ib_nc_reads to Cj_contigs_ci1 de-creased to 0.22% (Table 2C).
Finally, we evaluated the quality of the classification by analyzing the receiver operating characteristic (ROC) and its area under the curve (AUC) [24]. The AUC ap-proaches 1.0 when better classification is achieved with a greater ratio of true positive to false positive results. When nc_reads were mapped onto nc_contigs, the AUC was 0.981 (Table 2A). When nc_reads were mapped onto contigs assembled from classified reads, we ob-tained a higher AUC of 0.995 (Table 2B).
These results collectively demonstrated that, when we mapped the reads obtained from the interface region to the transcripts assembled from them, these reads could be assigned to the wrong plant. Nevertheless, according to the ROC AUC, read classification performed prior to transcript assembly did not impair the binary choice more strongly than in the case of false assignments solely due to the presence of homologous transcripts. These results raise the question whether false assign-ments can happen more frequently between plant spe-cies that are more closely related. A systematic analysis of RNA-Seq reads from many plant species will be ne-cessary to find an answer to this question.
down-regulated genes inC. japonica(Table 3). This result implies that excluding potentially misclassified reads makes no significant difference for the identification of transcripts differentially expressed in the interface region.
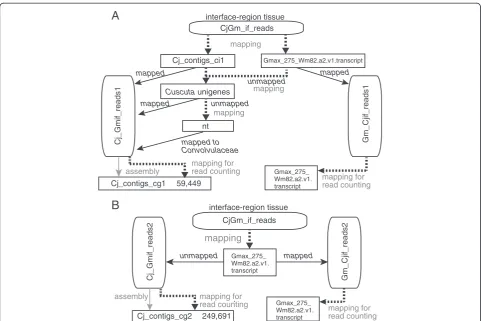
Application of the read classification toC. japonica-model plant interaction
We applied the read classification method to RNA-Seq data obtained from the interface region betweenC. japonicaand a model-plant host,Glycine max(soybean) whose reference transcriptome was available [25] (Figure 4). Interface re-gions were sampled from five parasitizing stages at 24 h after attachment (haa), 48 haa, 72 haa, 96 haa and 120 haa (Figure 4A). Reads from interface regions were classified using two approaches. The “stepwise classification” ap-proach (Figure 5A) was based on the reference transcrip-tome of G. max, Gmax_275_Wm82.a2.v1.transcript [26] to select G. max reads, and used the read classification method presented in the previous sections to identify C. japonicareads. By contrast, the“ reference-based-classi-fication” approach (Figure 5B), mapped reads from the interface regions onto a reference transcriptome set of G. max. Reads that mapped to the reference were regarded asG. maxreads, non-mapping reads were assumed to ori-ginate fromC. japonica.
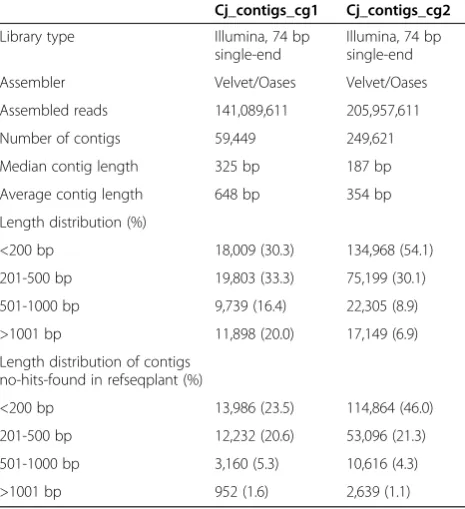
C. japonicareads from the five parasitizing stages were pooled and subjected tode novotranscriptome assembly. Reads obtained by stepwise classification were assembled into 59,449 contigs (Cj_contigs_cg1, Table 4). On the other hand, reads obtained by reference-based classifica-tion were assembled into 249,621 contigs (Cj_contigs_cg2, Table 4). A larger number of short contigs (i.e. <200 bp) that did not have similarity to the RefSeq entries was present in Cj_contigs_cg2 than Cj_contigs_cg1 (Table 4). This result implied that the quality of the contig set tained by stepwise classification was better than that ob-tained by reference-based classification.
Next, we compared the probability of misclassification between the two approaches. We performed a competi-tive mapping of reads obtained from not-in-contact stems, Cj_nc_reads and Gm_nc_reads, separately against merged contig sets consisting of theG. maxreference tran-scriptome and either Cj_contigs_cg1 or Cj_contigs_cg2.
mapping
Cj_nc_reads
Ib_nc_reads
Cj_nc_contigs
mapping
Ib_nc_contigs
A
B
Cj_nc_reads
Ib_nc_reads
Cj_contigs_ci1
mapping
C
Cj_Ibif_reads
Ib_Cjif_reads
mapping
Ib_contigs
Cj_nc_reads
Ib_nc_reads
mapping
Cj_Ibif_reads
Ib_Cjif_reads
Cj_contigs_ci1
Ib_contigs
mapping
Cj_contigs_ci1
Ib_contigs
D
Cj_nc_reads
Ib_nc_reads
Using Cj_contigs_cg1 resulted in a higher AUC value (0.999; Table 5A) than using Cj_contigs_cg2 (0.955; Table 5B), suggesting that the stepwise classification ap-proach is better.
For the detection of differentially expressed genes during establishment of parasitic connection, the Cj_contigs_cg1 provided a more robust result than the Cj_contigs_cg2 (Table 6). We compared the number of detected differen-tially expressed genes by either i) mapping reads classified from the interface region (Cj_Gmif_reads and Gm_Cjif_ reads) separately to the C. japonica and G. max contig
sets, or ii) by mapping Cj_Gmif_reads and Gm_Cjif_reads separately to a merged contig set consisting ofC. japonica contigs and G. max contigs. When combining Cj_con-tigs_cg1 with theG. maxreference transcriptome, the dif-ferences in numbers of differentially expressed genes between the two cases (17,653 and 17,656; Table 6) were smaller than when combining Cj_contig_cg2 with the G. maxreference transcriptome (17,653 and 17,526; Table 6). Collectively, these results confirmed that the stepwise clas-sification approach resulted in a betterde novo transcrip-tome assembly, at least in the case of C. japonica, with respect to the quality of the contig set and robustness in the identification of differentially expressed genes.
Comparative gene expression profiling of the parasite plant and the host plant
Distinguishing read origins via classification allowed us to simultaneously monitor gene expression profiles of bothC. japonicaandG. maxin the interface region. We used Cj_contigs_cg1 together with the G.max reference transcriptome for mapping reads from the interface re-gion, and identified differentially expressed transcripts (Additional file 5). Expression profiles of all differentially expressed transcripts, 3,819C. japonicacontigs and 17,653 Table 3 Assessment of the accuracy in identifying
differentially expressed genes in parasitic tissue
Mapping procedure Separately onto Cj_contigs_ci1 and Ib_contigsc
To a merged set of Cj_contigs_ci1 and Ib_contigsd
Differential expression number of contigs number of contigs
Upregulated inC. japonica 284a 284a
Downregulated inC. japonica 944b 940b
Upregulated inI. balsamina 10a 10a
Downregulated inI. balsamina 530a 530a a
Member contigs are the same in all classes.b
939 transcripts were found in common.cCorresponds to Figure3C.dCorresponds to Figure3D.
Table 2 Assessment for the rate of misclassification of reads by mapping Cj_nc_reads and Ib_nc_reads onto two transcript sets
A. Contig set Merged set of Cj_nc_contigs and Ib_nc_contigs
Classification Reads mapped ontoC. japonica(%)a Reads mapped onto
I.balsamina(%)a AUCb
Mapped reads Number of reads (%) 0.981
Cj_nc_reads 76,775,986 2,712,459
(67.3) (2.38)
Ib_nc_reads 195,363 71,599,224
(0.22) (80.9)
B. Contig set Merged set of Cj_contigs_ci1 and Ib_contigs
Classification Reads mapped ontoC. japonica(%)a Reads mapped onto
I.balsamina(%)a AUCb
Mapped reads Number of reads (%) 0.995
Cj_nc_reads 73,819,654 442,526
(64.7) (0.39)
Ib_nc_reads 271,929 71,471,262
(0.31) (80.8)
C. Contig set Merged set of Cj_contigs_ci1 and Ib_contigs
Classification Reads mapped ontoC. japonica(%)a Reads mapped onto
I.balsamina(%)a AUCb
Mapped reads Number of reads (%) 0.995
Cj_nc_reads 58,501,463 324,744
(55.3) (0.28)
Ib_nc_reads 197,487 60,709,899
(0.22) (68.6)
a
Numbers indicate percentage of mapped reads to the total number of resds.b
AUC; area under receiver operating characteristic (ROC) curve.
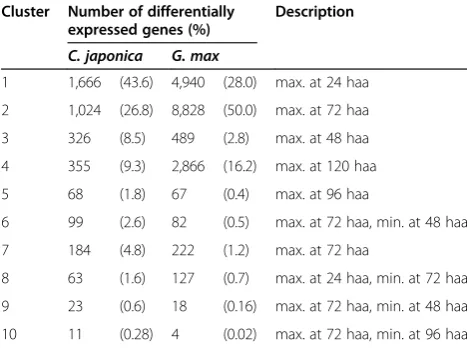
G. maxcontigs, were collectively subjected to cluster ana-lysis and classified into 10 clusters according to the expres-sion patterns across the stages (Table 7). Each parasitizing stage was characterized as follows. At 24 haa,C. japonica had completed coiling aroundG. max stem, and prehaus-torium structures formed (Figure 4B). At 48 haa, elongation ofC. japonicawas arrested, and the tip of the haustorium was localized in the cortex (Figure 4C and G). At 72 haa, elongation of C.japonica was still arrested, and the tip of the haustorium was localized in the pith (Figure 4D and H). At 96 haa, elongation ofC.japonicarestarted, and the tip of the haustorium was localized at the vascular cambium (Figure 4E and I). At 120 haa, the stem of C. japonica elongated, and and the tip of the haustorium still localized at the vascular cambium (Figure 4F and J). We focus here on the 6 clusters (cluster1, cluster 3, cluster 7, cluster 2, cluster 5 and cluster 4) whose expression profile peaked at one of the 5 stages (Figure 6A).
In several GOslim categories enriched in these stages, we found similarities as well as differences in the com-position of underlying transcripts between C. japonica
and G. max(Figure 6B). Under the GOslim category of
“Hydrolase Activity”, transcripts encoding carbohydrate-, lipid- and protein-degrading enzymes were consistently found in cluster 1 and cluster 2 of C. japonica. On the other hand, in cluster 2 of G. max, the number of con-tigs related to the ubiquitin-dependent protein catabolic process increased transiently. In cluster 4 of G. max, the number of contigs associated with defense response in-creased, i.e., disease resistance protein (TIR-NBS-LRR class) family. A fact that approximately 44% ofC. japonicacontigs and 36% ofG. maxcontigs in this category were associated with“Extracellular Region”,“Cell Wall”and“Plasma Mem-brane”reinforced the notion that various molecular interac-tions occur in the extracellular region between parasite and host. Expression of ubiquitin-proteasome pathway genes can be regarded as a part of this response, although it is not clear whether the ubiquitin-proteasome pathway plays an active role in terms of defense.
Enrichment of the GOslim category“Sequence-Specific DNA Binding Transcription Factor Activity”was observed earlier inC. japonica(cluster 3 and cluster 7) and later in
24 haa
48 haa
72 haa
96 haa
120 haa
A
B
C
D
E
F
G
H
I
Gm
Gm
Gm Gm
Cj Cj Cj Cj
h h
h
h
h
h vc
vc vc
vc
24
2h
FR
48
72
96
120
haa
0
IF
{
IF
{
IF
{
IF
{
IF
{
48h dark
{
16hL/8hD
16hL/8hD
{
16hL/8hD
{
J
Figure 4Experimental setup ofC. japonica-G. maxassociation.(A)A sampling schedule of the interface tissues at five parasitizing stages. Light and dark conditions are indicated by white and black areas, respectively. Just after attachingC. japonicatoG. maxstem, aG. maxplant withC. japonicaattached to its stem was placed under far red (FR) illumination and kept for 2 h. From 0 hour after attachment (haa) to 48 haa, a
G. maxplant withC. japonicaattached to its stem was grown in the continuous dark [30]. The 48 haa-sample was harvested in the dark. From 48 haa to 120 haa, plants were grown in the 16 h/8 h light/dark condition. Black triangles indicate the time points of sampling.(B-F)Appearance of the interface region on the stem surface ofG. max. IF, interface region; scale bars, 1 cm.(G-J)Cross sections of the interface region. Gm,G. max
G. max(cluster 5), suggesting thatC. japonicaled the initi-ation of cellular changes in the interface region. Twenty-sevenC. japonica- and sixG. maxcontigs were included in this category. Among them, Cj_contigs1.4_05837_00791 and Glyma.02G066200.1 exhibited similarity to the ERF BUD ENHANCER (EBE) gene, which positively regulates cell proliferation [27]. This observation tempted us to hypothesize that EBE plays distinct roles in the parasite and host plants at different stages of parasitism.
Enrichment of the GOslim category “Photosynthesis” was an inevitable consequence of our experimental set-ting in which plants were transferred from continuous dark to the light/dark cycle after 48 haa. The GOslim categories of “Transporter Activity” and “Transport” were enriched in cluster 4 of C. japonica and G. max, respectively, and up-regulation of various transporter genes was observed. Increase in the transcriptional activ-ity of transporter genes probably coincided with the in-crease in sink activity ofC. japonica.
Modification of the cell wall is one of the key processes in establishing a cellular connection between parasite and host. Expansin belongs to the group of cell wall modifying proteins responsible for cell wall extension under acidic
conditions. Tomato expansin gene,LeEXPA5, has been re-ported to be upregulated in root during syncytia formation by potato cyst nematode [28]. Cell wall disassembly by nematode triggers expression of host cell wall modifying proteins. To test whether a plant parasite also triggers expression of the host’s cell wall modifying proteins, we investigated the temporal difference between the genes encoding the parasite’s pectate lyase, a cell wall degrading enzyme, and the host’s expansin, a cell wall modification protein. Expression levels of 5C. japonica contigs that exhibited similarity to pectate lyase (evalue < 1e-10) peaked at 24 haa or 48 haa and then decreased (Figure 6C, left). We identified 23G. max contigs that exhibited similarity to LeEXPA5 (e value < 1e-10). The expression levels of these contigs peaked at 72-, 96- or 120-haa (Figure 6C, right). These results demonstrated that the expression of cell wall degrading enzyme genes in C. japonicapreceded the expression of expansins in G. max. Simultaneous profiling of gene expression in both parasite and host allowed us to monitor the tem-poral differences, and helped inferring the coordination or causal relationship between cellular processes in the two plants.
A
B
CjGm_if_reads
mapping
Cj_contigs_cg2
assembly
Cj_Gmif_reads2 Gm_Cjif_reads2
unmapped mapped
interface-region tissue
249,691
Gmax_275_ Wm82.a2.v1. transcript
Gmax_275_ Wm82.a2.v1. transcript
mapping for read counting mapping for
read counting
CjGm_if_reads
Cj_contigs_ci1
mapping
Cuscuta unigenes
nt
Cj_contigs_cg1
assembly
Cj_Gmif_reads1 Gm_Cjif_reads1
mapping
mapping
unmapped
unmapped mapped
mapped
mapped to Convolvulaceae
mapped
interface-region tissue
59,449
Gmax_275_Wm82.a2.v1.transcript
Gmax_275_ Wm82.a2.v1. transcript
mapping for read counting mapping for
read counting
Conclusion
We demonstrated that simultaneous analysis of gene ex-pression profiles in a non-model parasitic plant,C. japonica, and a non-model host plant, I. balsamina, can be per-formed using RNA-Seq reads obtained from an interface re-gion containing cells of both plants. We performed stepwise classification of reads using sequences of the plant species under study, plants belonging to the same genus, and,
finally, plants in the same family. Using reads classified in this way, we de novo assembled the transcriptome se-quence sets of the interface region. To confirm the anno-tation, we also assembled the transcriptome ofC. reflexa. Applying a competitive mapping method, we could assess the quality of the performed classification. This assess-ment revealed that we achieved classification of reads with a misclassification rate low enough to be used reliably for analysis of differential expression of genes. We applied this read classification method to simultaneously analyze gene expression profiles in the non-model parasitic plant C. japonicaand the model host plantG. max. We assem-bled the C. japonica transcriptome from reads classified by our stepwise classification approach. Using ourC. japonica transcriptome in combination with theG. max reference transcriptome, we were able to robustly identify differen-tially expressed genes in both parasite and host. This sim-ultaneous monitoring of gene expression in both parasitic and host plants shed new lights on coordination of cellular processes between two plants. This approach may be ap-plicable to other multi-organism systems.
Methods Plant materials
I. balsaminawas grown on soil (Sukoyaka-Baido, Yanmar Co. Ltd., Osaka, Japan) mixed with the same volume of vermiculite (GS30L, Nittai, Osaka, Japan) in a 16 h/8 h light/dark cycle at 25 °C.C. japonicaseeds were dipped in concentrated sulfuric acid for 15 min, washed with dis-tilled water and plated on wet glass filter paper (GA-100, Toyo Roshi Kaisha, Ltd., Tokyo, Japan) in the dark at 25 °C. Parasitism was induced by attaching the subapical region of C. japonica to the stem of I. balsamina and Table 4De novoassembly and annotation ofC. japonica
contigs classified in two different approaches
Cj_contigs_cg1 Cj_contigs_cg2
Library type Illumina, 74 bp
single-end
Illumina, 74 bp single-end
Assembler Velvet/Oases Velvet/Oases
Assembled reads 141,089,611 205,957,611
Number of contigs 59,449 249,621
Median contig length 325 bp 187 bp
Average contig length 648 bp 354 bp
Length distribution (%)
<200 bp 18,009 (30.3) 134,968 (54.1)
201-500 bp 19,803 (33.3) 75,199 (30.1)
501-1000 bp 9,739 (16.4) 22,305 (8.9)
>1001 bp 11,898 (20.0) 17,149 (6.9)
Length distribution of contigs no-hits-found in refseqplant (%)
<200 bp 13,986 (23.5) 114,864 (46.0)
201-500 bp 12,232 (20.6) 53,096 (21.3)
501-1000 bp 3,160 (5.3) 10,616 (4.3)
>1001 bp 952 (1.6) 2,639 (1.1)
Table 5 Assessment for the rate of misclassification of reads by mapping Cj_nc_reads and Gm_nc_reads onto two contig sets
A. Contig set Merged set of Cj_contigs_cg1 and Gmax_275_Wm82.a2.v1.transcript
Classification Reads mapped ontoC. japonica(%)a Reads mapped onto
G.max(%)a AUCb Mapped reads (number) Number of reads (%))
Cj_nc_reads 54,936,999 187 0.999
(114,056,994) (48.2) (0.00016)
Gm_nc_reads 1,791 25,880,696
(28,728,782) (0.0062) (80.9)
B. Contig set Merged set of Cj_contigs_cg2 and Gmax_275_Wm82.a2.v1.transcript
Classification Reads mapped ontoC. japonica(%)a Reads mapped onto
G.max(%)a AUCb Mapped reads (number) Number of reads (%)
Cj_nc_reads 52,486,992 191 0.955
(114,056,994) (46.0) (0.00017)
Gm_nc_reads 2,377,249 24,253,863
(28,728,782) (8.27) (84.4)
a
Numbers indicate percentage of mapped reads to the total number of resds.b
illuminating the junction with far red light (FL20S・FR-74, Toshiba, Tokyo, Japan) for 2 h [29]. After the far-red-light illumination, the plants were kept in darkness 48 h [30].
The interface region containing both C. japonica and I. balsamina tissues was harvested from the secondary C. japonica-I. balsaminaassociation (Figure 1). A subapi-cal region, 1–2 cm below the apical tip, of a 7-day-old C. japonicaseedling grown in vermiculite (GS30L, Nittai, Osaka, Japan) in a 16 h/8 h light/dark cycle at 25 °C was attached to the stem of the first 40-day-oldI. balsamina, and parasitism was induced as described above. After 14 days, the subapical region extending from the first interface region was attached to the stem of the second 40-day-old I. balsamina, and parasitized as described above. The material from the secondary interface region containing bothC. japonicaand I. balsaminatissues was sampled after the 24 h-dark treatment in the middle of
48 h-dark treatment [30]. In order to obtain not-in-contact (nc)C. japonicasamples, the sub-apical region of an 8- to 10-day-oldC. japonicawas attached to a plastic rod (diam-eter 5 mm) and subjected to the far-red light treatment and subsequent dark treatment. Subsequently, subapical region, 1–2 cm below the apical tip, was harvested. To obtain not-in-contact I. balsaminatissue,the stem of a 40-day-old I. balsamina was coiled two turns using a plastic-coated wire. Stem was harvested after the far-red light treatment and subsequent darkness treatment.
Soybean (Glycine maxcv. Fukuyutaka) was sown on soil (Sukoyaka-Baido, Yanmar Co. Ltd.) mixed with the same volume of vermiculite (GS30L, Nittai) and grown in a 16 h/8 h light/dark cycle at 25 °C. A 14-day-old G. max was parasitized by a 8- to 10-day-old C. japonica at the stem part between cotyledon and the first foliage leaf. Parasitism was induced as described above (Figure 4A). The interface region containing both C. japonica and G. maxtissues was harvested at five stages, 24 hours after attachment (haa), 48 haa, 72 haa, 96 haa and 120 haa. Three replicates were prepared for each stage.
Tomato plants (Solanum lycopersicum,cv. Moneymaker) serving as a host for C. reflexawere grown under green-house conditions (relative humidity 55%, day temperature 25 °C, night temperature 20 °C, diurnal cycle: 16 h light/8 h darkness, and light intensity 190–600 μE · m−2· s−1). The C. reflexaplants feeding on tomato stems were cut (~30 cm below the apex), transferred onto adult tomato stems, sprayed with water every 2 days, and covered with a plastic bag to facilitate the formation of haustorial connections. C. reflexastems were harvested fromC. reflexaindividuals feeding on themselves or other individuals >30 cm away from the nearest haustorial connection to a tomato host plant. All tissues were harvested with sterile razor blades, immediately frozen in liquid nitrogen, and stored at−80 °C. Table 6 Assessment of the accuracy in identifying differentially expressed genes in interface regions ofC. japonica-G. maxassociation
C.japonicaread Cj_Gmif_reads1 Cj_Gmif_reads2
G. maxread Gm_Cjif_reads1 Gm_Cjif_reads2
C. japonicacontig Cj_contigs_cg1 Cj_contigs_cg2
G. maxcontig Gmax_275_Wm82.a2.v1.transcript Gmax_275_Wm82.a2.v1.transcript
Mapping procedure Separatelya Mergedb Separatelya Mergedb
Differentially expressed genescin
C. japonicainG. max number of contigs (%)d number of contigs (%)d
3,819 3,819 10,806 10,806
(6.4) (6.4) (4.3) (4.3)
17,653 17,656 17,653 17,526
(19.9) (19.9) (19.9) (19.7)
a
Indicated reads were mapped ontoC. japonicacontig andG. maxcontig separately, and uniquely hit reads to each contig set was used to estimate gene expression level.b
Indicated reads were mapped onto a merged contig set ofC. japonicacontig andG. maxcontig. If a given read hit to wrong contigs (C. japonica
read toG. maxcontig, or vice versa) that read was excluded from the estimation of gene expression level.c
Differentially expressed genes detected by using TCC software [45] with the q-value <0.05.d
Percentage of the number of differentially expressed genes to the total number ofC. japonicaorG. maxcontigs.
Table 7 Number of differentially expressed genes in each cluster
Cluster Number of differentially expressed genes (%)
Description
C. japonica G. max
1 1,666 (43.6) 4,940 (28.0) max. at 24 haa
2 1,024 (26.8) 8,828 (50.0) max. at 72 haa
3 326 (8.5) 489 (2.8) max. at 48 haa
4 355 (9.3) 2,866 (16.2) max. at 120 haa
5 68 (1.8) 67 (0.4) max. at 96 haa
6 99 (2.6) 82 (0.5) max. at 72 haa, min. at 48 haa
7 184 (4.8) 222 (1.2) max. at 72 haa
8 63 (1.6) 127 (0.7) max. at 24 haa, min. at 72 haa
9 23 (0.6) 18 (0.16) max. at 72 haa, min. at 48 haa
RNA extraction, preparation of the sequencing library, and RNA-Seq
Total RNA extraction was performed using the Qiagen RNeasy Plant Kit (cat. # 74193, Qiagen, Netherlands) ac-cording to the manufacturer’s protocol. RNA integrity was confirmed using the Agilent 2100 BioAnalyzer (Agilent Technologies, Santa Clara, CA, USA). In exper-iments using C. japonica andI. balsamina, RNA-Seq li-braries were prepared using Illumina’s TruSeq RNA Sample Prep Kit (RS-122-2001, RS-122-2002, Illumina Inc. San Diego, CA, USA) according to the manufac-turer’s standard protocol. Three libraries were sequenced
in one full lane on the Illumina HiSeq 2000 platform, and 101-bp paired-end reads were obtained from Hokkaido System Science Co., Ltd (Sapporo, Japan). The data on C. japonica and I. balsamina reads were regis-tered in DNA Data Bank of Japan (DDBJ) Read Archive (http://trace.ddbj.nig.ac.jp/dra/) [31] [DRA:DRR021687, DRR021688 and DRR021689 in DRA002408]. RNA-Seq library of not-in-contact tissue of G. max was prepared by the same procedure.
In experiments using C. japonica and G. max, RNA-Seq libraries were prepared using NEBNext® Ultra™RNA Library Prep Kit for Illumina® and NEBNext® Poly(A)
24
1.5
1.0
0.5
0.0
-0.5
-1.0
Normalized expression
Cluster1
Cluster3
Cluster7
Cluster2
Cluster5
Cluster4
48 72 96 120 24 48 72 96 120 24 48 72 96 120 24 48 72 96 120 24 48 72 96 120 24 48 72 96 120
hour after attachment (haa)
A
B
24
48
72
96
120
24
48
72
96
120
2.0
1.0
0.0
-1.0
-2.0
Normalized expression
hour after attachment (haa)
Cj Pectate Lyase (5 contigs)
Gm Expansin (23 contigs)
C
GOslim category Plant Cluster1 Cluster3 Cluster7 Cluster2 Cluster5 Cluster4
Cj Gm Cj Gm Cj Gm Cj Gm Cj Gm Transport (BP)
Hydrolase Activity (MF) Sequence-Specific DNA Binding TF Activity (MF) Photosynthesis (BP)
Transporter (MF)
mRNA Magnetic Isolation Module (E7490S, E7530S, Illumina Inc.). Each library was sequenced on the Gen-ome Analyzer II (Illumina Inc.) in one full lane to yield 74 bp single-end reads. The data on C. japonica and G. max reads were registered in DDBJ Read Archive (http://trace.ddbj.nig.ac.jp/dra/) [31] [DRA: DRR030860, DRR030861, DRR030862, DRR030863 and DRR030864].
Total RNA extraction fromC. reflexasamples was per-formed by grinding cut plant material in liquid nitrogen with immediate addition of the TRIzol Reagent (Invitro-gen, Carlsbad, CA, USA; 0.5 mL per 100 mg tissue) as de-scribed previously [32]. After centrifugation (10,000 × g, 10 min, at 4 °C), the supernatant was transferred to a new tube, and an equal volume of phenol:chloroform:isoamyl alcohol (25:24:1, pH8.0; Roche, Basel, Switzerland) was added along with 1 μl RNasin (Promega, Fitchburg, WI, USA). The mixture was centrifuged at 10,000 × g for 10 min at 4 °C. The resulting supernatant was transferred to a new RNase-free plastic tube and extracted once with 200μL and once with 50μL of chloroform. To precipitate the total RNA, the supernatant was mixed with 2 volumes of 100% isopropanol, 1/10 volume of 3 M sodium acetate (pH 5.2), and 1 μg of linear acrylamide (Invitrogen), and the mixture was incubated for >1 h at−20 °C. After cen-trifugation (16,000 × g, 30 min, at 4 °C), the resulting pel-let was washed twice with 80% ethanol, once with 99% ethanol, air dried, and resuspended in 20μL of RNase-free water. To determine RNA quality and concentration, 1μL of the RNA samples was subjected to agarose gel electro-phoreses (2% agarose, 1× Tris-borate-EDTA [TBE] buffer) and was quantified using a NanoDrop device (Thermo Fisher Scientific, Waltham, MA, USA). The libraries were sequenced on the Illumina HiSeq 2000 platform, and 90-bp paired-end reads were obtained from the Beijing Genomics Institute (BGI; Shenzhen, China). The data of C. reflexa reads were registered in the NCBI Sequence Read Archive (http://www.ncbi.nlm.nih.gov/Traces/sra) [33] [SRA: SRR1171084].
Preprocessing of raw reads
Read sets obtained from not-in-contact tissues ofC. ja-ponica, I. balsamina, and the interface region tissues were subjected to adapter removal, and to quality filter-ing usfilter-ing CASAVA ver.1.8.1 (Illumina) [34]. The read sets were filtered against a dataset of plant transfer RNA and ribosomal RNA sequences obtained from GenBank (gbpln[1–63].seq.gz, September 30, 2013) [35]. Reads that could be matched (e value ≤1e-5) to this in-house dataset using BLASTN [36] were removed. Furthermore, read pairs spanning <175 bp were also removed. This procedure yielded 3 read sets (Cj_nc_reads, Ib_nc_reads and CjIb_if_reads; Figure 1).
Read sets obtained from the interface regions ofC. japonica and G. maxwere subjected to adapter removal, and to
quality filtering using CASAVA ver.1.8.2 (Illumina). The read sets were filtered against the transfer RNA and ribosomal RNA sequences as above. This procedure yielded read sets of the five stages (CjGm_if_reads; Figure 5 A and 5B).
Sequenced reads from samples of autofeedingC. reflexa growing on tomato samples were quality-trimmed and Illumina adapter sequences were removed using Trim-momatic [37] with default settings. PolyA-tails were re-moved from the ends of reads and read pairs with 1 or both reads <75 bp were discarded. The surviving reads were subjected to a filtering pipeline using bwa 0.75 [38] (bwa aln–n 1 and otherwise default settings, followed by bwa sampe with default settings). In order to remove po-tential contamination by the tomato host plant, reads were aligned against ITAG2.3 cDNA [39]. The reads that sur-vived this filter (i.e., neither read in a pair aligned properly to a filter sequence) were aligned against a database of common contaminants consisting of cDNA fromH. sapi-ens (GRCh37.75) as well as fungal and E. colisequences obtained from Refseq (July 25, 2014).
Assembly of contigs using reads from not-in-contact tissues
For assembly of transcriptome sets of the nc tissues of C. japonica(Cj_nc_reads) andI. balsamina(Ib_nc_reads), these read sets were used as input for the Velvet software (version 1.2.10) [18] and, subsequently, Oases (version 0.2.08) [19]. The k-mer hash length of Velvet was set to 59, and–ins length of Oases was set to 175. The resulting transcript sets are referred to as Cj_nc_contigs and Ib_nc_contigs, respectively.
Classification of the reads
Analogously, if the top five hits were Balsaminaceae entries, then the read was classified as Ib_Cjif_reads. For de novo transcriptome assembly of C. japonica and I. balsamina, we selected all read pairs where classification of the mates was identical.
C. japonicaandG. maxreads among the CjGm_if_reads were classified using two approaches (Figure 5A and B). In the first approach, CjGm_if_reads were mapped against
the contig sets — Cj_contigs_ci1 and Gmax_275_
Wm82.a2.v1.transcript.fa.gz downloaded from the Phytozo-meV10 (http://phytozome.jgi.doe.gov/pz/portal.html; match length ≥67 bp, e value <1e-20, allowing for ≤1 mismatch and 1 gap) [26]. Reads that uniquely mapped to Gmax_ 275_Wm82.a2.v1.transcript were regarded as reads origin-ating fromG. max (Gm_Cjif_reads1). Reads that uniquely mapped to Cj_contigs_ci1 were regarded as reads ori-ginating from C. japonica(Cj_Gmif_reads1). Reads that could not be mapped during this first step were mapped against unigenes ofCuscutagenus (match length≥67 bp, evalue <1e-20, identity≥90%). Reads mapped to Cuscuta-genus unigenes were regarded as those originating from C. japonica and added to Cj_Gmif_reads1. Reads that could not be mapped during this second step were used in a BLASTN search against the nt database (May 1, 2013). If the top 5 hits of a read were the entries from the Con-volvulaceae plant species, then the read was classified as Cj_Gmif_reads1.
In the second approach, reads derived fromG. maxin CjGm_if_reads were separated by mapping CjGm_if_ reads onto Gmax_275_Wm82.a2.v1.transcript. Mapped reads were regarded as those derived from G. max (Gm_Cjif_reads2). Unmapped reads were regarded as those derived from C. japonica. The resulting Cj_Gmif_ reads2 was used for assembly to obtain Cj_contigs_cg2.
De novotranscriptome assembly
Assembly of C. japonica contigs using a merged dataset of Cj_nc_reads and Cj_Ibif_reads, andI. balsamina con-tigs using a merged dataset of Ib_nc_reads and Ib_Cjif_ reads, were performed by using the Velvet software (ver-sion 1.2.10) [19] and, subsequently, Oases (ver(ver-sion 0.2.08) [20]. The k-mer hash length of Velvet was set to 59, and–ins length of Oases was set to 175. The result-ing transcript sets are referred to as Cj_contigs_ci1 or Ib_contigs, respectively. The read sets used for de novo assembly are available [DDBJ DRA: DRZ003178 and DRZ003179]. Sequence files of Cj_contigs_ci1 and Ib_con-tigs are available as Additional file 6 and Additional file 7.
In thede novo transcriptome assembly using Cj_Gmif_ reads1 and Cj_Gmif_reads2, the same assembly procedure using Velvet/Oases as described above was used. The resulting transcript sets are referred to as Cj_contigs_cg1 and Cj_contigs_cg2, respectively. Sequence file of Cj_ contigs_cg1 is available as Additional file 8.
In the de novo transcriptome assembly of C. reflexa, all read pairs from C. reflexa that survived the filtering pipeline described above were used for de novo tran-scriptome assembly using Trinity (version r20140717 with default parameters and–jaccard_clip option) [21].
Functional annotation
Cj_contigs_ci1, Cj_contigs_cg1 and Cj_contigs_cg2 were searched against the plant protein database of refseqplant (evalue <1e-5) using BLASTX [40]. GO annotations [41] were obtained from TAIR10 according to the similarity to Arabidopsis thalianagenes (ftp://ftp.arabidopsis.org/home/ tair/Genes/TAIR10_genome_release/). The contig sets were further matched against unigenes of C. pentagona [17], C. suaveolens [18], C. reflexa (SRA: SRP038020), Tryphy-saria versicolor (TrVeBC1 and TrVeBC2), Striga
her-monthica (StHeBC1 and StHeBC2), and Orobanche
aegyptiaca (OrAeBC4) (Parasitic Plant Genome Project http://ppgp.huck.psu.edu/) using BLASTN withevalue <1e-5. Ib_contigs were used for BLASTX search against the plant protein database of refseqplant (evalue <1e-5). According to the similarity to Arabidopsis genes, a GO annotation was obtained as described in Mochizuki et al. [40] using the GO dataset available at http://www.plant.osakafu-u.ac.jp/~ogata/downloadgo.html. Prediction of ORFs was performed with the OrfPredictor software [42]. Full-length transcripts were identified by testing whether both start and stop codon were detected within a contig’s se-quence. The assembled C. reflexa contigs were checked for ORFs using an in-house Python script (https://github. com/cschu/fortuna). Contigs with an ORF of at least 200 bp were then searched against the plant protein data-base of refseqplant using BLASTX. GO annotation was then attempted for all contigs that matched against refseq-plant using the same data sets described above.C. reflexa BLASTX runs were performed with the following parame-ters: e value <1e-5, ≥75% query coverage, >40% identity (identities + positives).
Gene expression analysis and identification of differentially expressed genes
BLASTN (parameter settings: same as above). RPKM values were calculated separately.
Assessment of read classification quality
To evaluate the degree of misclassification of reads with respect to their source organism, Cj_nc_reads and Ib_nc_reads were mapped to a merged transcript set consisting of Cj_contigs_ci1 and Ib_contigs using BLASTN (match length ≥90 bp; e value <1e-20, 1 mis-match and 1 gap insertion allowed). Cj_nc_reads that were mapped to Ib_contigs, and Ib_nc_reads that were mapped to Cj_contigs_ci1 were regarded as misclassi-fied. To evaluate the rate of assignment of C. japonica reads to I. balsamina, or vice versa, Cj_nc_reads and Ib_nc_reads, respectively, were mapped to a merged transcript set consisting of Cj_nc_contigs and Ib_nc_-contigs using BLASTN as described above. Cj_nc_reads that were mapped to Ib_nc_contigs as well as Ib_nc_-reads mapped to Cj_nc_contigs were regarded as mis-classified. For the binary classification of C. japonica reads and I. balsamina reads, the following 4 outcomes are possible. We defined a C. japonica read as a true positive (TP) if it was mapped to a C. japonica contig, and as a false negative (FN) if it was mapped to an I. balsaminacontig. AnI. balsaminaread that was mapped to aC. japonicacontig was defined as a false positive (FP). Finally, anI. balsaminaread that was mapped to anI. bal-saminacontig was defined as a true negative (TN). For the nomenclature ofI. balsaminareads, switch the term“C. ja-ponica”and“I. balsamina”in the definition above. The true positive rate (TPR) was defined as TP / (TP + FN) and false positive rate (FPR) as FP / (TN + FP). The ROC AUC was calculated using the R package ROCR [45]. The same pro-cedure was applied to evaluate the degree of misclassifica-tion betweenC. japonicaandG. max.
Cluster analysis
Read counts were normalized and subjected to identifi-cation of differentially expressed genes by using TCC and R software with FDR < 0.05 [46]. Clustering analysis of differentially expressed genes was performed by using function hclust from the R stats package [47].
Light microscopy
The interface tissues were fixed with formalin, acetic acid:-ethanol:water (90:5:5, v/v/v). Fixed samples were sliced into 80 – 100 micrometer-thick sections with the Vibratome (VIB-1500, Vibratome Co. Ltd., St. Louis, MO, USA). Histochemical staining of sections was performed using a 0.5% (w/v) solution of Toluindine Blue O (1B-481, Waldeck GmbH & Co., Munster, Germany) in distilled water. Stained slices were observed and photographs were taken by using the Biological Microscope BX51 (Olympus, Tokyo, Japan) with the CCD camera, VB-7010 (KEYENCE, Osaka, Japan).
Additional files
Additional file 1:Total RNA yield from equal amount of fresh tissues ofC. japonicaandI. balsamina.
Additional file 2:GO profiles of Cj_contigs_ci1 and Ib_contigs. (A) Molecular Function. (B) Cellular Component. (C) Biological Process. Black bars: Cj_contigs_ci1. Grey bars: Ib_contigs. White bars: all
Arabidopsisgenes.
Additional file 3:Similarity to the transcripts of other plants. (A)C. japonica(Cj_contigs_ci1). (B)I. balsamina(Ib_contigs). Additional file 4:Differential expression ofC. japonicacontigs (Cj_contigs_ci1) andI. balsaminacontigs (Ib_contigs) in the interface-region tissue compared to the not-in-contact tissue. Additional file 5:Differentially expressed genes ofC. japonica (Cj_contigs_cg1) andG. maxin the interface region.
Additional file 6:A multi FASTA file of the Cj_contigs_ci1 (140519_Cj_ contigs_ci1.fa).
Additional file 7:A multi FASTA file of the Ib_contigs (140519_Ib_contigs.fa).
Additional file 8:A multi FASTA file of the Cj_contigs_cg1.
Abbreviations
Cj:Cuscuta japonica; Cr:Cuscuta reflexa; Ib:Impatiens balsamina; Gm:Glycine max; nc: not-in-contact; if: interface region; RPKM: Reads per kilobase per million mapped reads; ROC AUC: Receiver operating characteristic and its area under the curve.
Competing interests
The authors declare that they have no competing interests.
Authors’contributions
DI performed experiments, bioinformatics analysis (C. japonica, I. balsamina
andG. max), light microscopy and participated in manuscript preparation. CS performed bioinformatics analysis and assembly ofC. reflexaRNA-Seq reads and participated in manuscript preparation. WZ performed experiments with
C. reflexa. YO performed assembly of RNA-Seq reads ofC. japonica. TS and TK performed sequencing and assembly ofC. japonica-G. maxinterface regions. TF performed experiments withC. japonica-G. maxinterface regions. FK conceived and designed experiment withC. reflexa, and participated in manuscript preparation. KA conceived this study, designed experiments and analyses, and participated in manuscript preparation. All authors read and approved the final manuscript.
Acknowledgements
We thank Kyoji Yamada and Tatsuya Wakasugi (Toyama University) for their generous gift ofC. japonicaseeds. We also thank Atsushi Okazawa (Osaka Prefecture University) for helpful discussion. This work was partly supported by the Grant–in–Aid for Scientific Research (A; No. 23248005) to KA, MPI–MPP internal funds to FK, and Grant–in–Aid for Scientific Research for Plant Graduate Student from the Nara Institute of Science and Technology supported by MEXT, Japan to DI.
Author details
1Graduate School of Life and Environmental Sciences, Osaka Prefecture
University, 1–1 Gakuen–Cho, Naka–Ku, Sakai, Osaka 599–8531, Japan.2Max Planck Institute of Molecular Plant Physiology, Wissenschaftspark Potsdam-Golm, Am Mühlenberg 1, Potsdam 14476, Germany.3Plant Global Education Project, Graduate School of Biological Sciences, Nara Institute of Science and Technology (NAIST), 8916–5 Takayama, Ikoma 630–0192, Japan. 4Metabolic Systems Research Team, RIKEN Center for Sustainable Resource
Science (CSRC), 1–7–22 Suehiro, Tsurumi, Yokohama 230–0045, Japan. 5Present Address: Bioinformatics Group, The Sainsbury Laboratory, Norwich
Research Park, Norwich NR4 7UH, UK.6Present Address: Department of Molecular Systems Biology (Ecogenomics and Systems Biology), Vienna University, Althanstraße 14, Vienna A–1090, Austria.
References
1. Westwood JH, Yoder JI, Timko MP, de Pamphilis CW. The evolution of parasitism in plants. Trends Plant Sci. 2010;15:227–35.
2. Barkman TJ, McNeal JR, Lim SH, Coat G, Croom HB, Young ND, et al. Mitochondrial DNA suggests at least 11 origins of parasitism in angiosperms and reveals genomic chimerism in parasitic plants. BMC Evol Biol. 2007;7:248.
3. Yoder JI, Scholes JD. Host plant resistance to parasitic weeds; recent progress and bottlenecks. Curr Opin Plant Biol. 2010;13:478–84. 4. McNeal JR, Arumugunathan K, Kuehl JV, Boore JL, Depamphilis CW.
Systematics and plastid genome evolution of the cryptically photosynthetic parasitic plant genus Cuscuta (Convolvulaceae). BMC Biol. 2007;5:55. 5. Lee KB. Structure and development of the upper haustorium in the parasitic
flowering plant Cuscuta japonica (Convolvulaceae). Am J Bot. 2007;94:737–45. 6. Nagar R, Singh M, Sanwal GG. Cell-Wall Degrading Enzymes in Cuscuta-Reflexa
and Its Hosts. J Exp Bot. 1984;35:1104–12.
7. Runyon JB, Mescher MC, De Moraes CM. Plant defenses against parasitic plants show similarities to those induced by herbivores and pathogens. Plant Signal Behav. 2010;5:929–31.
8. Christensen NM, Dorr I, Hansen M, van der Kooij TA, Schulz A. Development of Cuscuta species on a partially incompatible host: induction of xylem transfer cells. Protoplasma. 2003;220:131–42.
9. Kubo M, Ueda H, Park P, Kawaguchi M, Sugimoto Y. Reactions of Lotus japonicus ecotypes and mutants to root parasitic plants. J Plant Physiol. 2009;166:353–62.
10. Haupt S, Oparka KJ, Sauer N, Neumann S. Macromolecular trafficking between Nicotiana tabacum and the holoparasite Cuscuta reflexa. J Exp Bot. 2001;52:173–7.
11. Roney JK, Khatibi PA, Westwood JH. Cross-species translocation of mRNA from host plants into the parasitic plant dodder. Plant Physiol. 2007;143:1037–43.
12. Kim G, LeBlanc ML, Wafula EK, de Pamphilis CW, Westwood JH. Plant science. Genomic-scale exchange of mRNA between a parasitic plant and its hosts. Science. 2014;345:808–11.
13. Alakonya A, Kumar R, Koenig D, Kimura S, Townsley B, Runo S, et al. Interspecific RNA interference of SHOOT MERISTEMLESS-like disrupts Cuscuta pentagona plant parasitism. Plant Cell. 2012;24:3153–66. 14. Birschwilks M, Haupt S, Hofius D, Neumann S. Transfer of phloem-mobile
substances from the host plants to the holoparasite Cuscuta sp. J Exp Bot. 2006;57:911–21.
15. Honaas LA, Wafula EK, Yang Z, Der JP, Wickett NJ, Altman NS, et al. Functional genomics of a generalist parasitic plant: laser microdissection of host-parasite interface reveals host-specific patterns of parasite gene expression. BMC Plant Biol. 2013;13:9.
16. Vaughn KC. Dodder hyphae invade the host: a structural and immunocytochemical characterization. Protoplasma. 2003;220:189–200. 17. Ranjan A, Ichihashi Y, Farhi M, Zumstein K, Townsley B, David-Schwartz R,
et al. De novo assembly and characterization of the transcriptome of the parasitic weed Cuscuta pentagona identifies genes associated with plant parasitism. Plant Physiol. 2014;166:1186–99.
18. Jiang LJ, Wijeratnen AJ, Wijeratne S, Frage M, Meulia T, Doohan D, et al. Profiling mRNAs of Two Cuscuta Species Reveals Possible Candidate Transcripts Shared by Parasitic Plants. PLoS One. 2013;8:e.81389. 19. Zerbino DR, Birney E. Velvet: algorithms for de novo short read assembly
using de Bruijn graphs. Genome Res. 2008;18:821–9.
20. Schulz MH, Zerbino DR, Vingron M, Birney E. Oases: robust de novo RNA-seq assembly across the dynamic range of expression levels. Bioinformatics. 2012;28:1086–92.
21. Grabherr MG, Haas BJ, Yassour M, Levin JZ, Thompson DA, Amit I, et al. Full-length transcriptome assembly from RNA-Seq data without a reference genome. Nat Biotechnol. 2011;29:644–52.
22. Pruitt KD, Tatusova T, Maglott DR. NCBI reference sequences (RefSeq): a curated non-redundant sequence database of genomes, transcripts and proteins. Nucleic Acids Res. 2007;35:D61–65.
23. Lamesch P, Berardini TZ, Li D, Swarbreck D, Wilks C, Sasidharan R, et al. The Arabidopsis Information Resource (TAIR): improved gene annotation and new tools. Nucleic Acids Res. 2012;40:D1202–1210.
24. Fawcett T. ROC graphs: notes and practical considerations for data mining researchers. In: Technical Report HPL-2003-4. Palo Alto, CA: HP Labs; 2003. 25. Schmutz J, Cannon SB, Schlueter J, Ma J, Mitros T, Nelson W, et al. Genome
sequence of the palaeopolyploid soybean. Nature. 2010;463:178–83.
26. Goodstein DM, Shu S, Howson R, Neupane R, Hayes RD, Fazo J, et al. Phytozome: a comparative platform for green plant genomics. Nucleic Acids Res. 2012;40:D1178–1186.
27. Mehrnia M, Balazadeh S, Zanor MI, Mueller-Roeber B. EBE, an AP2/ERF transcription factor highly expressed in proliferating cells, affects shoot architecture in Arabidopsis. Plant Physiology. 2013;162:842–57.
28. Fudali S, Sobczak M, Janakowski S, Griesser M, Grundler FM, Golinowski W. Expansins are among plant cell wall modifying agents specifically expressed during development of nematode-induced syncytia. Plant Signal Behav. 2008;3:969–71.
29. Tada Y, Wakasugi T, Nishikawa A, Furuhashi K, Yamada K. Developmental regulation of a gene coding for a low-molecular-weight heat shock protein during haustorium formation in the seedlings of a holoparasitic plant, Cuscuta japonica. Plant Cell Physiol. 2000;41:1373–80.
30. Tada Y, Sugai M, Furuhashi K. Haustoria of Cuscuta japonica, a Holoparasitic Flowering Plant, Are Induced by the Cooperative Effects of Far-Red Light and Tactile Stimuli. Plant Cell Physiol. 1996;37:1049–53.
31. Kodama Y, Shumway M, Leinonen R. The Sequence Read Archive: explosive growth of sequencing data. Nucleic Acids Res. 2012;40:D54–56.
32. Zhang S, Sun L, Kragler F. The phloem-delivered RNA pool contains small noncoding RNAs and interferes with translation. Plant Physiology. 2009;150:378–87.
33. Wheeler DL, Barrett T, Benson DA, Bryant SH, Canese K, Chetvernin V, et al. Database resources of the National Center for Biotechnology Information. Nucleic Acids Res. 2007;35:D5–12.
34. Hosseini P, Tremblay A, Matthews BF, Alkharouf NW. An efficient annotation and gene-expression derivation tool for Illumina Solexa datasets. BMC Res Notes. 2010;3:183.
35. Benson DA, Karsch-Mizrachi I, Clark K, Lipman DJ, Ostell J, Sayers EW. GenBank. Nucleic Acids Res. 2012;40:D48–53.
36. Altschul SF, Gish W, Miller W, Myers EW, Lipman DJ. Basic local alignment search tool. J Mol Biol. 1990;215:403–10.
37. Lohse M, Bolger AM, Nagel A, Fernie AR, Lunn JE, Stitt M, et al. RobiNA: a user-friendly, integrated software solution for RNA-Seq-based transcriptomics. Nucleic Acids Res. 2012;40:W622–627.
38. Li H, Durbin R. Fast and accurate short read alignment with Burrows-Wheeler transform. Bioinformatics. 2009;25:1754–60.
39. TheTomatoGenomeConsortium. The tomato genome sequence provides insights into fleshy fruit evolution. Nature. 2012;485:635–41.
40. Mochizuki T, Ogata Y, Hirata Y, Ohki ST. Quantitative transcriptional changes associated with chlorosis severity in mosaic leaves of tobacco plants infected with Cucumber mosaic virus. Mol Plant Pathol. 2014;15:242–54. 41. Ashburner M, Ball CA, Blake JA, Botstein D, Butler H, Cherry JM, et al. Gene
ontology: tool for the unification of biology. The Gene Ontology Consortium. Nat Genet. 2000;25:25–9.
42. Min XJ, Butler G, Storms R, Tsang A. OrfPredictor: predicting protein-coding regions in EST-derived sequences. Nucleic Acids Res. 2005;33:W677–680. 43. Anders S, Huber W. Differential expression analysis for sequence count data.
Genome Biol. 2010;11:R106.
44. Ihaka R, Gentleman R. R: A language for data analysis and graphics. J Comput Graph Stat. 1996;5:299–314.
45. Sing T, Sander O, Beerenwinkel N, Lengauer T. ROCR: visualizing classifier performance in R. Bioinformatics. 2005;21:3940–1.
46. Sun J, Nishiyama T, Shimizu K, Kadota K. TCC: an R package for comparing tag count data with robust normalization strategies. BMC Bioinformatics. 2013;14:219.