R E S E A R C H
Open Access
Evaluation of serum free fatty acids in
chronic renal failure: evidence from a rare
case with undetectable serum free fatty
acids and population data
Zhen-Xian Liu
1†, Qian Hong
2,3†, Ding-Hui Peng
1†, Ying Yang
1, Wen-Li Yu
3, Hua Shui
3, Xin Zhou
1and
Song-Mei Liu
1*Abstract
Background:Free fatty acid (FFA) accumulation in proximal tubules plays a fundamental role in the progress of kidney disease. Here, we reported a rare case with undetectable serum FFAs and further evaluated the changes of serum FFAs in patients with chronic renal failure (CRF).
Methods:We analyzed the clinical data of a rare case and 574 CRF patients. The mRNA expression of lipoprotein lipase (LPL), hepatic lipase (HL) and fatty acid synthase (FASN) were determined in the rare case and 30 age-matched healthy males with qPCR.
Results:This rare case had serious proteinuria, hyperglycemia, lipid disorders and bilateral renal glomerular filtration dysfunction. Compared with healthy males, this case showed a 1.49-fold increase ofLPLexpression (P< 0.01), a 3.38-fold reduction ofHLexpression (P< 0.001), and no significant change ofFASNexpression (P> 0.05). In total, 21.6% of CRF patients showed abnormal FFAs. Biochemical parameters such as blood urea nitrogen (BUN) and creatinine (CREA) significantly differed among groups with low-, normal- or high-level-FFAs. Moreover, serum FFAs was found to be associated with BUN. FFAs decreased in the group with higher BUN (> 17.4 mmol/L) and in the group with lower estimated glomerular filtration rate (eGFR) (< 15 mL/min/1.73m2).
Conclusions:The proteinuria,HLlow expression and renal function failure may contribute to the FFA reduction, which might imply that the renal function is severely damaged.
Keywords:Chronic renal failure, Free fatty acids, Proteinuria, Glucose metabolism, Lipid metabolism
Background
Chronic kidney disease (CKD) represents an ever-increasing worldwide health problem [1]. Hypertension, obesity, diabetes and chronic glomerular diseases are risk factors for CKD. Simultaneously, severe CKD could lead to cardiovascular diseases, fracture, anemia,
hyper-tension, and other complications [2, 3]. Chronic renal
failure (CRF) would occur if renal function failed to
meet the body needs, requiring replacement therapy (i.e., renal dialysis or kidney transplantation) [4]. The causes of CKD differ by country, race and age. In the United States and the United Kingdom, end-stage kidney disease mainly results from diabetic nephropathy, while primary glomerulonephritis is the leading cause of CRF in China [5].
Free fatty acids (FFAs) are derived from triacylglycerol lipolysis governed by lipoprotein lipase (LPL) [6] and hepatic lipase (HL) [7], or de novo synthesis from acetyl-CoA, malonyl-CoA and NADPH by fatty acid synthases (FASN) [8]. In proximal tubules, FFAs act as energy sources, membrane components, and precursors of lipid mediators. FFAs could be filtered by glomeruli and
© The Author(s). 2019Open AccessThis article is distributed under the terms of the Creative Commons Attribution 4.0 International License (http://creativecommons.org/licenses/by/4.0/), which permits unrestricted use, distribution, and reproduction in any medium, provided you give appropriate credit to the original author(s) and the source, provide a link to the Creative Commons license, and indicate if changes were made. The Creative Commons Public Domain Dedication waiver (http://creativecommons.org/publicdomain/zero/1.0/) applies to the data made available in this article, unless otherwise stated. * Correspondence:[email protected]
†Zhen-Xian Liu, Qian Hong and Ding-Hui Peng contributed equally to this
work.
1Department of Clinical Laboratory, Center for Gene Diagnosis and Program
of Clinical Laboratory, Zhongnan Hospital, Wuhan University, 169 Donghu Road, Wuhan 430071, Hubei Province, China
reabsorbed into the proximal tubules through binding to albumin. In cases of severe proteinuria, hypoxia, or intoxi-cation, FFAs would accumulate in proximal tubules [9]. Excessive FFAs could be esterified with glycerides and de-posit in intracellular lipid droplets in the form of triglycer-ides, which might induce renal damage. In turn, renal dysfunction further aggravates the accumulation of FFAs in proximal tubules. FFA accumulation and overoxidation lead to podocytes structural damages, resulting in glomer-ulopathy and CRF [10]. Dyslipidemia may affect the kidney directly by lipotoxicity, as well as indirectly through in-flammation, oxidative stress, vascular injury, and hormones changes [11]. With the development of CKD, dyslipopro-teinemia becomes more pronounced and even could not be substantially improved by dialysis [12].
Abnormal FFA metabolism mediates the development of many diseases, including type 2 diabetes, cardiovascular diseases, and hypertension [13, 14], which are closely re-lated to CRF [2, 3]. However, to date, only a few studies have focused on serum FFAs and CRF, and FFA profile has been only evaluated in patients undergoing dialysis or renal transplantation. Notably, very low serum FFAs are not common in clinical and laboratory observations.
Therefore, it is of great significance to reveal the changes of serum FFAs in the context of renal failure. In this study, we reported a rare case with undetectable serum FFAs and further evaluated the changes of serum FFAs in 574 CRF patients.
Materials and methods Study subjects
A 43-year-old, male patient with undetectable serum FFAs and 574 CRF patients from May 2017 to August 2018 were recruited in this study. The average age for the 574
CRF patients was 62.9 ± 0.7 years and 64.1% (n= 368)
were males. For genetic analysis of the case, 30 age-matched healthy males (43.9 ± 0.7 years) were also en-rolled at Zhongnan Hospital of Wuhan University, China. All patients were diagnosed as CRF according to the Kid-ney Disease: Improving Global Outcomes (KDIGO) guide-lines [15]. Healthy controls were randomly selected from physical examination population who had normal labora-tory results, including liver function, kidney function, serum glucose, lipids and electrolytes, regular blood and urine tests. The exclusion criteria were diabetes, cardio-vascular diseases or other serious diseases or use of any medication. This study was approved by the Ethics Com-mittee of Zhongnan Hospital of Wuhan University and was performed according to the Declaration of Helsinki.
Clinical biochemical tests
Biochemical parameters, including serum alanine trans-aminase (ALT), aspartate aminotransferase (AST), AST/ ALT, total bilirubin (TBIL), direct bilirubin (DBIL),
unconjugated bilirubin (UBIL), total protein (TP), albu-min, globulin (GLB), gamma-glutamyl transpeptidase (GGT), alkaline phosphatase (ALP), total bile acid (TBA), superoxide dismutase (SOD), glucose (GLU), blood urea nitrogen (BUN), creatinine (CREA), uric acid, carbon dioxide (CO2), cystatin C, total cholesterol (TC),
triglyceride (TG), high-density lipoprotein cholesterol (HDL-C), low-density lipoprotein cholesterol (LDL-C), apolipoprotein A1 (ApoA1), apolipoprotein B (ApoB), lipoprotein (a) (Lp(a)), FFA, phospholipid (PLIP), K+, Na+, Cl−, Ca2+, Mg2+, phosphate and the 24-h urinary total protein (24 h-TP) were assayed using AU5831 auto-mated chemistry analyzer (Beckman, USA). Urine glu-cose and protein were determined by Urine Dry Chemical Analyzer (AX-4030, Japan).
Calculation of eGFR
The estimated glomerular filtration rate (eGFR) was cal-culated according to Chronic Kidney Disease Epidemi-ology Collaboration creatinine equation: eGFR = 141 × min (Scr /κ,1)α× max (Scr/κ, 1)-1.209
× 0.993Age× (1.018 if female), (Scr, Serum creatinine; unit, mg/dL, 1 mg/
dL = 88.4μmol /L).Where κ= 0.7 for females or 0.9 for
males;α=−0.329 for females or−0.411 for males [16].
Total RNA extraction
Total RNA was isolated from fresh white blood cells from the case and 30 healthy males using Trizol Reagent (Invi-trogen, USA) according to the manufacturer’s protocol.
Gene expression determination
cDNA was synthesized using a reverse-transcription kit with DNase treatment (TOYOBO, Japan). mRNA expres-sion of LPL, HL, FASNwas evaluated in triplicates using
the iTaq™ Universal SYBR GREEN Supermixes (BioRad,
USA) on a CFX Connect™Real-Time PCR Detection
Sys-tem (BioRad, USA) and double normalization toβ-ACTIN
and GAPDH. The primers are listed in Additional file1: Table S1.
Statistical analysis
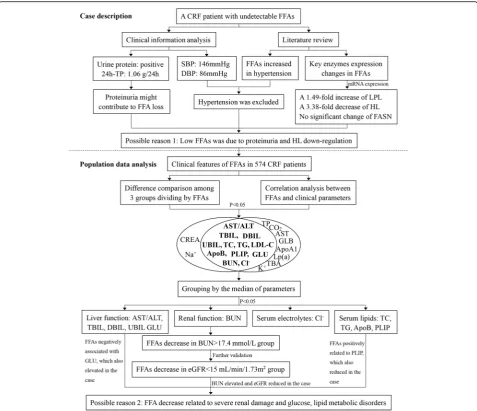
We used SPSS 20.0 to perform all statistical analyses. The flow chart of analysis is shown in Fig.1. Continuous and normally distributed variables were presented as the mean ± standard deviation (M ± SD), and skewed vari-ables were described by the median (interquartile range, IQR). The nonparametric Mann–Whitney U test was used to compare clinical parameters of CRF patients be-tween different groups. The Spearman’s rank correlation test was used for correlation analysis. All statistical tests were two-sided, and P-value < 0.05 was considered sta-tistically significant.
Results Case description
A 43-year-old male was admitted to hospital because of CRF and persistently increased serum creatinine for 7
years, ranging from 451.0–930.8μmol/L during his
hospitalization. He had a history of hypertension for 7 years and took nifedipine controlled-release tablets, and his blood pressure was 146/86 mmHg on admission. He had no diabetes, heart disease, hepatitis B virus infection or tuberculosis, and never underwent hemodialysis. For CRF treatment, he also had calcium dobesilate to protect blood vessels and improve circulation, polysaccharide-Iron(III) complex to fight anemia, sodium bicarbonate to correct acidosis, calcium acetate tablets and vitamin D3
to keep balance of calcium and phosphate metabolism,
as well as Hushen Keli, a traditional Chinese patent medicine to improve renal function.
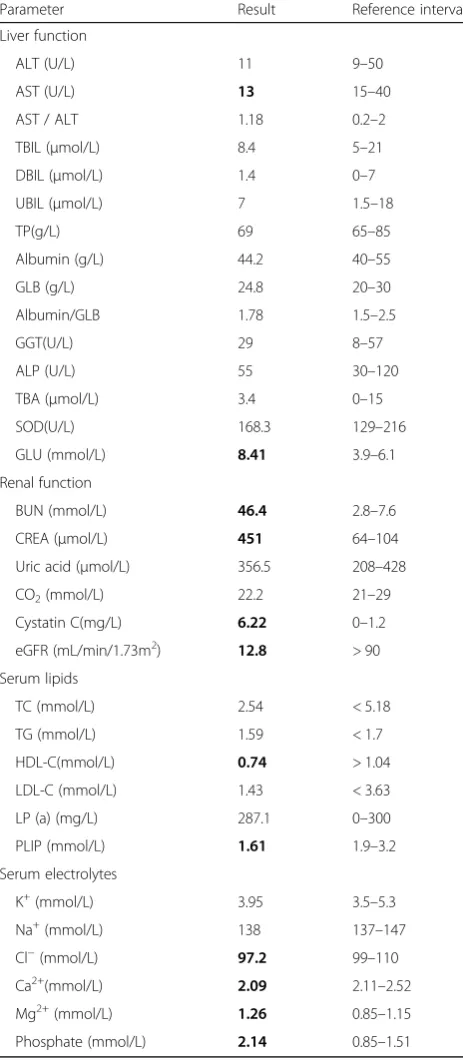
As shown in Table1, this patient had normal liver func-tion, severely impaired renal function (i.e., increased serum BUN, CREA, Cystatin C, and decreased eGFR), hypergly-cemia (GLU, 8.41 mmol/L), serum electrolyte disorders (i.e., decreased Cl− and Ca2+, and increased Mg2+, phos-phate). Interestingly, the case showed normal serum TC, TG, LDL-C, Lp(a), and decreased HDL-C, PLIP and un-detectable FFAs. Additionally, urine glucose and protein were positive, and the 24 h-TP was 1.06 g/24 h (reference interval: 0–0.15 g/24 h). Further renal emission computed tomography (ECT) exam showed: (1) glomerular filtration rate (GFR): bilateral renal GFR was 16.0 mL/min (after
cor-rection, 16.4 mL/min/1.73m2), GFR for left and right
single-kidney was 9.8 mL/min and 6.2 mL/min, respect-ively; (2) bilateral renal atrophy; (3) significantly reduction in bilateral renal blood perfusion; (4) severely impaired lateral renal glomerular filtration function; (5) delayed bi-lateral renal excretion. The color Doppler ultrasound indicated that no obvious abnormality was observed in radial arteries of both upper limbs, cephalic veins, bilateral carotid or vertebral arteries. Based on the above mentioned results, the patient was diagnosed as CRF (CKD-5) and grade-3 hypertension (extremely high risk) with proteinuria, hyperglycemia and lipid disorders.
Serum FFAs analysis of the case and literature review To confirm that the case indeed had undetectable FFAs, we tested his serum FFAs and commercial FFA quality controls for 3 times. The test results showed that quality controls had expected values, and serum
FFAs of the patient was only 0.07μmol/L at the 2nd
run detection. Next, to avoid that serum FFA concen-tration was too high to detect, we tested FFAs with diluted serum, and the results were similar to the un-diluted serum. Thus, we attempted to interpret this interesting clinical observation.
In general, FFAs are mainly contained in triglyceride-riched lipoproteins or bind to albumin in blood circula-tion [17]. Albumin-bound FFAs could be filtered through the glomeruli and accumulate in the proximal tubules in the setting of massive proteinuria [9]. Given this case had serious proteinuria (24 h-TP, 1.06 g/24 h; urine protein, positive), along with badly impaired bilat-eral renal GFR, one possible reason for the undetectable FFAs should be FFAs lost with urine protein.
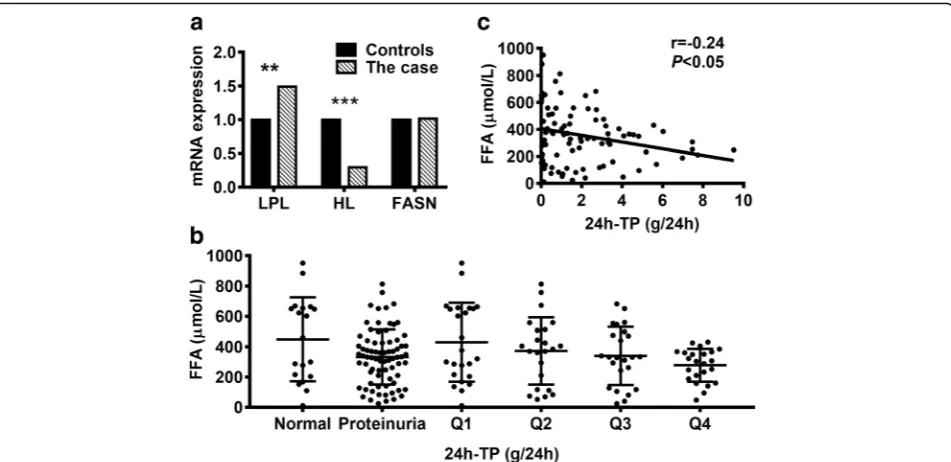
Fig2a shows the mRNA levels of LPL, HL and FASN. Compared with healthy males, the case had a 1.49-fold increase of LPL expression (P< 0.01), a 3.38-fold reduc-tion of HL expression (P< 0.001), and no significant change of FASN expression (P> 0.05). It appeared that
the fold-change of HL expression was greater than that
ofLPL. The increasedLPL expression might not be able
to compensate for the alteration triggered byHLlow
ex-pression. Thus, the significant down-regulation of HL
might be also responsible for the undetectable FFAs. Hypertension and CRF have found to be the cause and
effect in FFA metabolic disorders [2, 14, 18]. FFAs
in-creased in patients with hypertension, suggesting that a higher level of FFAs was an independent risk factor for hypertension [14,19]. To our surprise, the case had se-vere hypertension (grade-3) but with undetectable FFAs. The discrepancy between the case and previous studies might imply that FFA metabolism was complicated in CRF circumstance, and some unknown factors might also have contributed to the undetectable FFAs.
Table 1Biochemical parameters of the CRF patient with undetectable serum FFAs
Parameter Result Reference interval
Liver function
ALT (U/L) 11 9–50
AST (U/L) 13 15–40
AST / ALT 1.18 0.2–2
TBIL (μmol/L) 8.4 5–21
DBIL (μmol/L) 1.4 0–7
UBIL (μmol/L) 7 1.5–18
TP(g/L) 69 65–85
Albumin (g/L) 44.2 40–55
GLB (g/L) 24.8 20–30
Albumin/GLB 1.78 1.5–2.5
GGT(U/L) 29 8–57
ALP (U/L) 55 30–120
TBA (μmol/L) 3.4 0–15
SOD(U/L) 168.3 129–216
GLU (mmol/L) 8.41 3.9–6.1
Renal function
BUN (mmol/L) 46.4 2.8–7.6
CREA (μmol/L) 451 64–104
Uric acid (μmol/L) 356.5 208–428
CO2(mmol/L) 22.2 21–29
Cystatin C(mg/L) 6.22 0–1.2
eGFR (mL/min/1.73m2) 12.8 > 90
Serum lipids
TC (mmol/L) 2.54 < 5.18
TG (mmol/L) 1.59 < 1.7
HDL-C(mmol/L) 0.74 > 1.04
LDL-C (mmol/L) 1.43 < 3.63
LP (a) (mg/L) 287.1 0–300
PLIP (mmol/L) 1.61 1.9–3.2
Serum electrolytes
K+(mmol/L) 3.95 3.5–5.3
Na+(mmol/L) 138 137–147
Cl−(mmol/L) 97.2 99–110
Ca2+(mmol/L) 2.09 2.11–2.52
Mg2+(mmol/L) 1.26 0.85–1.15
Phosphate (mmol/L) 2.14 0.85–1.51
ALTalanine transaminase,ASTaspartate aminotransferase,TBILtotal bilirubin,
DBILdirect bilirubin,UBILunconjugated bilirubin,TPtotal protein,GLB
globulin,GGTgamma-glutamyl transpeptidase,ALPalkaline phosphatase,TBA
total bile acid,SODsuperoxide dismutase,GLUglucose,BUNblood urea nitrogen,CREAcreatinine,CO2carbon dioxide,eGFRestimated glomerular filtration rate,TCtotal cholesterol,TGtriglyceride,HDL-Chigh-density lipoprotein cholesterol,LDL-Clow-density lipoprotein cholesterol,Lp(a)
lipoprotein (a),PLIPphospholipid. Bold fonts indicated the results are abnormal
Taken together, the undetectable FFA in this CRF pa-tient was mainly caused by FFA elimination with urine
protein and down-regulation ofHL.
Population data analysis
To provide further evidence for the undetectable FFAs in this case and understand FFA changes in CRF pa-tients, we systematically evaluated the alterations of FFAs and clinical parameters in 574 CRF patients. Of them, 13.59% had decreased FFAs, 8.01% had increased FFAs, and 78.4% were normal.
Based on the reference interval of serum FFAs (129– 769μmol/L), we divided the 574 participants into three
groups: FFA-reduced (< 129μmol/L), FFA-normal, and
FFA-increased (> 769μmol/L). The average of FFAs in
the FFA-reduced group was 82.16μmol/L, and the
low-est value was 11.28μmol/L. Next, we examined the
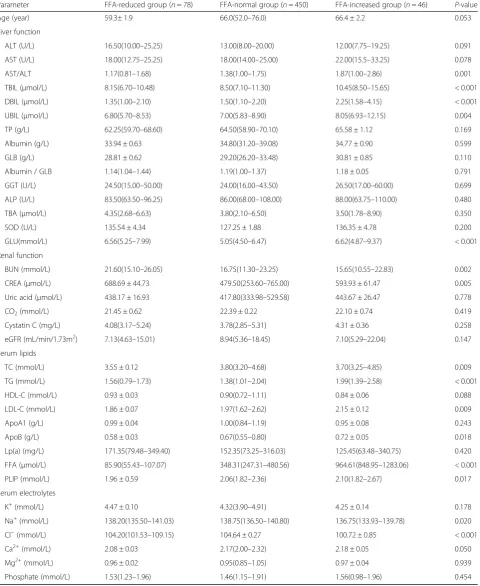
dif-ference of laboratory indicators among the three groups with K-independent nonparametric test, including liver function, kidney function, serum lipids and electrolytes (Table2). No significant difference was found in age (P=
0.053) or gender (P= 0.072) distribution. Serum AST/
ALT, TBIL, DBIL, UBIL, GLU, BUN, CREA, TC, TG,
LDL-C, ApoB, PLIP, Na+ and Cl− significantly differed
across the three groups. For instance, liver function pa-rameters (i.e., AST/ALT, TBIL, DBIL and UBIL) showed an increasing trend with FFA increasing (P< 0.01); serum GLU elevated in both the FFA-reduced group and the
FFA-increased group (P< 0.01) when compared to the
FFA-normal group. As for renal function indicators, serum BUN in the FFA-reduced group was the highest among the three groups (P< 0.01); serum CREA was ap-parently higher than that in the FFA-normal group (P< 0.01). Serum lipids differed across the three groups, except
for HDL-C, ApoA1 and Lp(a). Also, serum Na+ and Cl−
showed statistically difference across the three groups. Therefore, our data provided strong evidence that serum FFAs were closely related to the renal function, given the long-standing recommendations for clinical evaluation of renal function with serum BUN and CREA.
In addition to the BUN and CREA, the urine 24 h-TP is another important indicator for renal function. We therefore evaluated serum FFAs in 98 CRF patients who had results of urine 24 h-TP. Of the 98 patients, 19
pa-tients had normal 24 h-TP (≤ 0.15 g/24 h) and 79
pa-tients showed abnormal increased 24 h-TP. The median of 24 h-TP in this cohort was 1.395 g/24 h (IQR, 0.280– 3.115). Consequently, CRF patients with higher urine 24 h-TP were more likely to have lower concentrations of FFAs (Fig.2b), regardless of grouping by reference inter-val or the IQR range. More importantly, serum FFAs was found to be negatively associated with urine 24 h-TP (r =−0.24,P< 0.05, Fig.2c).
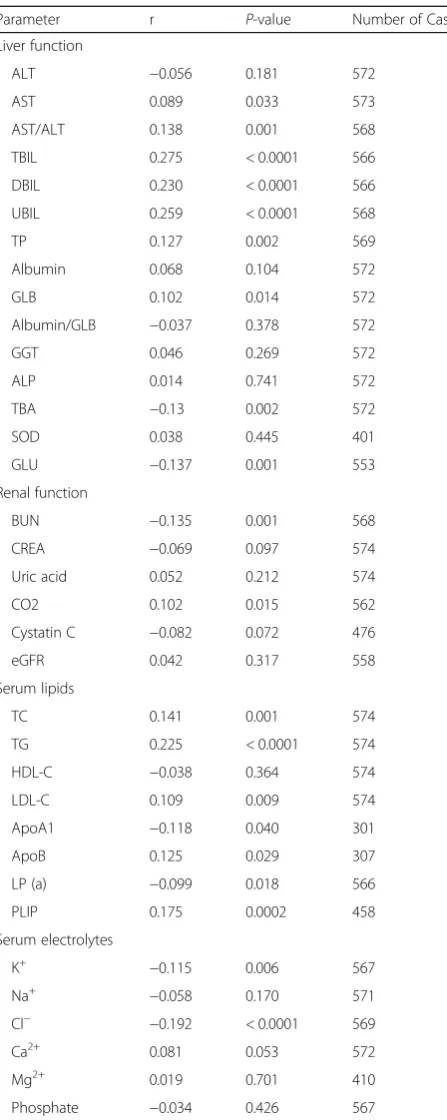
Furthermore, the Spearman’s rank correlation analysis revealed that FFAs had positive correlations with AST,
AST/ALT, TBIL, DBIL, UBIL, TP, GLB, CO2, TC, TG,
Fig. 2Analysis of gene expression and the 24-h urinary total proteins.aThe mRNA expression of three key enzymes in FFA metabolism. Compared with 30 age-matched healthy males,LPLexpression increased 1.49-fold butHLexpression decreased 3.38-fold.FASNexpression had no significant change.b
Table 2The differences of clinical parameters across three groups dividing by serum FFAs
Parameter FFA-reduced group (n= 78) FFA-normal group (n= 450) FFA-increased group (n= 46) P-value
Age (year) 59.3± 1.9 66.0(52.0–76.0) 66.4 ± 2.2 0.053
Liver function
ALT (U/L) 16.50(10.00–25.25) 13.00(8.00–20.00) 12.00(7.75–19.25) 0.091
AST (U/L) 18.00(12.75–25.25) 18.00(14.00–25.00) 22.00(15.5–33.25) 0.078
AST/ALT 1.17(0.81–1.68) 1.38(1.00–1.75) 1.87(1.00–2.86) 0.001
TBIL (μmol/L) 8.15(6.70–10.48) 8.50(7.10–11.30) 10.45(8.50–15.65) < 0.001
DBIL (μmol/L) 1.35(1.00–2.10) 1.50(1.10–2.20) 2.25(1.58–4.15) < 0.001
UBIL (μmol/L) 6.80(5.70–8.53) 7.00(5.83–8.90) 8.05(6.93–12.15) 0.004
TP (g/L) 62.25(59.70–68.60) 64.50(58.90–70.10) 65.58 ± 1.12 0.169
Albumin (g/L) 33.94 ± 0.63 34.80(31.20–39.08) 34.77 ± 0.90 0.599
GLB (g/L) 28.81 ± 0.62 29.20(26.20–33.48) 30.81 ± 0.85 0.110
Albumin / GLB 1.14(1.04–1.44) 1.19(1.00–1.37) 1.18 ± 0.05 0.791
GGT (U/L) 24.50(15.00–50.00) 24.00(16.00–43.50) 26.50(17.00–60.00) 0.699
ALP (U/L) 83.50(63.50–96.25) 86.00(68.00–108.00) 88.00(63.75–110.00) 0.480
TBA (μmol/L) 4.35(2.68–6.63) 3.80(2.10–6.50) 3.50(1.78–8.90) 0.350
SOD (U/L) 135.54 ± 4.34 127.25 ± 1.88 136.35 ± 4.78 0.200
GLU(mmol/L) 6.56(5.25–7.99) 5.05(4.50–6.47) 6.62(4.87–9.37) < 0.001
Renal function
BUN (mmol/L) 21.60(15.10–26.05) 16.75(11.30–23.25) 15.65(10.55–22.83) 0.002
CREA (μmol/L) 688.69 ± 44.73 479.50(253.60–765.00) 593.93 ± 61.47 0.005
Uric acid (μmol/L) 438.17 ± 16.93 417.80(333.98–529.58) 443.67 ± 26.47 0.778
CO2(mmol/L) 21.45 ± 0.62 22.39 ± 0.22 22.10 ± 0.74 0.419
Cystatin C (mg/L) 4.08(3.17–5.24) 3.78(2.85–5.31) 4.31 ± 0.36 0.258
eGFR (mL/min/1.73m2) 7.13(4.63–15.01) 8.94(5.36–18.45) 7.10(5.29–22.04) 0.147
Serum lipids
TC (mmol/L) 3.55 ± 0.12 3.80(3.20–4.68) 3.70(3.25–4.85) 0.009
TG (mmol/L) 1.56(0.79–1.73) 1.38(1.01–2.04) 1.99(1.39–2.58) < 0.001
HDL-C (mmol/L) 0.93 ± 0.03 0.90(0.72–1.11) 0.84 ± 0.06 0.088
LDL-C (mmol/L) 1.86 ± 0.07 1.97(1.62–2.62) 2.15 ± 0.12 0.009
ApoA1 (g/L) 0.99 ± 0.04 1.00(0.84–1.19) 0.95 ± 0.08 0.243
ApoB (g/L) 0.58 ± 0.03 0.67(0.55–0.80) 0.72 ± 0.05 0.018
Lp(a) (mg/L) 171.35(79.48–349.40) 152.35(73.25–316.03) 125.45(63.48–340.75) 0.420
FFA (μmol/L) 85.90(55.43–107.07) 348.31(247.31–480.56) 964.61(848.95–1283.06) < 0.001
PLIP (mmol/L) 1.96 ± 0.59 2.06(1.82–2.36) 2.10(1.82–2.67) 0.017
Serum electrolytes
K+
(mmol/L) 4.47 ± 0.10 4.32(3.90–4.91) 4.25 ± 0.14 0.178
Na+(mmol/L) 138.20(135.50–141.03) 138.75(136.50–140.80) 136.75(133.93–139.78) 0.020
Cl−(mmol/L) 104.20(101.53–109.15) 104.64 ± 0.27 100.72 ± 0.85 < 0.001
Ca2+(mmol/L) 2.08 ± 0.03 2.17(2.00–2.32) 2.18 ± 0.05 0.050
Mg2+(mmol/L) 0.96 ± 0.02 0.95(0.85–1.05) 0.97 ± 0.04 0.939
Phosphate (mmol/L) 1.53(1.23–1.96) 1.46(1.15–1.91) 1.56(0.98–1.96) 0.454
ApoA1apolipoprotein A1,ApoBapolipoprotein B,FFAfree fatty acid
LDL-C, ApoB, PLIP, and negative correlations with TBA,
GLU, BUN, ApoA1, Lp(a), K+and Cl−(Table3).
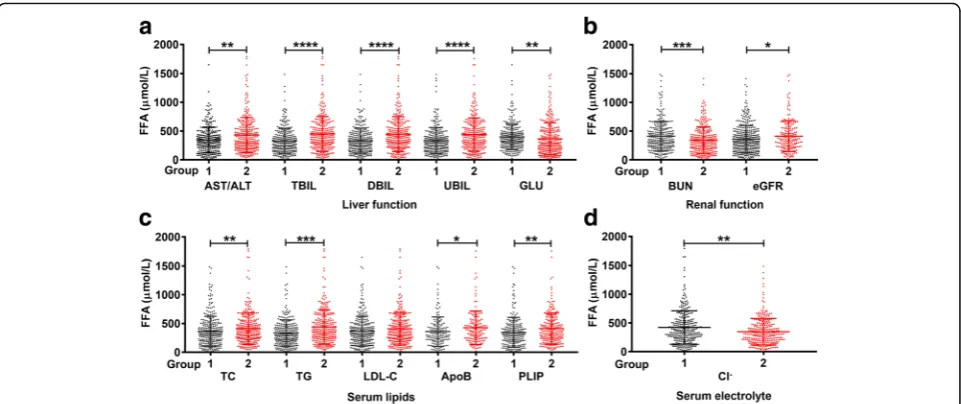
As shown in Fig. 1, serum AST/ALT, TBIL, DBIL,
UBIL, GLU, BUN, TC, TG, LDL-C, ApoB, PLIP, Cl−not
only differed significantly (all P < 0.05) across the three groups, but also were significantly associated with serum FFAs. Therefore, we divided the patients into group-1 (≤ median) and group-2 (> median) on the basis of the me-dian of the above clinical parameters to assess serum
FFAs. As illustrated in Fig.3, the Mann–Whitney U test
revealed that serum FFAs were significantly increased in group-2 (AST/ALT, TBIL, DBIL, UBIL, TC, TG, ApoB,
PLIP) and in group-1 (GLU, BUN, Cl−). In agreement
with that BUN was an important biomarker for renal function evaluation [20], of the 11 indicators, the abnor-mal rate of BUN was approximately 92.29%, while the rest was less than 50% (Additional file1: Table S2). Par-ticularly, the inverse correlation between FFAs and BUN further implied that the lower FFAs reflected poorer renal function.
Additionally, the eGFR was used to evaluate renal function for the vast majority of CKD patients in clinical practice due to convenience and cost-efficiency. The KDIGO guidelines also recommend that CRF patients
with eGFR< 15 mL/min/1.73m2 should be classified as
CKD-5 stage [15]. We therefore divided patients into two groups by eGFR: group-1 (eGFR < 15 mL/min/
1.73m2) and group-2 (eGFR-2≥15 mL/min/1.73m2).
Fig.3b demonstrates that FFAs increased in the group-1, indicating inverse correlation between FFAs and kidney function. Consistent with the population data, the case with undetectable FFAs also showed elevated GLU, BUN, and decreased eGFR, PLIP. Collectively, our data demonstrated that FFA reduction was strongly associ-ated with glucose, lipid metabolic disorders, and severe renal damages.
Discussion
In the current study, we found that a rare case with un-detectable FFAs had severe renal dysfunction, hyperten-sion, hyperglycemia, proteinuria andHLdown-regulation. Further population data analysis demonstrated that 21.6% CRF patients had abnormal serum FFAs. Specifically, more CRF patients had decreased FFAs when compared to patients with increased FFAs (13.6% vs. 8.0%). FFA re-duction could be caused by multiple factors, including loss with proteinuria, hyperglycemia, lipid metabolic disorders, severely impaired renal function and dysregulation of FFA-related enzymes.
In line with a previous report that FFAs showed renopro-tective potential, renal transplant recipients with higher plasma FFAs had lower risk of graft failure [21], our popu-lation data also suggested that lower serum FFAs indicated worse kidney function in CRF patients. The care with un-detectable FFAs had dramatically reduced eGFR (12 mL/ min/1.73m2), proteinuria, and significantly increased BUN, CREA. By telephone follow-up, we noticed that this patient had been taking hemodialysis owing to out of controlled
Table 3The correlations between serum FFAs and clinical parameters
Parameter r P-value Number of Cases
Liver function
ALT −0.056 0.181 572
AST 0.089 0.033 573
AST/ALT 0.138 0.001 568
TBIL 0.275 < 0.0001 566
DBIL 0.230 < 0.0001 566
UBIL 0.259 < 0.0001 568
TP 0.127 0.002 569
Albumin 0.068 0.104 572
GLB 0.102 0.014 572
Albumin/GLB −0.037 0.378 572
GGT 0.046 0.269 572
ALP 0.014 0.741 572
TBA −0.13 0.002 572
SOD 0.038 0.445 401
GLU −0.137 0.001 553
Renal function
BUN −0.135 0.001 568
CREA −0.069 0.097 574
Uric acid 0.052 0.212 574
CO2 0.102 0.015 562
Cystatin C −0.082 0.072 476
eGFR 0.042 0.317 558
Serum lipids
TC 0.141 0.001 574
TG 0.225 < 0.0001 574
HDL-C −0.038 0.364 574
LDL-C 0.109 0.009 574
ApoA1 −0.118 0.040 301
ApoB 0.125 0.029 307
LP (a) −0.099 0.018 566
PLIP 0.175 0.0002 458
Serum electrolytes
K+ −0.115 0.006 567
Na+ −0.058 0.170 571
Cl− −0.192 < 0.0001 569
Ca2+ 0.081 0.053 572
Mg2+ 0.019 0.701 410
serum CREA (> 1000μmol/L) for 4 months after he left hospital.
Notably, different individual FFAs had various effects on renal function. In most cells such as podocytes, the over-load of saturated fatty acid could induce insulin resistance and cell death via lipid toxicity, whereas monounsaturated fatty acid could reverse this lipotoxicity [22]. Older indi-viduals with a higher level of plasma polyunsaturated fatty acids were at lower risk of developing renal insufficiency [23]. CKD patients under hemodialytic treatment had an increase of monounsaturated fatty acids and a decrease of n-3 polyunsaturated fatty acids [18]. Earlier studies also observed that polyunsaturated fatty acids intake showed protective effects on renal function [3,24].
Hyperglycemia was a risk factor for CKD [25]. In this study, serum GLU abnormally elevated in the rare case, similar results were also found in CRF patients with in-creased or reduced FFAs. Additionally, CRF patients with higher serum GLU and lower serum FFAs exhibited ap-parent reduction of eGFR (Additional file 1: Figure S1). Our data implied that, to some extent, serum lower FFAs and hyperglycemia promoted renal dysfunction in CRF patients.
Besides, the relation of population data between FFAs with AST/ALT, TBIL, DBIL and UBIL suggested normal liver function was vital for FFA metabolism. Serum FFAs depended on the balance between FFA release from adi-pose tissue and FFA uptake/oxidation by liver and muscle tissues [26]. In our study, FFA alterations were closely re-lated to serum levels of TC, TG, LDL-C and ApoB, which
were consistent with the source and metabolism of FFAs. In terms of serum electrolytes, we only found that Cl−was inversely correlated with FFAs. Interestingly, a recent study has proved that elevated FFAs and triacylglycerol levels directly reduced blood Mg2+levels in metabolic dis-orders [27].
Nevertheless, this study could not rule out the limita-tions and challenges. Firstly, we only determined the
mRNA expression ofLPL, HLandFASNin the case and
30 healthy males, these results should be further con-firmed in a larger sample size study and covered more genes related to FFA metabolism. Secondly, owing to treatment requirements, the patients were not under standard diet, exercise and same medications, we there-fore were unable to adjust for these factors in the statis-tical analyses. It is not surprising that all these limitations did not pose a serious problem to our findings that low FFAs indicated severe renal damages based on the large population data analysis.
Conclusions
Through clinical data analysis, literature review and gene expression of FFA-related metabolic enzymes, we con-cluded that the case with undetectable FFAs might be
caused by proteinuria, HL low expression, glucose and
lipid metabolism disorders, and severe renal failure. More importantly, our study revealed the associations between serum FFAs and renal dysfunction, and highlighted the great clinical significance of monitoring serum lipids, es-pecially FFAs, for CRF patients.
Fig. 3The differences of serum FFAs between groups.aLiver function.bRenal function.cSerum lipids.dSerum electrolytes. Group-1≤the median and Group-2 > the median. The median of each parameter was: AST/ALT, 1.38; TBIL, 8.6μmol/L; DBIL, 1.5μmol/L; UBIL, 7.05μmol/L; GLU, 5.31 mmol/L; BUN, 17.4 mmol/L; TC, 3.75 mmol/L; TG, 1.41 mmol/L; LDL-C, 1.96 mmol/L; ApoB, 0.66 g/L; PLIP, 2.04 mmol/L; Cl−, 104.25 mmol/L. The cutoff value for eGFR grouping is 15 mL/min/1.73m2. *P< 0.05, **P< 0.01 ***P< 0.001, ****P< 0.0001. ALT, alanine transaminase; AST, aspartate aminotransferase; TBIL, total bilirubin; DBIL, direct bilirubin; UBIL, unconjugated bilirubin; GLU, glucose; BUN, blood urea nitrogen; eGFR, estimated glomerular filtration rate; TC, total cholesterol; TG, triglyceride; LDL-C, low-density lipoprotein cholesterol; ApoB, apolipoprotein B; PLIP, phospholipid
Additional file
Additional file 1:Table S1.Primers used in this study for qPCR.Table S2.The distributions of clinical parameters showing significant effects on serum FFAs.Figure S1.Serum FFAs and GLU exerted an opposite effect on renal function in CRF patients. (DOCX 105 kb)
Abbreviations
24 h-TP:24-h urinary total protein; ALP: Alkaline phosphatase; ALT: Alanine transaminase; ApoA1: Apolipoprotein A1; ApoB: Apolipoprotein B; AST: Aspartate aminotransferase; BUN: Blood urea nitrogen; CKD: Chronic kidney disease; CO2: Carbon dioxide; CREA: Creatinine; CRF: Chronic renal failure; DBIL: Direct
bilirubin; DBP: Diastolic blood pressure; eGFR: Estimated glomerular filtration rate; FASN: Fatty acid synthase; FFAs: Free fatty acids; GFR: Glomerular filtration rate; GGT: Gamma-glutamyl transpeptidase; GLB: Globulin; GLU: Glucose; HDL-C: High-density lipoprotein cholesterol; HL: Hepatic lipase; IQR: Interquartile range; KDIGO: Kidney Disease: Improving Global Outcomes; LDL-C: Low-density lipoprotein cholesterol; Lp(a): Lipoprotein (a); LPL: Lipoprotein lipase;
PLIP: Phospholipid; SBP: Systolic Blood Pressure; Scr: Serum creatinine; SD: Standard deviations; SOD: Superoxide dismutase; TBA: Total bile acid; TBIL: Total bilirubin; TC: Total cholesterol; TG: Triglyceride; TP: Total protein; UBIL: Unconjugated bilirubin
Acknowledgments
We are indebted to all the participants for their dedicated and conscientious collaboration. We also appreciate professor Wei Zhang (Department of Preventive Medicine, Northwestern University Feinberg School of Medicine, USA) for manuscript review.
Authors’contributions
All authors listed have made a substantial; direct and intellectual contribution to the work; and approved it for publication.
Funding
We thank the financial support from the National Natural Science Foundation of China (81472023; 81772276) and Health Commission of Hubei Province Scientific Research Project (WJ2019H070; WJ2019H005).
Availability of data and materials
The datasets used and analyzed during the current study are available from the corresponding author on reasonable request.
Ethics approval and consent to participate
Not applicable.
Consent for publication
Not applicable.
Competing interests
The authors declare that they have no competing interests.
Author details
1Department of Clinical Laboratory, Center for Gene Diagnosis and Program
of Clinical Laboratory, Zhongnan Hospital, Wuhan University, 169 Donghu Road, Wuhan 430071, Hubei Province, China.2Department of Nephrology,
Renmin Hospital of Huangmei County, Huanggang 435500, Hubei Province, China.3Department of Nephrology, Zhongnan Hospital, Wuhan University,
169 Donghu Road, Wuhan 430071, Hubei Province, China.
Received: 16 May 2019 Accepted: 1 July 2019
References
1. Jha V, Garcia-Garcia G, Iseki K, Li Z, Naicker S, Plattner B, et al. Chronic kidney disease: global dimension and perspectives. Lancet. 2013;382(9888):260–72. 2. Angeli F, Gentile G, Trapasso M, Verdecchia P, Reboldi G. Role and
prognostic value of individual ambulatory blood pressure components in chronic kidney disease. J Hum Hypertens. 2018;32(8–9):625–32. 3. Gopinath B, Harris DC, Flood VM, Burlutsky G, Mitchell P. Consumption of
long-chain n-3 PUFA, alpha-linolenic acid and fish is associated with the prevalence of chronic kidney disease. Br J Nutr. 2011;105(9):1361–8.
4. Hadden MJ, Advani A. Histone deacetylase inhibitors and diabetic kidney disease. Int J Mol Sci. 2018;19(9):2630.
5. Ng JK, Li PK. Chronic kidney disease epidemic: how do we deal with it? Nephrology. 2018;23(Suppl 4):116–20.
6. Libby AE, Wang H, Mittal R, Sungelo M, Potma E, Eckel RH. Lipoprotein lipase is an important modulator of lipid uptake and storage in hypothalamic neurons. Biochem Biophys Res Commun. 2015;465(2):287–92.
7. Cedo L, Santos D, Roglans N, Julve J, Pallares V, Rivas-Urbina A, et al. Human hepatic lipase overexpression in mice induces hepatic steatosis and obesity through promoting hepatic lipogenesis and white adipose tissue lipolysis and fatty acid uptake. PLoS One. 2017;12(12):e0189834.
8. Chong ETJ, Kuok SSE, Lee PC. Risk association, linkage disequilibrium and haplotype analyses of FASN rs4246445, rs2229425, rs2228305 and rs2229422 polymorphisms in overweight and obesity. BioImpacts. 2018;8(3):159–65. 9. Sasaki H, Kamijo-Ikemori A, Sugaya T, Yamashita K, Yokoyama T, Koike J, et al.
Urinary fatty acids and liver-type fatty acid binding protein in diabetic nephropathy. Nephron Clinical practice. 2009;112(3):c148–56.
10. Wahl P, Ducasa GM, Fornoni A. Systemic and renal lipids in kidney disease development and progression. Am J Physiol Renal Physiol. 2016;310(6):F433–45. 11. Bobulescu IA. Renal lipid metabolism and lipotoxicity. Curr Opin Nephrol
Hypertens. 2010;19(4):393–402.
12. Attman PO, Samuelsson O, Alaupovic P. Lipoprotein metabolism and renal failure. Am J Kidney Dis. 1993;21(6):573–92.
13. Li SW, Wang J, Yang Y, Liu ZJ, Cheng L, Liu HY, et al. Polymorphisms in FADS1 and FADS2 alter plasma fatty acids and desaturase levels in type 2 diabetic patients with coronary artery disease. J Transl Med. 2016;14:79. 14. Guo SX, Yan YZ, Mu LT, Niu Q, He J, Liu JM, et al. Association of Serum Free
Fatty Acids with hypertension and insulin resistance among rural Uyghur adults in far Western China. Int J Environ Res Public Health. 2015;12(6):6582–90. 15. Pasala S, Carmody JB. How to use... Serum creatinine, cystatin C and GFR. Arch
Dis Child Educ Pract Ed. 2017;102(1):37–43.
16. White CA, Allen CM, Akbari A, Collier CP, Holland DC, Day AG, et al. Comparison of the new and traditional CKD-EPI GFR estimation equations with urinary inulin clearance: a study of equation performance. Clin Chim Acta. 2019;488:189–95.
17. Vienberg SG, Kleinridders A, Suzuki R, Kahn CR. Differential effects of angiopoietin-like 4 in brain and muscle on regulation of lipoprotein lipase activity. Mol metab. 2015;4(2):144–50.
18. Turolo S, Edefonti A, Syren ML, Marangoni F, Morello W, Agostoni C, et al. Fatty acids in nephrotic syndrome and chronic kidney disease. J Ren Nutr. 2018;28(3):145–55. 19. Wang H, Li H, Hou Z, Pan L, Shen X, Li G. Role of oxidative stress in elevated
blood pressure induced by high free fatty acids. Hypertens Res. 2009;32(2):152–8. 20. Wei D, Ge M. The spatial distribution of BUN reference values of Chinese healthy
adults: a cross-section study. Int J Biometeorol. 2018;62(12):2099–107. 21. Klooster A, Hofker HS, Navis G, Homan van der Heide JJ, Gans RO, van Goor
H, et al. Nonesterified fatty acids and development of graft failure in renal transplant recipients. Transplantation. 2013;95(11):1383–9.
22. Sieber J, Jehle AW. Free fatty acids and their metabolism affect function and survival of podocytes. Front Endocrinol. 2014;5:186.
23. Lauretani F, Semba RD, Bandinelli S, Miller ER 3rd, Ruggiero C, Cherubini A, et al. Plasma polyunsaturated fatty acids and the decline of renal function. Clin Chem. 2008;54(3):475–81.
24. Malhotra R, Cavanaugh KL, Blot WJ, Ikizler TA, Lipworth L, Kabagambe EK. Dietary polyunsaturated fatty acids and incidence of end-stage renal disease in the southern community cohort study. BMC Nephrol. 2016;17(1):152. 25. Yang L, Chu TK, Lian J, Lo CW, Lau PK, Nan H, et al. Risk factors of chronic kidney
diseases in Chinese adults with type 2 diabetes. Sci Rep. 2018;8(1):14686. 26. Musutova M, Elkalaf M, Klubickova N, Koc M, Povysil S, Rambousek J, et al.
The effect of hypoxia and metformin on fatty acid uptake, storage, and oxidation in L6 differentiated Myotubes. Front Endocrinol. 2018;9:616. 27. Kurstjens S, de Baaij JHF, Overmars-Bos C, van den Munckhof ICL, Garzero V,
de Vries MA, et al. Increased NEFA levels reduce blood mg(2+) in hypertriacylglycerolaemic states via direct binding of NEFA to mg(2). Diabetologia. 2019;62(2):311–21.
Publisher’s Note