Organized by S.V.B.I.T., Gandhinagar. Available Online at www.ijpret.com215
INTERNATIONAL JOURNAL OF PURE AND
APPLIED RESEARCH IN ENGINEERING AND
TECHNOLOGY
A PATH FOR HORIZING YOUR INNOVATIVE WORK
TRAFFIC VOLUME ANALYSIS - A CASE STUDY OF PETHAPUR INTERSECTION
KAUSHAL RAVAL1, MITTAL PATEL1, VEDIKA SHAH1, SACHIN N BHAVSAR2, DIXITKUMAR PATEL2 1. Assistant Professor, civil engineering department, SVBIT, Vasan, Gujrat-382650 Dist. Gandhinagar, Vasan, Gujarat- 382650 2. Lecturer, civil engineering department, SVBIT, Vasan, Gujrat-382650 Dist. Gandhinagar, Vasan, Gujarat- 382650.
Accepted Date: 22/12/2018; Published Date: 01/02/2019
Abstract:Traffic engineering is branch of civil engineering in which movement of people and goods on the paths and that way is designed and studied by a traffic engineer. Traffic volume study is essential for counting process involving the quantity of movement per unit time at specified location. The current work studies traffic volume in the village of Pethapur Intersection at one selected priority junction. Traffic volume is studied by manual methods. This volume count study will result to ,Hourly Volume count, Vehicle type, passenger car unit and total volume of study area(Pethapur cross road) per day. That day would be useful for designing the traffic signals and deciding the time period between then and getting an idea about the movement of traffic at each crossing.
KeywordsTraffic Engineering, Pethapur, Traffic Volume Analysis
Corresponding Author: KAUSHAL RAVAL
Access Online On:
www.ijpret.com
How to Cite This Article:
Kaushal Raval, IJPRET, 2019; Volume 7 (6): 215-219 PAPER-QR CODE
SPECIAL ISSUE FOR
2
ndNATIONAL CONFERENCE ON
Organized by S.V.B.I.T., Gandhinagar. Available Online at www.ijpret.com216
INTRODUCTION
Traffic volume is one of the fundamental types of data for traffic control and the general planning process. Within the advanced traffic management system context, the role of accurate and reliable traffic volume data is important and crucial to satisfy the objectives of intelligent transportation systems [1]. For planning, designing and operation of transportation system the
first and foremost requirement is volume. Volume is simply the number of vehicles passing a section of a roadway. Expressing traffic volume as number of vehicles passing a given section of road or traffic lane per unit time will be inappropriate when several types of vehicles with widely varying static and dynamic characteristics are comprised in the traffic. The problem of measuring volume of such heterogeneous traffic has been addressed by converting the different types of vehicles into equivalent passenger cars and expressing the volume in terms of Passenger Car Unit (PCU) per hour [2].
For example, an intersection count may be conducted during the peak flow period. If so, manual count with 10-minute intervals could be used to obtain the traffic volume data. This is done during this analysis.
OBJECTIVES.
1. It is used in planning traffic operation and control of existing facilities and also for planning the new facilities.
2. It is used in the analysis of traffic patterns and trends. 3. Useful in structural design of pavement
4. Pedestrian traffic volume count is used for planning side walk, cross walks, subway and pedestrian signals.
METHODS
Manual Method
Counts are usually used to assemble data for determination of classification of vehicle, turning movements, direction of travel, different movements of pedestrian or vehicle possession etc. Most applications of manual counts need small samples of data at any known location. Manual counts are often used when the effort and cost of automatic equipment are not acceptable. Manual counts are usually used for periods of less than a day. Usually intervals are taken for manual count is 5, 10, or 15 minutes. Traffic counts through a Monday morning pick up hours and a Friday evening pick up hours may show extremely high volumes and are not usually used in analysis; therefore, counts are usually taken on a Tuesday, Wednesday, or Thursday.
Manual counts
Organized by S.V.B.I.T., Gandhinagar. Available Online at www.ijpret.com217
distinguishes it from counts by machines that can record passing vehicles automatically, which are known as “automatic traffic counts”. The count records individual vehicles by categories (i.e. a truck or car) and the direction they are travelling in. This is the reason it is called a ‘classified count’[3].
Manual Method:
Employs a field team to count and classify traffic volume.
Procedure:
1. No. of observers required depends upon no. of Lanes and type of information required. 2. More desirable to record traffic in each direction of travel by posting separate observers for
each direction.
3. For all-day counts, work in three shifts can be arranged. 4. Data is recorded by Five- dash system. (IIII)
Equipments for manual counts: 1. Watch
2. clip board
3. Pencil, rubber, sharpener 4. Data sheet
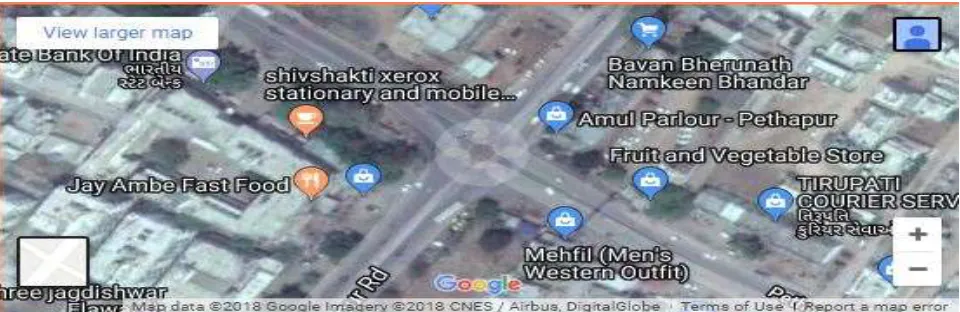
STUDY AREA
Locality Name: Pethapur City Name: Gandhinagar District: Gandhinagar State: Gujarat
Organized by S.V.B.I.T., Gandhinagar. Available Online at www.ijpret.com218
V data collection
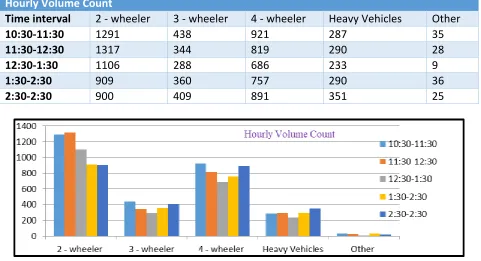
Table 1 hourly volume count
Chart 1 hourly volume count
Table 2
Time interval 10:30-11:30 11:30-12:30 12:30-1:30 1:30-2:30 2:30-3:30 PCU
2 - wheeler 604 1048 867 778 757 2027
3 - wheeler 336 308 272 320 366 1602
4 - wheeler 759 657 546 599 884 3445
Heavy Vehicles 221 214 180 204 202 3063
Other 23 25 9 31 20 108
Hourly Volume Count
Time interval 2 - wheeler 3 - wheeler 4 - wheeler Heavy Vehicles Other
10:30-11:30 1291 438 921 287 35
11:30-12:30 1317 344 819 290 28
12:30-1:30 1106 288 686 233 9
1:30-2:30 909 360 757 290 36
Organized by S.V.B.I.T., Gandhinagar. Available Online at www.ijpret.com219
Chart 2: PCU counts CONCLUSION
Traffic volume count at Pethapur intersection was done for office working hours pick and unpick hours from which it was observed that total no. of vehicle passed through this intersection is from hourly volume count it is identified that during pick and unpick hours heavy vehicles are more than in No. any other vehicles due to which problem of traffic were observed. As same from table 2 it is concluded that No of PCU for 4 wheelers are maximum than any other vehicle during the same time scale.
REFERENCES
1. Lee, S., & Fambro, D. (1999). Application of Subset Autoregressive Integrated Moving Average Model for Short-Term Freeway Traffic Volume Forecasting. Transportation Research Record: Journal of the Transportation Research Board, 1678, 179–188. doi:10.3141/1678-22. 2. Nueery Haque, Nuzhat & Halder, Sanchari & Islam, Md & Nag, Rana & Alam, Md. Ridwan & Mehedi Hassan, Md. (2013). Traffic Volume Study. 10.13140/RG.2.1.3063.7521.