Vol -7, Issue-3, July-September 2018 ISSN: 2278 7496
NEW STABILITY INDICATING RP-HPLC METHOD DEVELOPMENT FOR ANALYSIS OF ZIPRASIDONE IN BULK DRUG AND PHARMACEUTICAL DOSAGE FORM
Dr. Deepak Basedia*1, Dr. B. K. Dubey1, Prabhat Kumar Jain2, Suresh Dhakar, Amit Kumar Jain1,Zeeshan Ali1
1. Technocrats Institute of Technology- Pharmacy Education & Research, Bhopal (M.P.) 2. Scan Research Laboratories, Bhopal (M.P.)
*Corresponding Author’s E mail: [email protected]
Received 12 June 2018; Revised 18 June 2018; Accepted 24 June 2018, Available online 15 July 2018
ABSTRACT
A simple, inexpensive, rapid and novel stability indicating isocratic HPLC method has been developed and validated for quantitative analysis of ziprasidone in the bulk drug and in a pharmaceutical dosage form. An isocratic separation of ziprasidone was achieved on Thermo C₁₈ column (4.6 x 250mm, 5μ particle size) as the stationary phase with a flow rate of 1.0 ml/min and using a UV detector to monitor the eluate at 254 nm. The mobile phase consisted of Methanol: Acetonitrile (60:40v/v) enabled separation of the drug from its degradation products. The method was validated for linearity, accuracy (recovery), precision and specificity. The linearity of the method was satisfactory over the range 5-25µg/ml (correlation coefficient 0.999). Recovery of ziprasidone from the pharmaceutical dosage form ranged from 99.69 to 99.78%. ziprasidone was subjected to stress conditions (hydrolysis (acid, base), oxidation, photolysis and thermal degradation) and the samples were analyzed by this method. The forced-degradation study with ziprasidone was shown that it was degraded under acidic condition. The drug was stable under the other stress conditions investigated. The degradation products were well resolved from main peak. The forced degradation study prove the stability indicating power of the method and therefore, the validated method may be useful for routine analysis of ziprasidone as bulk drug, in respective dosage forms, for dissolution studies and as stability indicating assay method in pharmaceutical laboratories and industries.
Keywords: RP-HPLC,ziprasidone, Forced degradation, Method validated.
INTRODUCTION
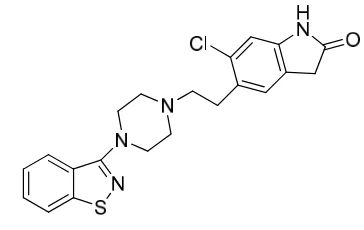
Ziprasidone hydrochloride (ZPR) chemically is 5-[2-[4-(1, 2-benz Isothiazol-3-yl)-1- Piperazinyl] ethyl]-6-chloro-1, 3-dihydro-2H-Indol-2-one hydrochloride [Fig. 1]. It has an empirical formula of C21H22Cl2N4OS and molecular weight of 449. 40 g/mol [1-2]. Ziprasidone is a new second generation or atypical antipsychotic drug that chemically differs from butyrophenone. It is used for the treatment of schizophrenia, mixed states associated with bipolar disorder and the acute mania. ZPR has a selective antagonist action for the serotonin type 2 (5-HT2), dopamine D2 and H1 histamine receptors [3-4].
Fig. 1 Chemical Structure of Ziprasidone
Literature survey for ziprasidone revealed several analytical methods based on different techniques, viz, LC-MS[5-7] assay for their quantification in plasma and brain, high performance liquid chromatography (HPLC)[8-10] method for simultaneous determination of ziprasidone in capsule formulation, and HPLC-UV[11] methods for determination ziprasidone in human plasma and urine, LC[12] with fluorescence for determination of plasma ziprasidone, and capillary zone electrophoresis[13] for determination of ziprasidone in pharmaceutical formulations. None of the reported procedures enables analysis of the ZPR alone in pharmaceutical dosage forms in the presence of their degradation products. This manuscript describes the development and validation, in accordance with ICH guidelines [14], of a rapid, economical, precise and accurate stability-indicating isocratic reversed phase HPLC method for analysis of ZPR in the presence of its degradation products. This paper mainly deals with the forced degradation of ZPR under the stress conditions such as acidic and basic hydrolysis, oxidation, heat, light and validation of the method for accurate quantification of ZPR in the bulk drug and pharmaceutical dosage form.
EXPERIMENTAL
Chemicals and reagents
Chromatography
A high performance liquid chromatographic system from Waters comprising of manual injector, waters 715 pump for constant flow and constant pressure delivery and U.V. vis. Detector connected to software data Ace for controlling the instrumentation as well as processing the data generated was used. The chromatographic analysis was performed by using a mobile phase of Methanol: Acetonitrile (60:40v/v). These were filtered through 0.45μ membrane filter and degassed by sonication before use. The mobile phase was pumped isocratically at a flow rate of 1.0ml/min during analysis at ambient temperature. The run time was set at 10 min and the volume of injection was 20μl and eluent was detected at 254 nm on a Thermo C₁₈ column (4.6 x 250mm, 5μ particle size).
Analysis of dosage form
Twenty capsules were taken and their average weight was determined. They are crushed to fine powder; amount equal to 20 mg of Ziprasidone was taken in 100-ml volumetric flask. The volume is made up to the mark by mobile phase and filtered by whatmann filter paper (no.41) and the filtrate was used to prepare samples of different concentration.
Forced degradation study
To study the effect of acid, 10 mg of pure drug sample was taken into a 50 ml round bottom flask, 10 ml of 0.1 M HCl solution was added and contents were mixed well and kept for constant stirring for 8 h at 80ºC. Samples were withdrawn and diluted to get 10 µg/ml subjected to HPLC and calculate the percentage degradation using calibration curve.
To study the effect of alkali, 10 mg of pure drug sample was taken into a 50 ml round bottom flask, 10 ml of 0.1 M NaOH solution was added and contents were mixed well and kept for constant stirring for 8 h at 80ºC. Samples were withdrawn and diluted to get 10 µg/ml subjected to HPLC and calculate the percentage degradation using calibration curve.
To study the effect of oxidizing conditions, 10 mg of pure drugs sample was taken into a 50 ml round bottom flask, 10 ml of 3% hydrogen peroxide solution was added, and contents were mixed well and kept for constant stirring for 24 hr at room temperature. Samples were withdrawn and diluted to get 10 µg/ml subjected to HPLC and calculate the percentage degradation using calibration curve.
METHOD VALIDATION
U.V. vis detector. To test linearity, test solutions of ZPR were prepared at six concentrations 5-25µg/ml. Each solution was injected in triplicate and calibration graphs were obtained by plotting peak area against concentration. Linearity was checked over the same concentration range on three consecutive days. RSD (%) of the slope and Y-intercept of the calibration plot were also calculated. The limits of detection (LOD) and quantification (LOQ) for ZPR were determined, as the amounts for which signal-to-noise ratios were 3:1 and 10:1, respectively, by injecting a series of dilute solutions of known concentration. Precision, as RSD (%) was determined by measuring the concentration of drug in the injection six times. Intermediate (inter-day) precision was evaluated by two analysts on different days in the same laboratory. The accuracy of the method was studied by measurement of recovery after adding known amounts of the drug (80, 100 and 120% of the label claim of 20mg ZPR per capsule) to the placebo. Three samples were prepared for each recovery level and results were calculated by use of the calibration plot. The stability of ZPR and sample solutions (at ambient temperature) were tested by analysis after 24, 48, and 72 h, comparison of the results with those obtained from freshly prepared standard solutions and calculation of RSD.
RESULTS AND DISCUSSION
Optimization of chromatographic conditions
The primary objective in developing this stability indicating HPLC method was to achieve resolution between ZPR and its degradation products. To achieve this, Waters with U.V. vis. detector and C18 column was employed for envisaged work. Combination of Methanol: Acetonitrile (60:40v/v) as mobile phase was attempted for quantitation of ZPR with acceptable system suitability parameters (RT, tailing factor, number of theoretical plates and HETP) at 254nm as detection wavelength. Linearity was found 5-25 µg/ml with correlation coefficient r2 = 0.999 having equation as: AUC = 80.42Conc. +30.28. The column temperature was 25°C. The tailing factor for ZPR was <2 and retention times were approximately 6.12 ± 0.5 min for main peak and less than 10 min for the degradation products (Fig.2). This low total runs time resulted in high productivity and low cost of analysis as per sample.
(A) (B)
Forced degradation study
Singh and Bakshi 15 suggested target degradation of 20– 80% when establishing the stability-indicating
properties of analytical methods, because even intermediate degradation products should not interfere with any stage of drug analysis. Although conditions used for forced degradation were adjusted to achieve degradation in this range, this could not be achieved for conditions other than exposure to acid, base and oxidising agent, even after long exposure. Peak purity test results confirmed the ZPR peak was homogeneous under all the stress conditions tested. The mass balance of ZPR in stress samples was close to 100% and, moreover, assay of unaffected ZPR in the injection confirmed the stability-indicating nature of the method. The results from forced degradation studies are summarized in Table 1. Chromatographic peak-purity data were obtained from the spectral analysis report; peak purity greater than 99 is indicative of a homogeneous peak. The peak purity for ZPR from degradation studies was in the range 99.9-100.0, indicating homogeneous peaks and thus establishing the specificity of the method. No peaks co-eluted with the ZPR peak, suggesting the method enabled specific analysis of ZPR in the presence of its degradation products.
Table 1. Results of Forced degradation studies Stress conditions Drug recovered
(%)
Drug decomposed (%)
Standard drug 99.50 0
Acidic hydrolysis 85.45 14.55
Alkaline hydrolysis 83.21 16.79 Oxidative degradation 80.12 19.88
Method validation
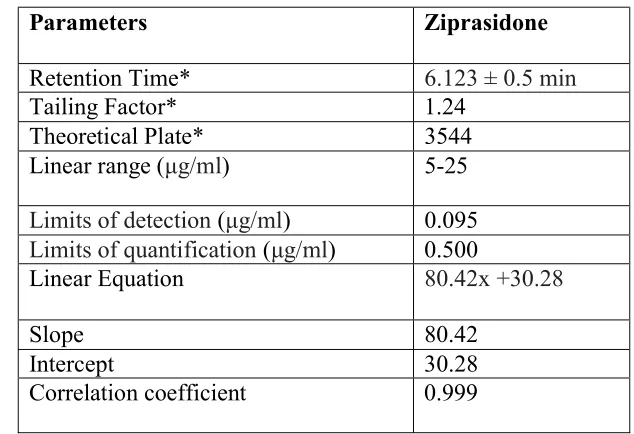
Table 2: Results from regression analysis and system suitability data
Parameters Ziprasidone
Retention Time* 6.123 ± 0.5 min
Tailing Factor* 1.24 Theoretical Plate* 3544 Linear range (μg/ml) 5-25
Limits of detection (μg/ml) 0.095
Limits of quantification (μg/ml) 0.500
Linear Equation 80.42x +30.28
Slope 80.42
Intercept 30.28
Correlation coefficient 0.999
*Mean of six readings
Table 3. Result of precision of test method of Ziprasidone
Std. Conc. (µg/ml) Repeatability Intermediate precision
Day To Day Analyst To Analyst
5 100.2 99.80 99.26
10 102.7 103.9 100.19
15 99.60 102.3 99.80
20 101.00 100.5 99.02
25 100.19 100.9 100.12
Mean 100.738 101.48 99.678
S.D. 1.205 1.632 0.519
% R.S.D. 1.196 1.608 0.520
* Mean of fifteen determinations (3 replicates at 5 concentration level) Table 4. Recovery of Ziprasidone
Level of
addition Std. Drug sol. Added (µg/ml) % Mean* recovered
80 6 99.56
100 12 99.83
120 18 99.96
CONCLUSION
The method developed for quantitative analysis of Ziprasidone is rapid, precise, accurate and selective. Peak purity studies under all the stress conditions showed the drug peak to be pure and hence the method is stability indicating. In other words it can be entioned that the method developed can be utilized for the successful quantification of the drug in presence of its degradation product and excipients. The method was completely validated and satisfactory results were obtained for all the characteristics tested. The method is stability-indicating and can be used to assess the stability of ziprasidone in the bulk drug. The method can be conveniently used for routine analysis of ziprasidone as bulk drug, in respective dosage forms, for dissolution studies and as stability indicating assay method in pharmaceutical laboratories and industries.
REFERENCE
1. J.R. Kristin (Ed.), The Merck Index, 14th ed., Merck and Co., Inc, Whitehouse Station. NJ, 2013, p. 4336.
2. Gennao, A.R., 2000. Remington, The Science and Practice of Pharmacy, 20th ed. Lippincott, Williams & Wilkins, Baltimore, MD, Philadelphia.
3. Brunton, L.L., Lazo, J.S., Parker, K.L., 2006, Goodman and Gilman’ The Pharmacological Basis of Therapeutics, 11th ed. Mc Graw-Hill, New York.
4. Sweetman.S.C, Eds, In: Martindale, The extra pharmacopoeia, 33th Edition, Royal pharmaceutical press, Londan, 295.
5. Al-Dirbashi OY, Aboul-Enein HY, Al- Odaib A. R. Rapid liquid chromatographytandemmass spectrometry method for quantification of ziprasidone in human plasma., Biomed Chromatogr 2006;April 20(4):365-8.
6. Zhang G, Terry AV Jr, Bartlett MG. Determination of the lipophilic antipsychotic drug ziprasidone in rat plasma and brain tissue using liquid chromatography-tandem mass spectrometry. Biomed Chromatogr 2008;22:770-8.
7. Aravagiri M, Marder SR, Pollock B. Determination of ziprasidone in human plasma by liquid chromatography-electrospray tandem mass spectrometry and its application to plasma level determination in schizophrenia patients. J Chromatogr B Analyt Technol Biomed Life Sci 2007;847:237-44.
determination of ziprasidone in bulk powder and in pharmaceutical formulations., Biomed Chromatogr 2004 April;18(3):143-9.
9. Singh A, Rao BM, Deshphande GR, Sangaraju S. A Rapid Stability-Indicating LC Method for Ziprasidone Hydrochloride Chromatographia 2007;65:191-196.
10.Sudha Rani B, Reddy PV, Estimation of Ziprasidone Hydrochloride Monohydrate in Bulk and Capsules by Reverse Phase HPLC. E J Chem 2006;3:169-72.
11.Edgar PS, Lewis C, Kathryn J, Robert JF. Ther Drug Monit 2005;27:226.
12.Suckow RF, Fein M, Correll CU, Cooper TB. Determination of plasma ziprasidone using liquid chromatography with fluorescence detection. J Chromatogr B 2004;799:201-8.
13.Farina C, Kremser L, Raggi MA, Kenndler E. Determination of Ziprasidone in pharmaceutical formulations by capillary zone electrophoresis. J Pharmaceut Biomed Anal 2008;46:471-6. 14.Drug Information Branch (HFD-210), Validation of analytical procedure: Meth-odology. Step
4.In: ICH Harmonized Tripartite Guidelines Q2B.Center for Drug Evaluation and Research,Rockville MD, 6 Nov, 1996.