R E S E A R C H A R T I C L E
Open Access
Investigation of publication bias in meta-analyses
of diagnostic test accuracy: a meta-epidemiological
study
W Annefloor van Enst
1,2*, Eleanor Ochodo
2, Rob JPM Scholten
1,2,3, Lotty Hooft
1,2,3and Mariska M Leeflang
2Abstract
Background:The validity of a meta-analysis can be understood better in light of the possible impact of publication bias. The majority of the methods to investigate publication bias in terms of small study-effects are developed for meta-analyses of intervention studies, leaving authors of diagnostic test accuracy (DTA) systematic reviews with limited guidance. The aim of this study was to evaluate if and how publication bias was assessed in meta-analyses of DTA, and to compare the results of various statistical methods used to assess publication bias.
Methods:A systematic search was initiated to identify DTA reviews with a meta-analysis published between September 2011 and January 2012. We extracted all information about publication bias from the reviews and the two-by-two tables. Existing statistical methods for the detection of publication bias were applied on data from the included studies.
Results:Out of 1,335 references, 114 reviews could be included. Publication bias was explicitly mentioned in 75 reviews (65.8%) and 47 of these had performed statistical methods to investigate publication bias in terms of small study-effects: 6 by drawing funnel plots, 16 by statistical testing and 25 by applying both methods. The applied tests were Egger’s test (n = 18), Deeks’test (n = 12), Begg’s test (n = 5), both the Egger and Begg tests (n = 4), and other tests (n = 2). Our own comparison of the results of Begg’s, Egger’s and Deeks’test for 92 meta-analyses indicated that up to 34% of the results did not correspond with one another.
Conclusions:The majority of DTA review authors mention or investigate publication bias. They mainly use suboptimal methods like the Begg and Egger tests that are not developed for DTA meta-analyses. Our comparison of the Begg, Egger and Deeks tests indicated that these tests do give different results and thus are not interchangeable. Deeks’test is recommended for DTA meta-analyses and should be preferred.
Keyword:Publication bias, Diagnostic test accuracy, Funnel plot, Meta-analyses, Small study-effects
Background
When the decision to publish the results of a study de-pends on the nature and direction of the results, publi-cation bias arises. There are many forms and reasons for publication bias such as time-lag bias (due to delayed publication), duplicate or multiple publications, outcome reporting bias (selective reporting of positive outcomes)
and language bias [1-6]. These forms of biases tend to have more effect on small studies and contribute to the
phenomenon of “small study-effects” [7]. This means
that published studies with small sample sizes tend to have larger and more favourable effects compared to studies with larger sample sizes. This is a threat to the validity of a systematic review and its meta-analyses [8].
For intervention reviews graphical and statistical methods have been developed to investigate if the results of the meta-analyses of the review might be affected by publication bias in terms of small study-effects. A well-known graphical method is the funnel plot examination [9]. This method aims to construct a scatter plot of the * Correspondence:[email protected]
1Dutch Cochrane Centre and Department of Clinical Epidemiology, Biostatistics and Bioinformatics, Academic Medical Center, Amsterdam, The Netherlands
2
Department of Clinical Epidemiology, Biostatistics and Bioinformatics, Academic Medical Center, Amsterdam, The Netherlands
Full list of author information is available at the end of the article
study effect sizes on the horizontal axis against some measure of each study’s size or precision on the vertical axis. The dots in this plot together look like an inverted funnel. An asymmetric funnel is an indication for publi-cation bias. Since the plot gives a visual relationship be-tween the effect and study size, its interpretation is subjective. This is not an issue when statistical tests are used to detect funnel plot asymmetry. There are eight tests available [10], but the test of Begg [11], and the test of Egger [12] are probably most common. They have been cited more than 2,500 (Begg) and 7,300 times (Egger) [13]. The test of Begg assesses if there is a sig-nificant correlation between the ranks of the effect esti-mates and the ranks of their variances. The test of Egger uses linear regression to assess the relation between the standardized effect estimates and the standard error (SE). For both tests a significant result is an indication that the results might be affected by publication bias. These and other methods have been developed especially for systematic reviews of intervention studies and are not automatically suitable for reviews of diagnostic test accuracy (DTA) studies [9].
DTA meta-analyses have different characteristics mak-ing assessment of the potential for publication bias more complicated than for intervention reviews. The diagnos-tic odds ratio (DOR) usually takes high values, while intervention effects are usually quite small. Secondly, the SE of the DOR depends on the proportion of posi-tive tests, but this proportion is influenced by the vari-ation in threshold amongst different studies. Thirdly, the number of diseased and non-diseased patients are usually unequally divided, which reduces the precision of a test accuracy estimate while in RCTs equal num-bers of participants are allocated to an intervention or control group. Investigating whether meta-analyses of DTA studies have been influenced by publication bias in terms of small study-effects is challenging [14]. Even diagnostic meta-analyses free of publication bias might have an asymmetric funnel plot due to other reasons like the threshold effect. In addition, bivariate meta-analysis is recommended for DTA meta-analyses [13] but bivariate methods for the detection of publication bias are currently not available. Hence, the DOR is used as an univariate alternative to detect publication bias, but not for the final meta-analysis that assesses the accuracy.
Knowledge of the mechanisms that may induce publi-cation bias in diagnostic studies or empirical evidence for the existence of publication bias is scarce. Selective publication of accuracy studies based on the magnitude of the sensitivity or specificity doesn’t seem to be very plausible. In addition, what parameter is most important (and thus driving possible selective publication) depends also on the place of the test in the clinical pathway
and it’s role [15]. Korevaar et al. compared prospective registered diagnostic studies to the publications. They concluded that failure to publish and selective publica-tion were prevalent in diagnostic accuracy studies but the dataset was too small to draw firm conclusions [16]. Brazelli and colleagues, however, tracked a cohort of conference abstracts and did not find evidence of publication bias in the process that occurs after abstract acceptance [17].
In 2002, Song and colleagues proposed that tests de-veloped for intervention reviews, like Begg’s and Egger’s methods could also be used to detect publication bias in DTA reviews. They suggested to use the natural loga-rithm of the DOR (lnDOR) and plot it against its variance or SE and test for asymmetry [18]. In 2005, however, Deeks and colleagues conducted a simulation study of tests for publication bias in DTA reviews. They concluded that existing tests that use the SE of the lnDOR can be seriously misleading and often have false positive results [19]. The Cochrane Handbook for Sys-tematic Reviews of Diagnostic Test Accuracy explicitly mentions not to use methods like the Begg or Egger tests and argues that it is best to use the test proposed by Deeks [14]. This test has been developed especially for test accuracy reviews and proposes plotting the lnDOR against 1/effective sample size (ESS)1/2and test-ing for asymmetry of this plot. The ESS is a function of the number of diseased (n1) and non-diseased (n2) par-ticipants: (4n1*n2)/(n1+ n2). The ESS takes into account the fact that unequal numbers of diseased and non-diseased reduce the precision of the test accuracy esti-mates [19]. Using the ESS instead of total sample size will reduce the unequal numbers of diseased and non-diseased and thereby enhance the precision of the accuracy estimates. The Cochrane Handbook, however, points out that even Deeks’test has low power to detect small study-effects when there is heterogeneity in the DOR. As hetero-geneity in DTA reviews is the rule rather than the excep-tion the Cochrane Handbook warns the authors against misinterpretation of this test [14].
about the assessment of publication bias in DTA reviews led us to following objectives.
The primary objective of this study was to assess which existing tests for publication bias have been used and to what extent the results of these tests have been incorporated in the review. A second objective was to compare the results of existing methods for the detec-tion of publicadetec-tion bias in non-simulated data to assess if these various methods would provide similar results.
Methods
Study selection
MEDLINE was searched through the interface of PubMed for DTA reviews published between September 2011 and January 2012. The search was performed in February 2012 by one author (EO) using a search filter for systematic re-views available from PubMed combined with a meth-odological filter for DTA studies: (systematic[sb] AND (("diagnostic test accuracy" OR DTA[tiab] OR "SENSITIV-ITY AND SPECIFIC"SENSITIV-ITY"[MH] OR SPECIFICIT*[TW] OR "FALSE NEGATIVE"[TW] OR ACCURACY[TW]))) [20].
Eligibility criteria
Articles were eligible for inclusion if they systematically assessed the diagnostic accuracy of a test or biomarker and were published in English. Methods to investigate publication bias are developed to investigate publication bias in meta-analyses [14]. Therefore, the selection was further limited to reviews that included a meta-analysis. Availability of the two-by-two tables of the included studies was not amongst the inclusion criteria to gener-ate a representative cohort of reviews without possible selection on high level of reporting and perhaps review quality [21]. Studies that assessed the accuracy by means of individual patient data were excluded as the method-ology of such studies differs from those of meta-analyses on a study level.
Definitions of assessment of publication bias
In determining if authors would assess publication bias in their reviews, we scored if authors described a method how they would investigate publication bias like drawing a funnel plot or performing a test for publication bias. If the methods were lacking but the results of a publication bias assessment were described, it was also scored as an investigation of publication bias. We regarded the results of the assessments as being in-corporated in the discussion of the reviews when the au-thors described how publication bias might have affected the results of their reviews.
Data extraction
An online standardized data extraction form was used to extract data. We first piloted the form among all team
members. After everyone agreed on the data-extraction form, the actual extraction was then done by one re-viewer (WE). An online randomization program selected a random sample of one third of the reviews that was checked by a second reviewer (ML, FW, RS). In case the number of differences between reviewers was <3%, no further data checking was done. Disagreements were re-solved by discussion.
For the first objective, data was extracted on all re-ported matters concerning assessing publication bias: if the authors had planned to assess or assessed publica-tion bias and the described methods, the number of studies that were included in the test, results of the test, and consideration of the test results with the interpret-ation of the pooled results. When authors had no intention to test for publication bias, the review was screened to find a reason for this and if the possible threat of publication bias was discussed or considered to formulate the conclusion. For the second objective, the two-by-two tables (true positives, false positives, false negatives, true negatives) were extracted when reported in the reviews or when they could be derived from other results (e.g. number of diseased and non-diseased com-bined with the sensitivity or specificity).
Comparison of tests for publication bias
The secondary objective of this study was to assess the concordance of publication bias test results in empirical data. We applied three univariate tests: the Begg test and Egger test because these are cited frequently, and Deeks’test because this test has been developed for DTA meta-analyses and is currently recommended in the Cochrane DTA Handbook [14]. The tests were performed as follows:
Begg’s test: rank correlation of the lnDOR with the variance of the lnDOR [11];
Egger’s test: linear regression of lnDOR with the standard error of the lnDOR weighted by the inverse variance of the lnDOR [12];
Deeks’test: linear regression of lnDOR with 1/ESS1/2 weighted by the ESS [19].
patients. Analyses were performed in the statistical pro-gram R [22].
Results
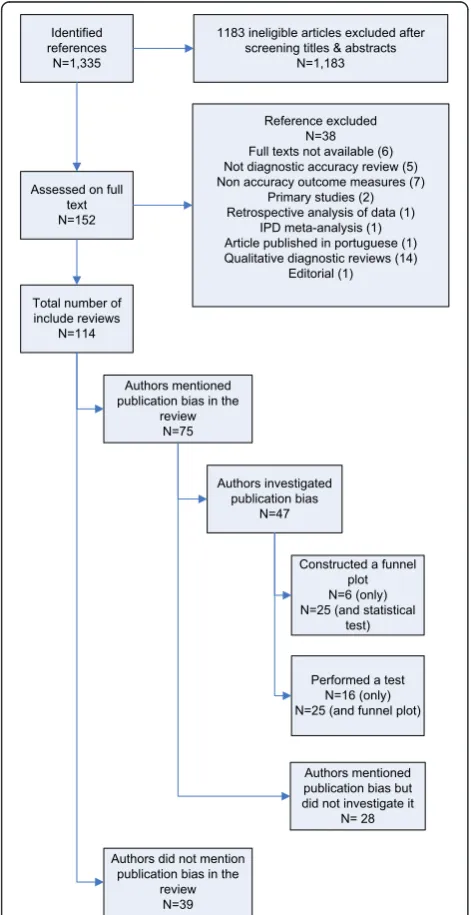
We identified 1,335 references of potential eligible stud-ies, of which 152 were assessed on full text for eligibility. Finally, 114 DTA reviews were included for the current study. Details of the selection process are presented in Figure 1. There was optimal agreement (98.6%) when the second reviewer checked the data.
Publication bias was explicitly mentioned in 75 reviews (65.8%). Of these, 47 (62.7%) had performed methods to
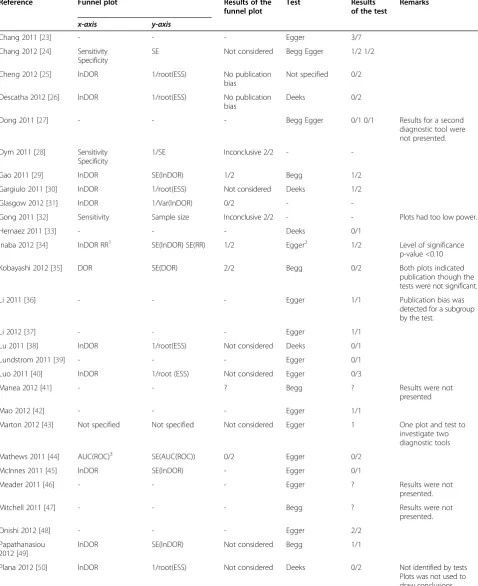
investigate publication bias in terms of small study-effects: 6 by investigating funnel plots, 16 by statistical testing for asymmetry and 25 by applying both methods. Table 1 gives details on how publication bias was investi-gated per review.
In 28 reviews (24.6%), publication bias was mentioned though it was not investigated. Fifteen of these reviews (13.2%) mentioned why they did not investigate publica-tion bias. These reasons were: because the methods to investigate publication are lacking and can provide mis-leading results (n = 7), lack of power to detect publica-tion bias (n = 6), too heterogeneous results to further investigate publication bias (n = 1), and underlying prin-ciples of publication bias in DTA studies are not yet known and publication bias can therefore not be investi-gated (n = 1).
Funnel plots
In the 31 reviews that presented funnel plots, different concepts were plotted. Funnel plots were constructed per test under review (n = 20), per target condition (n = 2) (e.g. MRI to detect colon cancer or to detect lung cancer) and for different accuracy measures of a test (n = 5) (e.g. sensitivity and specificity). In four reviews the authors made comparisons of the accuracy of several clinical tests but used one single plot to investigate publication bias (two of these, however, did construct different funnel plots for different accuracy measures).
The axes that were used to plot were diverse. On the horizontal axis the DOR (DOR or lnDOR) was most often used (n = 24), but also other accuracy parameters like sensitivity or ROC area (n = 5). Four reviews used other parameters (relative risk, detection rate, difference in the arcsine between two groups, and standardized ef-fect). On the vertical axis we found a variety of precision measures: SE(lnDOR) (n = 12), 1/variance(lnDOR) (n = 1), 1/(ESS)1/2(n = 10), and sample size (n = 2). For two reviews the authors had constructed two plots per test: one plot with the sensitivity on the horizontal axis with 1/SE(sens) on the vertical axis and one plot of the specificity on the horizontal axis with 1/SE(spec) on the vertical axis.
Statistical tests
In 41 reviews a statistical test was performed to investi-gate publication bias. The applied tests were Egger’s test (n = 18), Deeks’ test (n = 12), Begg’s test (n = 5), both the Egger and Begg test (n = 4), and both the Begg-Mazumdar and Harbord’s test [70]. One review did not specify which test was used. Two reviews used the trim and fill method to adjust for small study-effects. The median number of studies in the analyses was 13 (IQR 9–19) with a range from 4 to 118. Two review authors mentioned that a mini-mum of twenty homogeneous studies was required to per-form a test [71,72].
Total number of include reviews
N=114
Authors mentioned publication bias in the
review N=75
Authors did not mention publication bias in the
review N=39
Authors investigated publication bias
N=47
Authors mentioned publication bias but did not investigate it
N= 28 Constructed a funnel
plot N=6 (only) N=25 (and statistical
test)
Performed a test N=16 (only) N=25 (and funnel plot) Identified
references N=1,335
1183 ineligible articles excluded after screening titles & abstracts
N=1,183
Assessed on full text N=152
Reference excluded N=38 Full texts not available (6) Not diagnostic accuracy review (5) Non accuracy outcome measures (7)
Primary studies (2) Retrospective analysis of data (1)
IPD meta-analysis (1) Article published in portuguese (1) Qualitative diagnostic reviews (14)
Editorial (1)
Table 1 Overview of the applied methods to investigate publication bias
Reference Funnel plot Results of the
funnel plot
Test Results
of the test
Remarks
x-axis y-axis
Chang 2011 [23] - - - Egger 3/7
Chang 2012 [24] Sensitivity Specificity
SE Not considered Begg Egger 1/2 1/2
Cheng 2012 [25] lnDOR 1/root(ESS) No publication
bias
Not specified 0/2
Descatha 2012 [26] lnDOR 1/root(ESS) No publication bias
Deeks 0/2
Dong 2011 [27] - - - Begg Egger 0/1 0/1 Results for a second
diagnostic tool were not presented.
Dym 2011 [28] Sensitivity Specificity
1/SE Inconclusive 2/2 -
-Gao 2011 [29] lnDOR SE(lnDOR) 1/2 Begg 1/2
Gargiulo 2011 [30] lnDOR 1/root(ESS) Not considered Deeks 1/2
Glasgow 2012 [31] lnDOR 1/Var(lnDOR) 0/2 -
-Gong 2011 [32] Sensitivity Sample size Inconclusive 2/2 - - Plots had too low power.
Hernaez 2011 [33] - - - Deeks 0/1
Inaba 2012 [34] lnDOR RR1 SE(lnDOR) SE(RR) 1/2 Egger2 1/2 Level of significance
p-value <0.10
Kobayashi 2012 [35] DOR SE(DOR) 2/2 Begg 0/2 Both plots indicated
publication though the tests were not significant.
Li 2011 [36] - - - Egger 1/1 Publication bias was
detected for a subgroup by the test.
Li 2012 [37] - - - Egger 1/1
Lu 2011 [38] lnDOR 1/root(ESS) Not considered Deeks 0/1
Lundstrom 2011 [39] - - - Egger 0/1
Luo 2011 [40] lnDOR 1/root (ESS) Not considered Egger 0/3
Manea 2012 [41] - - ? Begg ? Results were not
presented
Mao 2012 [42] - - - Egger 1/1
Marton 2012 [43] Not specified Not specified Not considered Egger 1 One plot and test to investigate two diagnostic tools
Mathews 2011 [44] AUC(ROC)3 SE(AUC(ROC)) 0/2 Egger 0/2
McInnes 2011 [45] lnDOR SE(lnDOR) - Egger 0/1
Meader 2011 [46] - - - Egger ? Results were not
presented.
Mitchell 2011 [47] - - - Begg ? Results were not
presented.
Onishi 2012 [48] - - - Egger 2/2
Papathanasiou 2012 [49]
lnDOR SE(lnDOR) Not considered Begg 1/1
Plana 2012 [50] lnDOR 1/root(ESS) Not considered Deeks 0/2 Not identified by tests
Authors that had applied the Egger test most often reported significant results indicating the existence of publication bias (37.2%), while authors that applied the Deeks test least reported significant results in identifying publication bias (6.7%) (Table 2).
In 8 reviews the authors used more than one test to examine publication bias. The results of both tests in these reviews were in agreement with one another, though the p-values could be quite diverse (e.g. investigation of publication bias of FDG-PET studies to detect in breast cancer: Begg’s p = 0.462, Egger’s p = 0.052 [63] or imaging studies to detect osteomyelitis: Begg’s p = 0.392 and Egger’s p = 0.063 [60]).
Incorporation of results in the discussion
The results of investigation of publication bias were dis-cussed in 25 out of 47 reviews that assessed publication bias. Six reviews based their conclusion about publica-tion bias only on the plots, as they had not performed a test. One of these reviews concluded the existence of publication bias, two concluded no existence of publica-tion and three were inconclusive about the influence of
Table 1 Overview of the applied methods to investigate publication bias(Continued)
Qu 2011 [51] logDOR Sample size ?/2 - - Results of funnel plots
were inconclusive, too low power.
Sadeghi 2012 [52] logDetectionRate4 logSensitivity
SE(logDetect Rate) SE(logSens)
0/2 Egger 0/2
Sadigh 2011 [53] - - - Deeks 0/1
Summah 2011 [54] lnDOR SE(lnDOR) 1/1 Egger 1/1
Sun 2011 [55] - - - Deeks 0/1 No publication bias was
detected by the test.
Takakuwa 2011 [56] lnDOR 1/root (ESS) 1/1 Deeks 0/1 Identified by plot though
not by test.
Thosani 2012 [57] lnDOR SE(lnDOR) Not considered Egger 2/2 Plots were not used to
draw conclusion.
Tomasson 2012 [58] Difference in arcsine5
Precision (Dif. in arcsine)
2/2 Egger 0/2 Identified by plots though
not by tests.
Trallero-Araguas 2012 [59]
- - - Deeks 0/1
Wang 2011 [60] - - - Begg Egger 0/2 0/2
Wang 2012 [61] lnDOR SE(lnDOR) 7/7 Egger 3/7
Wang 2012 [62] lnDOR SE(lnDOR) 0/2 Begg Egger 0/2
Wang 2012 [63] lnDOR SE(lnDOR) 0/2 -
-Wu 2012 [64] lnDOR 1/root(ESS) 0/1 Deeks 0/1
Xu 2011 [65] - - - Egger 0/1
Xu 2011 [66] lnDOR Standardized effect6
SE(lnDOR) Precision (St. effect)
0/2 Begg-Mazumdar
Harbord-Egger 0/2
Ying 2011[67] lnDOR 1/root(ESS) 0/2 Deeks 0/2
Yu 2012 [68] lnDOR SE(lnDOR) 1/1 -
-Zhang 2011[69] lnDOR 1/root(ESS) 0/1 Deeks 0/1
1
RR = Relative Risk; It is unclear which estimates were used to calculate the RR.
2
The methods section specifies that the Egger test has been used though the text of the figures specified the Begg test.
3
AUC(ROC) = Area Under the Curve (AUC) of the Receiving Operating Characteristic (ROC).
4
There was no definition for Detection Rate specified in the article.
5
Difference in arcsine = Transformed ratios of arcsine for those with rise in Anti-Neutrophil Cytoplasmic Antibody (ANCA) and persistent ANCA among subjects who had relapse and those who did not.
6
Standardized effect was explained as differentiating benign and malignant lymph nodes.
Table 2 Reported results of different tests to assess small study in the included reviews (n=41)
Type of test Small study effects
Identified (%) Not identified (%) Total
Begg 3 (18.8) 13 (81.2) 16
Egger 16 (37.2) 27 (62.8) 43
Deeks 1 (6.7) 14 (93.3) 15
Begg-Mazumdar 0 1 (100) 1
Harbord-Egger 0 1 (100) 1
publication bias for their review. In reviews that had constructed a funnel plot and performed a test, the con-clusions were based on the combination (funnel plot and test) or only on the test. In cases of disagreement between the results of a funnel plot and a test, all au-thors emphasized on the test results.
In fourteen reviews, the issue of publication bias was raised as a limitation to the results while five reviews concluded that there was no risk of publication bias. Two reviews discussed that the assessment had in-creased their confidence in the results of their review, though four reviews mentioned that it had affected the results and that these results should be considered cautiously.
Eleven reviews that did not assess publication bias mentioned that the possible existence of publication bias could be a limitation to the results of their review. In these reviews, authors stated that comprehensive search-ing, placing no limits on study quality or language could be used as precautions to prevent effects of publication bias. Two reviews also mentioned that excluding con-ference proceedings could have introduced publication bias.
Comparison of tests to detect publication bias
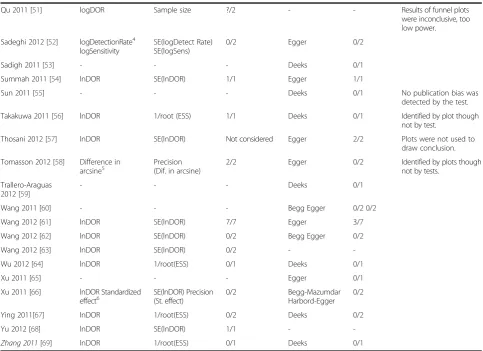
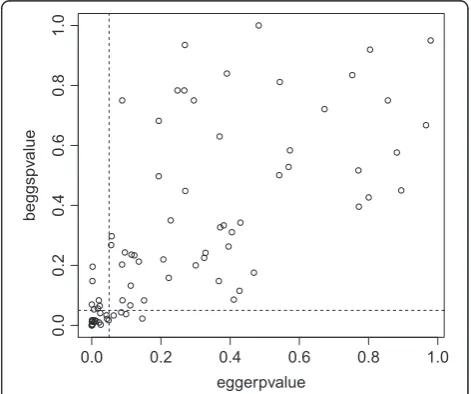
We were able to obtain two by two tables of 52 reviews, including 92 different meta-analyses. There was moder-ate concordance between the various tests for publi-cation bias in terms of the presence or absence of significance (Figures 2, 3 and 4). Concordance of the Begg and Egger tests was significantly better depending on the number of included studies (OR 1.09; 95% CI
1.03 to 1.10). The number of included participants or a DOR >38 did not have a significant association with the concordance of tests (Table 3).
Discussion
Most authors of DTA reviews (65.8%) are concerned about publication bias. In 41.2% of the included reviews methods were applied to investigate publication bias. Funnel plots were constructed with a diversity of param-eters on the axes and were sparsely used in isolation to
0.0 0.2 0.4 0.6 0.8 1.0
0.0
0.2
0.4
0.6
0.8
1.0
deekspvalue
beggspv
alue
Figure 2Comparison of the p-values of the Begg test (y-axis) and Deeks’test (x-axis) in 92 meta-analyses.The dotted lines indicate a p-value of 0.05. Concordance between tests was 67% (κ=−0.039; 95% CI−0.23 to 0.15).
0.0 0.2 0.4 0.6 0.8 1.0
0.0
0.2
0.4
0.6
0.8
1.0
eggerpvalue
deekspv
alue
Figure 3Comparison of the p-values of the Egger test (y-axis) and Deeks’test (x-axis) in 92 meta-analyses.The dotted lines indicate a p-value of 0.05. Concordance between tests was 66% (κ=−0.002; 95% CI−0.2 to 0.19).
0.0 0.2 0.4 0.6 0.8 1.0
0.0
0.2
0.4
0.6
0.8
1.0
eggerpvalue
beggspv
alue
formulate conclusions about the existence of publication bias. Forty-one reviews assessed publication bias with a statistical test. The Deeks test that is especially devel-oped for reviews of diagnostic accuracy was only used in 12 reviews (10.5%). In 18 reviews (15.8%), the results of the publication bias assessment led to less confidence in the results. Our replication of three tests to detect publi-cation bias (Begg, Egger and Deeks) using empirical data indicated that the results of the tests frequently conflict with one another. The study of Deeks et al. showed that a type 1 error is likely to occur in both the Begg and the Egger tests when the threshold for test positivity, the disease prevalence or the magnitude of the accuracy esti-mates varies between the included studies, especially when the DOR is high (DOR > 38), which is present in almost every DTA review [19]. Although, we cannot be sure in which reviews the test results were accurate and in which they were false, it seems likely that these two tests may have led to an overestimation of the presence of publication bias.
The number of reviews investigating publication bias seems to have increased over time. In 2002, Song and colleagues investigated how authors assessed publication bias in a sample of 20 reviews including 28 DTA meta-analyses. They concluded that none of the included re-views had investigated publication bias and that only 4 out of 20 reviews had considered its likelihood in the discussion [18]. Furthermore, in 2011, Parekh-Bhurke et al. conducted a review to examine the approaches that are used to deal with publication bias in different types of systematic reviews published in 2006. They reported that only 26% of all reviews used statistical methods to assess publication bias [73]. Of the 50 diagnostic reviews that were included in this study, nine (18%) used funnel plot asymmetry to investigate publications bias and in three (6%) a statistical test. These numbers are remark-ably lower than found in our study. This could be the re-sult of the increased awareness of the possible threat of publication bias in DTA reviews.
The increased awareness of publication bias is a posi-tive development, but the drawback here is that the ma-jority of review authors use tests that are not fit for DTA meta-analyses. Our evaluation of 92 meta-analyses indi-cated that both the Begg and Egger tests give more sig-nificant results than Deeks’ test. This result is in line with the expectation based on the simulation study by
Deeks et al. [19]. The trim and fill method was used in two reviews only. This method removes the most ex-treme small studies on the side of the desired outcome direction in the funnel plot, and recomputes the effect size at each iteration until the plot is symmetrical [17]. A recent simulation study in DTA meta-analyses showed that the trim and fill method is more powerful than other tests like the Begg, Egger or Deeks test to detect possible publication bias [74]. Therefore, this method may be used more frequently in future.
Our study is limited by the fact that we based our results on what is reported in the publications. It is pos-sible that funnel plots were constructed for more re-views but were not included in the publication. This may have led to an underestimation of the actual num-ber of reviews that constructed a funnel plot. Secondly, our own assessment of publication bias in the meta-analyses is based on the data reported in the reviews but it is, of course, not clear if any of the meta-analyses were actually biased by publication bias as a gold standard is currently absent [14].
As correctly mentioned in some of the reviews in-cluded in our study, little is known about the actual existence of selective publication of DTA studies [75]. There is no evidence regarding the existence of biases like language bias or time lag bias in the DTA setting, nor if these biases affect the accuracy measures in the same way as they affect the effect of interventions. It could be argued that depending on the purpose of the test either the sensitivity or the specificity are more af-fected by selective publication than the DOR, and tests for publication bias should perhaps be directed to these two accuracy parameters. A special situation of selective publication may occur with non-inferiority designs for diagnostic test accuracy. This study design aims to com-pare the diagnostic accuracy of a new diagnostic test with a standard test and is based on the difference in paired partial area under the ROC curve. This difference can be tested with Bayesian methods that result in a p-value [76,77]. Because of this p-value, this design may be more susceptible to non-publishing negative findings and as such induces publication bias. However, as long as the mechanisms behind publication bias of diagnostic studies are not well understood, it is understandable that some reviewers decided not to formally investigate how publication bias may have affected their meta-analysis. Table 3 Odd ratio’s for the association between several factors and the concordance between tests
Factor Begg–Deeks OR (95% CI) Egger–Deeks OR (95% CI) Begg–Egger OR (95% CI)
Number of participants 1.00 (0.99 to 1.00) 1.00 (1.00 to 1.00) 1.00 (1.00 to 1.00)
Number of studies 0.96 (0.98 to 1.02) 1.00 (0.99 to 1.01) 1.09 (1.03 to 1.10)*
DOR > 38 1.02 (0.93 to 1.15) 0.955 (0.85 to 1.20) 0.999 (0.96 to 1.00)
Prospective registration of intervention studies has been shown to be an effective measure to reduce selective pub-lication or at least make it more transparent to investiga-tors. At the moment, prospective registration is advocated for diagnostic accuracy studies but not a prerequisite like it is for intervention studies in order to be considered for publication in journals associated with the International Committee of Medical Journal Editors (ICMJE) [78]. Em-pirical studies to assess and understand the mechanisms that may induce publication bias in DTA studies, however, are needed. A cohort of prospective diagnostic studies could be followed and the dissemination of study results may be compared to the study characteristics and results. Optimization could be achieved if prospective registration of diagnostic accuracy studies would be mandatory. This may not be beneficial for all types of diagnostic studies. For example diagnostic data are often collected as part of daily clinical care and retrospectively analysed. Still, pro-spective registration of at least the propro-spective diagnostic studies could improve the understanding of the process of selective publication of DTA studies and identify under-lying mechanisms. This knowledge is needed for valid interpretation of results of meta-analyses of diagnostic studies.
Conclusions
We found that most DTA reviewers struggle how to deal with publication bias in their reviews. Suboptimal tests like Egger’s and Begg’s are frequently used, while the in-terpretation of the test results are rarely linked to the pooled results. Deeks’tests should be preferred to assess publication bias in DTA meta-analyses and interpretation of a significant test result should be done within the per-spective that we are unaware whether publication bias ex-ists for DTA studies. We advise authors of DTA reviews to try to avoid the introduction of publication bias and apply thorough methods for identifying primary studies, along-side regular searches in electronic biomedical databases. This entails identifying grey literature, contacting experts and searching for conference proceedings. Prospective registration of diagnostic studies with a prospective design could be helpful in the perspective of selective reporting.
Abbreviations
ANCA:Anti-Neutrophil Cytoplasmic Antibody; AUC: Area Under the Curve; DOR: Diagnostic odds ratio; DTA: Diagnostic test accuracy; ESS: Effective sample size; ICMJE: International Committee of Medical Journal Editors; lnDOR: Natural logarithm of the odds ratio; RR: Relative risk; ROC: Receiving Operating Characteristicl; SE: Standard error; Sens: Sensitivity; Spec: Specificity.
Competing interests
This research project has not been funded. We have no competing interest to report that could have affected the results of our study.
Authors’contributions
WE has contributed to the protocol of the study, data extraction, data-analysis and wrote manuscript. EO contributed to the protocol and performed the search and selection process of studies. She helped with data-checking and
contributed to the manuscript. LH has contributed to the protocol of the study and contributed to the manuscript. RS has contributed to the protocol of the study, helped with data-checking and contributed to the manuscript. ML has contributed to the protocol of the study, performed the selection process of studies, helped with data-checking and contributed to the manuscript. All authors read and approved the final manuscript.
Authors’information
ML, RS and LH are all involved in the Cochrane DTA working group. Further, the authors declare that they have no competing interests.
Acknowledgements
We would like to thank Fleur van de Wetering (FW) for her help with data checking and John Deeks for his suggestions on the methods. Further, we are grateful to Aeilko Zwinderman for his help to perform the analyses.
Author details 1
Dutch Cochrane Centre and Department of Clinical Epidemiology, Biostatistics and Bioinformatics, Academic Medical Center, Amsterdam, The Netherlands.2Department of Clinical Epidemiology, Biostatistics and Bioinformatics, Academic Medical Center, Amsterdam, The Netherlands. 3
Current address: Dutch Cochrane Centre, Julius Center for Health Sciences and Primary Care, University Medical Center Utrecht, Utrecht, The Netherlands.
Received: 10 February 2014 Accepted: 6 May 2014 Published: 23 May 2014
References
1. Dickersin K:The existence of publication bias and risk factors for its occurrence.JAMA1990,263:1385–1389.
2. Egger M, Juni P, Bartlett C, Holenstein F, Sterne J:How important are comprehensive literature searches and the assessment of trial quality in systematic reviews? Empirical study.Health Technol Assess
2003,7:1–76.
3. Ioannidis JP, Cappelleri JC, Sacks HS, Lau J:The relationship between study design, results, and reporting of randomized clinical trials of HIV infection.Control Clin Trials1997,18:431–444.
4. Ioannidis JP:Effect of the statistical significance of results on the time to completion and publication of randomized efficacy trials.JAMA1998, 279:281–286.
5. Moher D, Fortin P, Jadad AR, Juni P, Klassen T, Le LJ, Liberati A, Linde K, Penna A:Completeness of reporting of trials published in languages other than English: implications for conduct and reporting of systematic reviews.Lancet1996,347:363–366.
6. Sampson M, Platt R, StJohn PD, Moher D, Klassen TP, Pham B, Platt R, StJohn PD, Viola R, Raina P:Should meta-analysts search Embase in addition to Medline?J Clin Epidemiol2003,56:943–955.
7. Sterne JA, Gavaghan D, Egger M:Publication and related bias in meta-analysis: power of statistical tests and prevalence in the literature.J Clin Epidemiol2000,53:1119–1129.
8. Thornton A, Lee P:Publication bias in meta-analysis: its causes and consequences.J Clin Epidemiol2000,53:207–216.
9. Sterne JA, Sutton AJ, Ioannidis JP, Terrin N, Jones DR, Lau J, Carpenter J, Rucker G, Harbord RM, Schmid CH, Tetzlaff J, Deeks JJ, Peters J, Macaskill P, Schwarzer G, Duval S, Altman DG, Moher D, Higgins JP:Recommendations for examining and interpreting funnel plot asymmetry in meta-analyses of randomised controlled trials.BMJ2011,343:d4002.
10. Sterne JA, Egger M, Moher D:Adressing reporting bias; detecting repoting bias.InCochrane Handbook for Systematic Reviews of Interventions.
Edited by Higgins JPT, Green S. Oxford, United Kingdom: Wiley-Blackwell; 2009:310–324.
11. Begg CB, Mazumdar M:Operating characteristics of a rank correlation test for publication bias.Biometrics1994,50:1088–1101.
12. Egger M, Davey SG, Schneider M, Minder C:Bias in meta-analysis detected by a simple, graphical test.BMJ1997,315:629–634.
13. Web of Knowledge: Edited by Thomson R. New York, USA: Thomson Reuters; 2014.
Diagnostic Test Accuracy.Edited by Deeks JJ, Bossuyt PM, Gatsonis C. Oxford, United Kingdom: The Cochrane Collaboration; 2010:46–47. 15. Rifai N, Altman DG, Bossuyt PM:Reporting bias in diagnostic and prognostic studies: time for action.Clin Chem2008,54:1101–1103. 16. Korevaar DA, Ochodo EA, Bossuyt PM, Hooft L:Publication and Reporting
of Test Accuracy Studies Registered in ClinicalTrials.gov.Clin Chem2014, 60:651–659.
17. Brazzelli M, Lewis SC, Deeks JJ, Sandercock PA:No evidence of bias in the process of publication of diagnostic accuracy studies in stroke submitted as abstracts.J Clin Epidemiol2009,62:425–430. 18. Song F, Khan KS, Dinnes J, Sutton AJ:Asymmetric funnel plots and
publication bias in meta-analyses of diagnostic accuracy.Int J Epidemiol
2002,31:88–95.
19. Deeks JJ, Macaskill P, Irwig L:The performance of tests of publication bias and other sample size effects in systematic reviews of diagnostic test accuracy was assessed.J Clin Epidemiol2005,58:882–893.
20. Deville WL, Bezemer PD, Bouter LM:Publications on diagnostic test evaluation in family medicine journals: an optimal search strategy.J Clin Epidemiol2000,53:65–69.
21. Korevaar DA, van Enst WA, Spijker R, Bossuyt PM, Hooft L:Reporting quality of diagnostic accuracy studies: a systematic review and meta-analysis of investigations on adherence to STARD.Evid Based Med2014,19:47–54.
22. R Core Team:R: A Language and Environment for Statistical Computing.
Vienna, Austria: R Foundation for Statistical Computing; 2013. 23. Chang KC, Yew WW, Zhang Y:Pyrazinamide susceptibility testing in
Mycobacterium tuberculosis: a systematic review with meta-analyses.
Antimicrob Agents Chemother2011,55:4499–4505.
24. Chang MC, Chen JH, Liang JA, Lin CC, Yang KT, Cheng KY, Yeh JJ, Kao CH: Meta-analysis: comparison of F-18 fluorodeoxyglucose-positron emission tomography and bone scintigraphy in the detection of bone metastasis in patients with lung cancer.Acad Radiol2012,19:349–357.
25. Cheng X, Li Y, Xu Z, Bao L, Li D, Wang J:Comparison of 18 F-FDG PET/CT with bone scintigraphy for detection of bone metastasis: a meta-analysis.Acta Radiol2011,52:779–787.
26. Descatha A, Huard L, Aubert F, Barbato B, Gorand O, Chastang JF: Meta-analysis on the performance of sonography for the diagnosis of carpal tunnel syndrome.Semin Arthritis Rheum2012,41:914–922.
27. Dong MJ, Zhao K, Liu ZF, Wang GL, Yang SY, Zhou GJ:A meta-analysis of the value of fluorodeoxyglucose-PET/PET-CT in the evaluation of fever of unknown origin.Eur J Radiol2011,80:834–844.
28. Dym RJ, Burns J, Freeman K, Lipton ML:Is functional MR imaging assessment of hemispheric language dominance as good as the Wada test?: a meta-analysis.Radiology2011,261:446–455.
29. Gao P, Li M, Tian QB, Liu DW:Diagnostic performance of des-gamma-carboxy prothrombin (DCP) for hepatocellular carcinoma: a bivariate meta-analysis.Neoplasma2012,59:150–159.
30. Gargiulo P, Petretta M, Bruzzese D, Cuocolo A, Prastaro M, D'Amore C, Vassallo E, Savarese G, Marciano C, Paolillo S, Filardi PP:Myocardial perfusion scintigraphy and echocardiography for detecting coronary artery disease in hypertensive patients: a meta-analysis.Eur J Nucl Med Mol Imaging2011,38:2040–2049.
31. Glasgow SC, Bleier JI, Burgart LJ, Finne CO, Lowry AC:Meta-analysis of histopathological features of primary colorectal cancers that predict lymph node metastases.J Gastrointest Surg2012,16:1019–1028. 32. Gong X, Xu Q, Xu Z, Xiong P, Yan W, Chen Y:Real-time elastography for
the differentiation of benign and malignant breast lesions: a meta-analysis.
Breast Cancer Res Treat2011,130:11–18.
33. Hernaez R, Lazo M, Bonekamp S, Kamel I, Brancati FL, Guallar E, Clark JM: Diagnostic accuracy and reliability of ultrasonography for the detection of fatty liver: a meta-analysis.Hepatology2011,54:1082–1090.
34. Inaba Y, Chen JA, Bergmann SR:Carotid plaque, compared with carotid intima-media thickness, more accurately predicts coronary artery disease events: a meta-analysis.Atherosclerosis2012,220:128–133.
35. Kobayashi Y, Hayashino Y, Jackson JL, Takagaki N, Hinotsu S, Kawakami K: Diagnostic performance of chromoendoscopy and narrow band imaging for colonic neoplasms: a meta-analysis.Colorectal Dis2012, 14:18–28.
36. Li BS, Wang XY, Ma FL, Jiang B, Song XX, Xu AG:Is high resolution melting analysis (HRMA) accurate for detection of human disease-associated mutations? A meta analysis.PLoS One2011,6:e28078.
37. Li R, Liu J, Xue H, Huang G:Diagnostic value of fecal tumor M2-pyruvate kinase for CRC screening: a systematic review and meta-analysis.Int J Cancer2012,131:1837–1845.
38. Lu Y, Chen YQ, Guo YL, Qin SM, Wu C, Wang K:Diagnosis of invasive fungal disease using serum (1– –>3)-beta-D-glucan: a bivariate meta-analysis.Intern Med2011,50:2783–2791.
39. Lundstrom LH, Vester-Andersen M, Moller AM, Charuluxananan S, L'hermite J, Wetterslev J:Poor prognostic value of the modified Mallampati score: a meta-analysis involving 177 088 patients.Br J Anaesth2011, 107:659–667.
40. Luo YX, Chen DK, Song SX, Wang L, Wang JP:Aberrant methylation of genes in stool samples as diagnostic biomarkers for colorectal cancer or adenomas: a meta-analysis.Int J Clin Pract2011,65:1313–1320. 41. Manea L, Gilbody S, McMillan D:Optimal cut-off score for diagnosing
depression with the Patient Health Questionnaire (PHQ-9): a meta-analysis.CMAJ2012,184:E191–E196.
42. Mao R, Xiao YL, Gao X, Chen BL, He Y, Yang L, Hu PJ, Chen MH:Fecal calprotectin in predicting relapse of inflammatory bowel diseases: a meta-analysis of prospective studies.Inflamm Bowel Dis2012, 18:1894–1899.
43. Marton A, Xue X, Szilagyi A:Meta-analysis: the diagnostic accuracy of lactose breath hydrogen or lactose tolerance tests for predicting the North European lactase polymorphism C/T-13910.Aliment Pharmacol Ther
2012,35:429–440.
44. Mathews WC, Agmas W, Cachay E:Comparative accuracy of anal and cervical cytology in screening for moderate to severe dysplasia by magnification guided punch biopsy: a meta-analysis.PLoS One2011, 6:e24946.
45. McInnes MD, Kielar AZ, Macdonald DB:Percutaneous image-guided biopsy of the spleen: systematic review and meta-analysis of the complication rate and diagnostic accuracy.Radiology2011, 260:699–708.
46. Meader N, Mitchell AJ, Chew-Graham C, Goldberg D, Rizzo M, Bird V, Kessler D, Packham J, Haddad M, Pilling S:Case identification of depression in patients with chronic physical health problems: a diagnostic accuracy meta-analysis of 113 studies.Br J Gen Pract
2011,61:e808–e820.
47. Mitchell AJ, Meader N, Pentzek M:Clinical recognition of dementia and cognitive impairment in primary care: a meta-analysis of physician accuracy.Acta Psychiatr Scand2011,124:165–183.
48. Onishi A, Sugiyama D, Kogata Y, Saegusa J, Sugimoto T, Kawano S, Morinobu A, Nishimura K, Kumagai S:Diagnostic accuracy of serum 1,3-beta-D-glucan for pneumocystis jiroveci pneumonia, invasive candidiasis, and invasive aspergillosis: systematic review and meta-analysis.
J Clin Microbiol2012,50:7–15.
49. Papathanasiou ND, Boutsiadis A, Dickson J, Bomanji JB:Diagnostic accuracy of (1)(2)(3)I-FP-CIT (DaTSCAN) in dementia with Lewy bodies: a meta-analysis of published studies.Parkinsonism Relat Disord2012, 18:225–229.
50. Plana MN, Carreira C, Muriel A, Chiva M, Abraira V, Emparanza JI, Bonfill X, Zamora J:Magnetic resonance imaging in the preoperative assessment of patients with primary breast cancer: systematic review of diagnostic accuracy and meta-analysis.Eur Radiol2012,22:26–38.
51. Qu X, Huang X, Wu L, Huang G, Ping X, Yan W:Comparison of virtual cystoscopy and ultrasonography for bladder cancer detection: a meta-analysis.Eur J Radiol2011,80:188–197.
52. Sadeghi R, Gholami H, Zakavi SR, Kakhki VR, Tabasi KT, Horenblas S: Accuracy of sentinel lymph node biopsy for inguinal lymph node staging of penile squamous cell carcinoma: systematic review and meta-analysis of the literature.J Urol2012,187:25–31.
53. Sadigh G, Carlos RC, Neal CH, Dwamena BA:Ultrasonographic
differentiation of malignant from benign breast lesions: a meta-analytic comparison of elasticity and BIRADS scoring.Breast Cancer Res Treat2012, 133:23–35.
54. Summah H, Tao LL, Zhu YG, Jiang HN, Qu JM:Pleural fluid soluble triggering receptor expressed on myeloid cells-1 as a marker of bacterial infection: a meta-analysis.BMC Infect Dis2011,11:280. 55. Sun W, Wang K, Gao W, Su X, Qian Q, Lu X, Song Y, Guo Y, Shi Y:
Evaluation of PCR on bronchoalveolar lavage fluid for diagnosis of invasive aspergillosis: a bivariate metaanalysis and systematic review.
56. Takakuwa KM, Keith SW, Estepa AT, Shofer FS:A meta-analysis of 64-section coronary CT angiography findings for predicting 30-day major adverse cardiac events in patients presenting with symptoms suggestive of acute coronary syndrome.Acad Radiol2011,18:1522–1528.
57. Thosani N, Singh H, Kapadia A, Ochi N, Lee JH, Ajani J, Swisher SG, Hofstetter WL, Guha S, Bhutani MS:Diagnostic accuracy of EUS in differentiating mucosal versus submucosal invasion of superficial esophageal cancers: a systematic review and meta-analysis.Gastrointest Endosc2012,75:242–253.
58. Tomasson G, Grayson PC, Mahr AD, Lavalley M, Merkel PA:Value of ANCA measurements during remission to predict a relapse of ANCA-associated vasculitis–a meta-analysis.Rheumatology (Oxford)2012,51:100–109. 59. Trallero-Araguas E, Rodrigo-Pendas JA, Selva-O'Callaghan A, Martinez-Gomez X,
Bosch X, Labrador-Horrillo M, Grau-Junyent JM, Vilardell-Tarres M: Usefulness of anti-p155 autoantibody for diagnosing cancer-associated dermatomyositis: a systematic review and meta-analysis.Arthritis Rheum
2012,64:523–532.
60. Wang GL, Zhao K, Liu ZF, Dong MJ, Yang SY:A meta-analysis of fluorodeoxyglucose-positron emission tomography versus scintigraphy in the evaluation of suspected osteomyelitis.Nucl Med Commun2011, 32:1134–1142.
61. Wang QB, Zhu H, Liu HL, Zhang B:Performance of magnetic resonance elastography and diffusion-weighted imaging for the staging of hepatic fibrosis: A meta-analysis.Hepatology2012,56:239–247.
62. Wang W, Li Y, Li H, Xing Y, Qu G, Dai J, Liang Y:Immunodiagnostic efficacy of detection of Schistosoma japonicum human infections in China: a meta analysis.Asian Pac J Trop Med2012,5:15–23.
63. Wang Y, Zhang C, Liu J, Huang G:Is 18 F-FDG PET accurate to predict neoadjuvant therapy response in breast cancer? A meta-analysis.Breast Cancer Res Treat2012,131:357–369.
64. Wu LM, Xu JR, Liu MJ, Zhang XF, Hua J, Zheng J, Hu JN:Value of magnetic resonance imaging for nodal staging in patients with head and neck squamous cell carcinoma: a meta-analysis.Acad Radiol2012,19:331–340.
65. Xu HB, Li L, Xu Q:Tc-99 m sestamibi scintimammography for the diagnosis of breast cancer: meta-analysis and meta-regression.Nucl Med Commun2011,32:980–988.
66. Xu W, Shi J, Zeng X, Li X, Xie WF, Guo J, Lin Y:EUS elastography for the differentiation of benign and malignant lymph nodes: a meta-analysis.
Gastrointest Endosc2011,74:1001–1009.
67. Ying L, Hou Y, Zheng HM, Lin X, Xie ZL, Hu YP:Real-time elastography for the differentiation of benign and malignant superficial lymph nodes: a meta-analysis.Eur J Radiol2012,81:2576–2584.
68. Yu YH, Wei W, Liu JL:Diagnostic value of fine-needle aspiration biopsy for breast mass: a systematic review and meta-analysis.BMC Cancer2012, 12:41.
69. Zhang L, Zong ZY, Liu YB, Ye H, Lv XJ:PCR versus serology for diagnosing Mycoplasma pneumoniae infection: a systematic review & meta-analysis.
Indian J Med Res2011,134:270–280.
70. Harbord RM, Egger M, Sterne JA:A modified test for small-study effects in meta-analyses of controlled trials with binary endpoints.Stat Med2006, 25:3443–3457.
71. Hazem A, Elamin MB, Malaga G, Bancos I, Prevost Y, Zeballos-Palacios C, Velasquez ER, Erwin PJ, Natt N, Montori VM, Murad MH:The accuracy of diagnostic tests for GH deficiency in adults: a systematic review and meta-analysis.Eur J Endocrinol2011,165:841–849.
72. Singh B, Parsaik AK, Agarwal D, Surana A, Mascarenhas SS, Chandra S: Diagnostic accuracy of pulmonary embolism rule-out criteria: a systematic review and meta-analysis.Ann Emerg Med2012,59:517–520.
73. Parekh-Bhurke S, Kwok CS, Pang C, Hooper L, Loke YK, Ryder JJ, Sutton AJ, Hing CB, Harvey I, Song F:Uptake of methods to deal with publication bias in systematic reviews has increased over time, but there is still much scope for improvement.J Clin Epidemiol2011,64:349–357. 74. Burkner PC, Doebler P:Testing for publication bias in diagnostic
meta-analysis: a simulation study.Stat Med2014.
75. de Vet HCW, Eisinga A, Riphagen II, Aertgeerts B, Pewsner D:Searching for Studies.InCochrane Handbook for Systematic Reviews of Diagnosic Test Accuracy. 0.4 edition.Edited by The Cochrane Collaboration. 2008. 76. Li CR, Liao CT, Liu JP:A non-inferiority test for diagnostic accuracy based
on the paired partial areas under ROC curves.Stat Med2008, 27:1762–1776.
77. Liu JP, Ma MC, Wu CY, Tai JY:Tests of equivalence and non-inferiority for diagnostic accuracy based on the paired areas under ROC curves.Stat Med2006,25:1219–1238.
78. DeAngelis CD, Drazen JM, Frizelle FA, Haug C, Hoey J, Horton R, Kotzin S, Laine C, Marusic A, Overbeke AJ, Schroeder TV, Sox HC, Van Der Weyden MB: Clinical trial registration: a statement from the International Committee of Medical Journal Editors.Ann Intern Med2004,141:477–478.
doi:10.1186/1471-2288-14-70
Cite this article as:van Enstet al.:Investigation of publication bias in meta-analyses of diagnostic test accuracy: a meta-epidemiological study. BMC Medical Research Methodology201414:70.
Submit your next manuscript to BioMed Central and take full advantage of:
• Convenient online submission
• Thorough peer review
• No space constraints or color figure charges
• Immediate publication on acceptance
• Inclusion in PubMed, CAS, Scopus and Google Scholar
• Research which is freely available for redistribution