Lifetimegenetic analysis of milk yield in Iranian Holstein cows using
repeatability and pre-structured multivariate models
M. Asadi Fozi*
Department of Animal Science, Faculty of Agriculture, Shahid Bahonar University of Kerman, Kerman, Iran.
* Corresponding author, E-mail address: [email protected]
Abstract Milk yield records from 1st to 5th lactations of Iranian Holstein cows were analyzed using repeatability and a number of multivariate models that varied in additive genetic variance structure. A total of313,006 milk yield records were used. The records were obtained from 116,531 cows born between 2001 and 2005. The animals originated from 2,355 sires and 91,212 dams. A multivariate model with heterogeneous residual co (variance) and heterogeneous genetic variance was found to be the most parsimonious model in comparison with the repeatability and the other pre-structured multivariate models.Heritability of milk trait at 1st, 2nd, 3rd, 4th and 5th locations were 0.27, 0.19, 0.14, 0.11 and 0.07, respectively using the preferred modelwhile a value of 0.18 was estimated for the heritability of the milk yields where repeatability model was applied.In comparison with the pre-structured multivariate models; the repeatability model was not an appropriate model for genetic analysis of the repeated records of milk yield in the population investigated. In the current study, homogenous genetic covariance was assumed among the different lactations which can be modelled in future studies.
Keywords: genetic analysis, repeatability model, pre-structured multivariate model, milk yield, Iranian Holstein cow
Received: 16 Nov. 2015, accepted: 22 Feb. 2016, published online: 04 May. 2016
Introduction
Some production traits such as milk yield are expressed on multiple occasions in a cow’s lifetime. These expres-sions are assumed as one character expressed across dif-ferent lactations. Generally repeatability model has been utilized for genetic analysis of the repeated records. In this model a unity genetic correlations is assumed among the repeated records. The phenotypic variance is divided into three components including direct additive genetic variance, animal permanent environmental var-iance and residual varvar-iance. The varvar-iances are assumed to be homogenous while they can be changed across the lactations. Zeynadidni et al. (2014) showed the genetic variance of milk yield is changed across different lacta-tions. Previous studies showed that for genetic analysis of the repeated records, appropriate co (variance) struc-ture can be fitted using pre-strucstruc-tured multivariate mod-els (Asadi Fozi et al., 2013 and Coelli et al., 1998). In the models the co (variance) structure are modelled based on physiological knowledge about the traits in-vestigated. Asadi Fozi et al. (2013) reported that in com-parison with the pre-structured models, repeatability model is not an appropriate model for genetic analysis
of fibre diameter in merino sheep. They showed that the genetic variance of fibre diameter increased up to 3rd
shearing but it doesn’t change for the later ages while repeatability model allowed no changes in fibre diame-ter measured at different shearings.Residual and genetic (co) varianceamong the lactations were modelled for more accurate genetic analysis of lifetime milk yield in Iranian Holstein cows (Zeynadidni., 2014). Accord-ingly, a pre-structured multivariate model was the best model for the genetic analysis. Zhiying et al. (2014) found that a pre-structured multivariate model was the most parsimonious model for genetic analysis of fleece traits in Inner Mongolia Cashmere goats.
40
Materials and methods
Data
The data were collected by the Iranian Animal Breeding Centre. A total of 313,006 milk yield (M) records were measured on 116,531cows born between 2001 and 2005 that descended from 2,355 sires and 91,212 dams. Of those, 116,531,83,731,57,094,35,961 and 19,689 rec-ords were collected at 1st (M
1), 2nd (M2), 3rd (M3), 4th (M4)
and 5th (M
5) lactations, respectively. The records were
adjusted based on 305 days and twice milking per day (2X). The data were collected from 23 provinces in Iran. The data characteristics are presented in Table 1.
Genetic analysis
In repeatability model, unity genetic correlations and homogenous variances are assumed among the repeated records (Falconer, 1996). To evaluate the efficiency of this model for genetic analysis of repeated records, the residual co (variance) and the genetic variance struc-tures were modelled using a series of pre-structured multivariate models. The milk yields records were as-sumed as one character expressed across the lactations, and then unity genetic correlations were considered be-tween the lactations. Accordingly, in the pre-structured multivariate models (the same as repeatability model) the genetic correlations were assumed to be one where homogenous genetic covariance was fitted. The as-sumption of the unity genetic correlations among the lactations can be investigated in future studies.
Repeatability model (Model 1)
In this model, herd-year-season, birth year, state and an-imal age at calving were fitted as the fixed effects. Lin-ear, quadratic and higher orders of regression were
testedforthe effectofage. Theanimal genetic effects
and the animal permanent environmental effect were the random effects. The model was as follows:
e pe Z a Z Xb
y 1 2 (1)
where, y is a vector of animal repeated records, b is a vector of fixed effects, a is a vector of additive genetic effects; pe is a vector of animal permanent environmen-tal effects, and e is a vector of residual effects. X is the incidence matrix for the fixed effects and Z1 and Z2, are
incidence matrices relating observations to random ani-mal effectsand aniani-mal permanent environmental effects, respectively.
Pre-structured multivariate models
(model 2, 3, 4, 5 and 6)
For each lactation a univariate analysis was used with an animal model including all significant fixed effects and direct additive genetic effect of the animals. The model was as follows:
y = Xb + Za + e (2)
where, y is a vector of milk yield records measured at each lactation, b is a vector of fixed effects, a is a vector of additive genetic effects, and e is a vector of residual effects. X is the incidence matrix for the fixed effects and Zis incidence matrix relating observations to ran-dom animal effects.
The univariate model [B] was also used for multivar-iate analysis but y was expanded as:
5 4 3 2 1
y y y y y
where yi represents milk yield measured at the ith lactat-
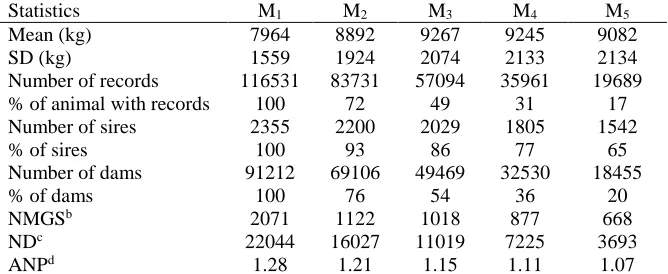
Table 1. Simple statistics and data structure for 305-d milk yield measured at first, second, third, fourth and fifth lactations of Iranian Holstein cows
Statistics M1 M2 M3 M4 M5
Mean (kg) 7964 8892 9267 9245 9082
SD (kg) 1559 1924 2074 2133 2134
Number of records 116531 83731 57094 35961 19689 % of animal with records 100 72 49 31 17 Number of sires 2355 2200 2029 1805 1542
% of sires 100 93 86 77 65
Number of dams 91212 69106 49469 32530 18455
% of dams 100 76 54 36 20
NMGSb 2071 1122 1018 877 668
NDc 22044 16027 11019 7225 3693
ANPd 1.28 1.21 1.15 1.11 1.07
aPercentage of animal with records, bNumber of maternal grand sires, cNumber of dams with
41 ion. Similarly, b consisted of significant fixed effects
resulting from univariate analysis with b partitioned ac-cording to fixed effects for each lactation anda can be partitioned into the respective effects referring to each lactation.
The pre-structured multivariate models were fitted with varying genetic variance structures from uniform to unstructured with a unity genetic correlation. In these models,in contrast with the repeatability model, a heter-ogeneous residual (co)variance structure with 15 param-eters was considered.
Homogenous genetic variance was assumed for the milk yield records (Model 2). In Model 3, the genetic variance of first lactation was distinguished from the other lactations and hence the genetic variance of the different lactations was divided into two different groups, first lactation and the later lactations consisting of 2nd, 3rd, 4th and 5th lactations. Model 4 was fitted when
the genetic variances of milk yield measured at first and second lactations were separated from the later lacta-tions. In Model 5 the genetic variance of the milk yieldswas partitioned into 4 different groups as 1st
lac-tation, 2nd lactation, 3rd lactation and the later lactations
including lactation 4 and lactation 5. Finally, a complete heterogeneous genetic variance structure was assumed for the milk yields in model 6.Variance components and genetic parameters were estimated using ASReml (Gil-mour et al., 2002).
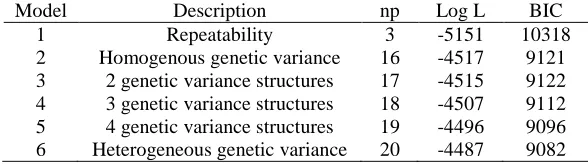
The log likelihood ratio test can be used to compare different models, but it tends to favour models with a higher number of parameters (Albuquerque and Meyer, 2001). Akaike’s Information Criterion (AIC) and Schwarz’s Bayesian Information Criterion (BIC) (Wolf-inger, 1993) penalize the log likelihood for the number of estimated parameters.
Albuquerque and Meyer (2001) suggested that BIC involves a more stringent penalty for the number of pa-rameters used and is therefore more efficient to select the most parsimonious model. Therefore, in this re-search, BIC was used as the model selection criterion.
Results
Theresults of the model comparison are presented in
Table 2. Among the repeatability and pre-structured multivariate models, model 6 had the lowest BIC. Re-peatability model is used for genetic analysis of re-peated records. Therefore, the results derived from the best model (model 6) and the repeatability models are presented.
The trend in additive genetic and residual variance of milk yield measured at 1st, 2nd, 3rd, 4th and 5th
lacta-tions using the best model (model 6) and the repeatabil-ity model were shown in Figure 1. A value of
461,000kg2was estimated for the animal permanent
en-vironmental variance of the milk yield when repeatabil-ity model was applied. This value was presented sepa-rately as it was only estimated by the repeatability model.
The estimates of heritability and genetic and pheno-typic correlations of the milk yield measured at first, second, third, fourth and fifth lactations derived from the most parsimonious model (Model 6) are shown in Table 3. Accordingly, genetic correlations between the milk yield were unity. A range of 0.27 to 0.48 was found for the phenotypic correlations. Based on assumptions of repeatability model, genetic and phenotypic correla-tions among the milk yields were considered to be unity where this model was applied.
The heritability of the milk yields was estimated us-ing the respective variance components. The estimates of heritability for the milk yields were between 0.07 to 0.27 using the best model. Values of 0.18 and 0.36 were derived from repeatability model for heritability and re-peatability of the milk yields, respectively. The trends in the heritabilities estimated by the preferred model (model 6) and the repeatability model are presented in Figure 2.
Discussion
The mean of milk yield increased sharply from 1st to 3rd
lactations, and then decreased slightly for the later lac-tations.The results of the model comparison showed that the repeatability model (Model 1) was the worst fit to the data (Table 2). A smaller value was found for BIC when Model 2 was fitted. Therefore, heterogeneous structure is more appropriate for the residual co (varian-
Table 2. Number of parameters estimated (np), log likelihood values (Log L), and Bayesian Information Criterion (BIC) for the models used
Model Description np Log L BIC
1 Repeatability 3 -5151 10318
42
Figure 1. Estimates of the additive genetic variance (left) and residual variance (right) of milk yield at different lactations using repeatability (Model 1) and pre-structured multivariate (Model 6) models
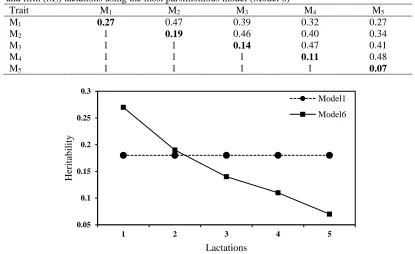
Table 3. Estimates of heritabilities (on diagonal), phenotypic correlations above diagonal and genetic correlations below diagonal for milk yield measured at first (M1), second (M2), third (M3), fourth (M4) and fifth (M5) lactations using the most parsimonious model (Model 6)
Trait M1 M2 M3 M4 M5
M1 0.27 0.47 0.39 0.32 0.27
M2 1 0.19 0.46 0.40 0.34
M3 1 1 0.14 0.47 0.41
M4 1 1 1 0.11 0.48
M5 1 1 1 1 0.07
Figure 2. Estimates of the heritability of milk yield at different lactations using repeatability (Model 1) and pre-structured multivariate (Model 6) models
ce) than the homogenous structure that is considered in Model 1 (the repeatability model). Fitting a model where the genetic variance of first lactation was distin-guished from the other lactations (Model 3), did not im-prove the previous models significantly.Better results were obtained when the genetic variance of milk yield takenatsecond lactationaswell asfirst lactationwas
separated from the later lactations(Model 4). An im-provement was found when Model 5 was fitted. This model improved when a complete heterogeneous ge-netic variance (Model 6) was considered.
Comparison of the models indicated that a pre-struc-tured multivariate model that is model 6 was the best model for genetic analysis of the data, as it had the low-
200 250 300 350 400 450 500 550
1 2 3 4 5
Var
ian
ce
(
1
0
0
0
k
g
2)
Lactations
Model1 Model6
1000 1500 2000 2500 3000 3500
1 2 3 4 5
Var
ian
ce
(
1
0
0
0
k
g
2)
Lactations
Model1 Model6
0.05 0.1 0.15 0.2 0.25 0.3
1 2 3 4 5
Her
itab
ilit
y
Lactations
43 est BIC value (Table 2). Asadi Fozi et al. (2012) showed
that pre-structured multivariate models are more appro-priate than the repeatability model for genetic analysis of mean fibre diameter in fine and medium wool Merino sheep. Coelli et al. (1998) reported modelling (co)vari-ance structure across ages for wool traits in medium wool Merino sheep using autoregressive, banded and a series of other pre-structured multivariate models. They found a banded correlation as the best multivariate model for (co) variance structure of ages of mean fibre diameter.A pre-structured multivariate model was the best model for lifetime genetic analysis of milk yield in Iranian Holstein cows where a series of pre-structured multivariate model and repeatability model were fitted (Zeynadini et al., 2014).In the previous studies, hetero-geneous genetic co (variance) structure was used while in the current study homogeneous genetic co (variance) was considered.
No similar previous studies were found to be dis-cussed and compared with the present results. Therefore in the following paragraphs, the results of the pre-struc-tured multivariate model (Model 6) will be discussed and then compared with the repeatability model.
The results of the best model show that the additive genetic variance increased from 1st lactation to 2nd
lac-tation, while for the later ages the additive genetic vari-ance was decreased. A homogenous genetic varivari-ance was estimated for the milk yield measured at the differ-ent lactations using repeatability model as the model al-lowed no change (Figure 1).The residual variance in-creased from 1st to 5th lactations when the best model
was applied while the same values were derived from the repeatability model for the residual variance during the lactations (Figure 1).
The trends in heritability of milk yields measured at different lactations are shown in Figure 2. The results of the best model (model 6) show the heritability of the milk yield reduced from 1st lactation to 5th location
where a value of 0.27 was found for heritability of milk yield at first lactation. This value reduced to 0.19, 0.14, 0.11 and 0.07 in 2nd, 3rd, 4thand 5th lactations,
respec-tively. The deceasing in heritability is due to increasing residual variance from 1st to 5th lactation while the
ge-netic variance was slightly increased from 1st to 2nd
lac-tation and then decreased for the later laclac-tations. The same values (0.18) were estimated for the heritability of milk yield measured at the different lactations using the repeatability model, because homogenous genetic and residual variances were assumed and estimated for this model.
In this study, the milk yields were assumed as one char-acter expressed across the different lactations. Then for
both repeatability and the best model, unity genetic cor-relations were assumed among the repeated records. In repeatability model, phenotypic correlation among the repeated records was also assumed to be unity while moderate to high values (0.27 to 0.48) were estimated for the phenotypic correlations using the preferred model (Model 6) (Table 3). The lowest correlation (0.27) was found between milk yield measured at first and fifth lactations and the highest value (0.48) was be-tween fourth and fifth lactations. The results clearly in-dicate that the phenotypic correlations become weaker as the age difference increased.
Conclusions
Repeatability and unstructured multivariate models are widely used for genetic analysis of repeated observa-tions while in this study a pre-structured multivariate model was chosen as the best approach according to the Schwarz’s Bayesian Information Criterion (BIC). The results of the best model showed that heterogeneous re-sidual co (variance) and genetic variance gave a better fit to the data where the heritability of the milk yields and phenotypic correlations among the milk yields were changed during different lactations while repeatability model allowed no changes in the heritability and as-sumed a unity phenotypic correlation, because homoge-nous structures were fitted for the co (variances) in this model. Consequently, lifetime milk yield may not be ac-curately analyzed based on repeatability model. In the current study a homogenous genetic covariance was considered among the milk yields which can be appro-priately modelled in future studies.
Acknowledgments
We are grateful to the Iranian Animal Breeding Center for providing us the data.
References
Albuquerque, L. G., Meyer, K., 2001. Estimates of covari-ance functions for growth from birth to 630 days of age in Nellore cattle.Journal of Animal Science 79, 2776-2789.
AsadiFozi, M., Van der Werf, J. H. J., Swan, A. A., 2012.Modelling genetic co (variance) structure across ages of mean fibre diameter in sheep using multivariate and ran-dom regression analysis.Animal Production Science 52, 1019-1026.
Coelli, K. A., Gilmour, A. R., Atkins, K. D., 1998. Compari-son of genetic covariance models for annual measurements of fleece weight and fibre diameter. Proceedings of 6thWorld Congress on Genetics Applied to Livestock
44
Falconer, D. S., 1996. Introduction to quantitative genetics. 4th edition, Longman, London.
Gilmour, A. R., Gogel, B. J., Cullis, B. R., Welham, S. J., Thompson, R., 2002.ASREML User Guide Release 1.0.VSN International Ltd., Hemel Hempstead, HP1 1ES, UK.
Zeynadini, S., 2014.Modelling genetic co (variance) structure across ages of milk production in Holstein cows.M.Sc. The-sis, Shahid Bahonar University of Kerman, Kerman, Iran.
Zhiying, W., Ruijun, W., Jinquan, L., Wenguang, Z., Wuriliga, R. S., Zhihhong, L., Juan, Z., Yonglong, W., Ruiqiang, M and Yanjun, Z. 2014. Modelling genetic co-variance structure across ages of fleece traits in Inner Mon-golia cashmere goat production using repeatability and mul-tivariate analysis. Livestock Science 161, 1-5.
Wolfinger, R. D., 1993. Covariance structure in general mixed models. Communications in Statistics 22B, 1079-1106.
Communicating editor: Ali K.Esmailizadeh
رارکت یاه لدم زا هدافتسا اب ناریا نیاتشلوه یاه واگ رمع لوط رد ریش دیلوت نازیم یکیتنژ زیلانآ
نیعم هریغتم دنچ و یریذپ
یزوف یدسا .م
*هدکشناد ،یماد مولع یسدنهم شخب ناریا ،نامرک ،نامرک رنهاب دیهش هاگشناد ،یزرواشک
.
* :کینورتکلا تسپ ،لوئسم هدنسیون
هدیکچ
یریذپ رارکت لدم زا هدافتسا اب ناریا نیاتشلوه یاه واگ مجنپ ات لوا یهد ریش یا هرود ریش دیلوت یاه دروکر
یکیت ت ژ ایراو راتااااس اب هریغتم دنچ لدم نیدنچ و و جم رد د دااش زیلا ا آوافتم یااشیازفا
313006 دیلوت دروکر
یوررب اه دروکر نیا دش هدافتس اریش 116531
یاهلاس یط هک ناویح 1381
یلا 1385 یریگ هزاد ا د دوب هدما ای د هب
ناد زرف اه واگ نیا دش 2355
و ردپ 91212 یراو( وک راتااس اب نیعم هریغتم دنچ ل دم کی د دوب ردام هد ا یقاب )ژ ا
هدافتس ا دروم هریغتم دنچ یاه لدم ریاس و یریذپ رارکت لدم اب هس یاقم رد نگ ها یکیت ت ژ ایراو راتااس و نگ ه ا ،موس ،مود ،لوا یاه هرود ریش دیلوت نازیم تثارو دش باخت ا ریش دیلوت نازیم یکیت ت زیلا ا یارب لدم نیرتهب ناونع هب اب یهدریااش مجنپ و مراهچ بیترت هب بختنم لدم زا هدافتااسا
27 / 0 ، 19 / 0 ، 14 / 0 ، 11 / 0 و 07 / 0 هکیلاح رد دااش دروارب
یریذپ رارکت لدم زا هدافتس ا اب ریش دیلوت نازیم یریذپ تثارو 0.18
رد یریذپ رارکت لدم هک داد ناش جیات دش دروارب
یکیت تزیلا ا یارب بااسانم یلدم نیعم هریغتم دنچ یاه لدم اب هااسیاقم دو یااسررب دروم تیع ع رد ریااش دیلوت نازیم