R E S E A R C H
Open Access
Diffusion MRI quantifies early axonal loss in
the presence of nerve swelling
Tsen-Hsuan Lin
1†, Chia-Wen Chiang
1,7†, Carlos J. Perez-Torres
1,8, Peng Sun
1, Michael Wallendorf
2,
Robert E. Schmidt
3, Anne H. Cross
4,5and Sheng-Kwei Song
1,5,6,9*Abstract
Background:Magnetic resonance imaging markers have been widely used to detect and quantify white matter pathologies in multiple sclerosis. We have recently developed a diffusion basis spectrum imaging (DBSI) to distinguish and quantify co-existing axonal injury, demyelination, and inflammation in multiple sclerosis patients and animal models. It could serve as a longitudinal marker for axonal loss, a primary cause of permanent neurological impairments and disease progression.
Methods: Eight 10-week-old female C57BL/6 mice underwent optic nerve DBSI, followed by a week-long recuperation prior to active immunization for experimental autoimmune encephalomyelitis (EAE). Visual acuity of all mice was assessed daily. Longitudinal DBSI was performed in mouse optic nerves at baseline (naïve, before immunization), before, during, and after the onset of optic neuritis. Tissues were perfusion fixed after final in vivo scans. The correlation between DBSI detected pathologies and corresponding immunohistochemistry markers was quantitatively assessed.
Results: In this cohort of EAE mice, monocular vision impairment occurred in all animals. In vivo DBSI detected, differentiated, and quantified optic nerve inflammation, demyelination, and axonal injury/loss, correlating nerve pathologies with visual acuity at different time points of acute optic neuritis. DBSI quantified, in the presence of optic nerve swelling, ~15% axonal loss at the onset of optic neuritis in EAE mice.
Conclusions: Our findings support the notion that axonal loss could occur early in EAE mice. DBSI detected pathologies in the posterior visual pathway unreachable by optical coherence tomography and without confounding inflammation induced optic nerve swelling. DBSI could thus decipher the interrelationship among various pathological components and the role each plays in disease progression. Quantification of the rate of axonal loss could potentially serve as the biomarker to predict treatment outcome and to determine when progressive disease starts.
Keywords:Optic neuritis, Multiple sclerosis, Axonal loss, DBSI, Diffusion MRI
Background
Multiple sclerosis (MS) is an inflammatory demyelinat-ing disease producdemyelinat-ing, ultimately, irreversible axonal loss and permanent neurological impairments [1–4]. The axonal pathology is complex with components directly associated with the fiber tracts (axonal injury/loss and
demyelination) and those surrounding the tracts (im-mune cell infiltration and edema). Each of these axonal pathology components may contribute to neurological dysfunction and therefore to the clinical signs and symp-toms of MS [4–6]. Although inflammation and demye-lination each contributes to MS pathophysiology, axonal loss is believed to be the primary correlate of irreversible neurological disability [7, 8]. Therefore, the development of a non-invasive biomarker to reflect the extent of axonal loss and the severity of damage in surviving axons is paramount to confirmation of this notion, to better monitor individual patients, and to use as an * Correspondence:[email protected]
†Equal contributors 1
Radiology, Washington University School of Medicine, 660 S Euclid Ave, St. Louis, MO 63110, USA
5Hope Center for Neurological Disorders, Washington University School of
Medicine, 660 S Euclid Ave, St. Louis, MO 63110, USA
Full list of author information is available at the end of the article
endpoint in trials of potential therapeutics. Optic neur-itis is commonly one of the first manifestations of MS [9, 10]. Optic neuritis, much like MS, is characterized by inflammatory demyelination and varying degrees of axonal injury [10]. Optic nerve dysfunction leads to im-pairment of visual function which can be monitored in mice in a clinically relevant manner [11]. As such, mouse models of optic neuritis present an opportunity to evaluate the connection between imaging, pathology, and function in a disorder like MS.
Several different magnetic resonance imaging (MRI) biomarkers have recently been evaluated in MS [12–14]. Diffusion tensor imaging (DTI), in particular, is one of the commonest tools for evaluating white matter disease as, under some circumstances, it can distinguish axonal injury from demyelination [15–17]. However DTI-derived metrics are obfuscated by the presence of in-flammatory pathology [18, 19]. We recently developed a new diffusion MRI approach called diffusion basis spectrum imaging (DBSI) that is able to separately quan-tify the axonal and inflammatory pathologies [20, 21]. DBSI models the diffusion signal as a linear combination of anisotropic diffusion tensors reflecting fibers, which in white matter are predominantly axon fibers, and a spectrum of isotropic diffusion tensors which encompass cells, edema, and cerebrospinal fluid [20, 22]. In the study reported here, we applied DBSI at the onset of optic neuritis (ON) in the experimental autoimmune encephalomyelitis (EAE) mouse model. DBSI is able to distinguish and quantify axon injury, demyelination, cellular infiltration and edema, and axonal loss.
Methods
EAE mouse model of optic neuritis
All experiments were performed on 10-week-old female C57BL/6 mice (The Jackson Laboratory, Bar Harbor, ME). All mice were housed and maintained in the Washington University animal facility and subjected to a 12-h light/dark cycle with constant access to nourish-ments. The EAE model of optic neuritis was induced as previously described [22]. Mice were immunized with 50μg myelin oligodendrocyte peptide (MOG35-55) emul-sified in incomplete Freund’s adjuvant with 50μg Myco-bacterium tuberculosis. Mice further received 300 ng intravenous adjuvant pertussis toxin (PTX, List Labora-tories, Campbell, CA) on the day of and 2 days after immunization. Eight mice were studied.
Visual acuity (VA) measurements
Visual acuity, utilized to measure visual function in parallel to clinical signs, was assessed with the Virtual Optometry System (Optomotry, Cerebral Mechanics, Inc., Canada) as previously described [23]. In short, mice were presented with virtual rotating columns displayed
on four LCD screens. The spatial frequencies in cycle/ degree (c/d) were changed starting from 0.1 c/d with step size of 0.05 c/d until the mouse stopped responding. VA is then defined as the highest spatial frequency to which the mouse was able to respond. Left and right eye VA can be assessed by the direction of rotating columns, clockwise for left eye and vice versa [24]. If the mouse did not respond to 0.1 c/d, VA was assigned to be 0 c/d. With this technique, it is possible to separately assess the VA of each eye by switching the rotational direction of the columns. Visual impairment was defined as VA
≤0.25 c/d, based on our previous work [22]. Normal VA was confirmed before immunization and then assessed daily after immunization.
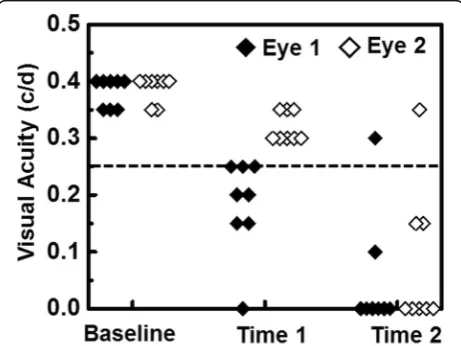
For each mouse in our cohort, onset of optic neuritis, as indicated by impairment of visual function defined by VA, did not occur simultaneously for both eyes. We therefore defined time 1 as the day in which the first eye had a VA ≤0.25 c/d and time 2 as the day in which the second eye had a VA ≤0.25 c/d. Concordantly, for each mouse, eye 1 is the eye affected at time 1 and eye 2 is the eye affected at time 2. VA for each eye is presented in Fig. 1. Based on this experimental paradigm, time 1 and time 2 corresponded to onset and post-onset of optic neuritis for eye 1 and pre-onset and onset of optic neuritis for eye 2, respectively.
Magnetic resonance imaging (MRI) measurements
MRI experiments were performed on a 4.7 T Agilent DirectDrive™ small-animal MRI system (Agilent Tech-nologies, Santa Clara, CA) equipped with Magnex/Agi-lent HD imaging gradient coil (Magnex/AgiMagnex/Agi-lent, Oxford,
UK) with pulse gradient strength up to 58 G/cm and a gradient rise time≤295 μs. Mice were anesthetized with 1% isoflurane in oxygen and placed in a custom made 3-point immobilization head holder. Breathing rate was monitored, and body temperature was maintained at 37 °C with a small animal physiological monitoring and control unit (SA Instruments, Stony Brook, NY). An ac-tively decoupled volume (transmit)/surface (receive) coil pair was used for MRI excitation and signal reception. Diffusion-weighted MRI data was acquired with a trans-verse slice of mouse brain with two optic nerves, as nearly orthogonal to the image slice as possible. A multi-echo spin-echo diffusion-weighted sequence [25] with an icosa-hedral 25-direction diffusion-encoding scheme [26] com-bined with one b= 0 was employed and MR acquisition parameters were TR of 1.5 s, TE of 37 ms, time between gradient pulses (Δ) of 18 ms, gradient pulse duration (δ) of 6 ms, maximumb-value of 2200 s/mm2(each encoding direction has a uniqueb-value), slice thickness of 0.8 mm, and in-plane resolution of 117μm2.
MRI data analysis
Data was analyzed with DBSI multi-tensor and conven-tional DTI single-tensor analysis packages developed in-house with Matlab [20, 21]. For optic nerve, we have a coherent fiber bundle, the diffusion-weighted imaging data was modeled according to Eq. 1:
Sk¼f e−bk ⇀
j jλ⊥e−j jb⇀kðλ∥−λ⊥Þcos2Φ
k
þ
Z b
a f D
ð Þe−j jb⇀kDdD ðk¼1; 2; 3;…; 25Þ:
ð1Þ
The quantitiesSkand j jb⇀k are the signal andb-value of
thekthdiffusion gradient,Φkis the angle between thekth diffusion gradient and the principal direction of the an-isotropic tensor, λ|| and λ⊥ are the axial and radial diffusivities of the anisotropic tensor, f is the signal intensity fraction for the anisotropic tensor, andaandb are the low and high diffusivity limits for the isotropic diffusion spectrum (reflecting cellularity and edema, respectively) f(D). DBSI derivedf represents retinal gan-glion cell (RGC) axon density (fiber fraction) in the image voxel, accounting for intra-voxel pathological and structural complications. DBSI derived λ|| and λ⊥reflect residual axon and myelin integrity respectively: ↓ λ||≈ axonal injury and ↑ λ⊥≈demyelination [20–22, 27]. Based on our previous experimental findings, the re-stricted isotropic diffusion fraction reflecting cellularity is derived by the summation of f(D) at 0 ≤ ADC ≤ 0.3μm2/ms. The summation of the remaining f(D) at 0.3 < ADC ≤ 3 μm2/ms represents non-restricted isotropic diffusion, which putatively denotes vasogenic edema and CSF [20–22, 27].
Regions of interest (ROI) were manually drawn in the center of each optic nerve on the diffusion-weighted image, corresponding to the diffusion gradient direction perpendicular to optic nerves, to minimize partial vol-ume effects. ROIs were then transferred to the paramet-ric maps to calculate the mean for each of the DBSI and DTI-derived metrics.
ROI for DBSI fiber fraction
Separate ROIs encompassing the whole optic nerve were drawn on the diffusion-weighted images (DWI) with diffusion-weighting gradient orthogonal to the optic nerve, which were larger than the ROIs for measuring DBSI- or DTI-derived metrics. The partial volume effect of surrounding cerebrospinal fluid for ROIs outlining optic nerve cross-section area estima-tion was minimized because surrounding cerebrospinal fluid signal was eliminated via diffusion weighting. DBSI analysis models axonal fibers as anisotropic dif-fusion tensor components excluding any residual free isotropic CSF signal.
Immunohistochemistry
Immediately after the final MRI time point, mice were deeply anesthetized and underwent perfusion via the left cardiac ventricle with phosphate-buffered saline (PBS) followed by 4% paraformaldehyde (PFA). Brains were ex-cised after intra-cardiac perfusion fixation with 4% PFA at 4 °C and then transferred to PBS for further storage until processing. Optic nerves were then dissected, em-bedded in 2% agar, and then further emem-bedded in paraf-fin wax [28]. Parafparaf-fin blocks were sectioned at 5-μm thick, deparaffinized, and rehydrated for immunohisto-chemistry analysis. Sections were blocked with 5% nor-mal goat serum and 1% bovine serum albumin in PBS for 30 min at room temperature to prevent non-specific binding. Slides were then incubated overnight at 4 °C
with primary antibody and then 1 h at room
ImageJ (http://rsbweb.nih.gov/ij/plugins/volume-viewer. html, NIH, US). Images were then undergone back-ground subtraction, bilateral filter for edge preservation, watershed segmentation, threshold determination, and the analyze particles macro for SMI-312, SMI-31, and MBP area calculation and then normalized by entire area of optic nerve. Background subtraction, watershed seg-mentation, threshold determination, and analyze particles were used for DAPI counts.
Statistics
For all the boxplots, whiskers extend to the minimum/ maximum and the mean is marked as diamonds. Data were collected in a nested design where each mouse had two periods (eye 1 and 2) each containing repeated mea-surements at baseline, time 1, and time 2. Data were an-alyzed with a mixed random effect repeated measures model with period, time, and period by time interaction fixed effects. Contrasts were estimated for change from baseline to times 1 and 2, averaged over periods. Degrees of freedom were adjusted with Kenward-Rogers method. A first order auto-regressive covariance structure was used to account for repeated measures. The correlation of histology data and DBSI measurements at time 2 were analyzed by simple linear regression.
Results
Monocular visual acuity decrease at the onset of optic neuritis
After immunization, daily VA of EAE mice (n= 8) was confirmed. When VA≤0.25 c/d, defined as onset of ON [22], DBSI was performed and the eye was defined as eye 1 at time 1 (12.1 ± 1.9 days post-immunization, mean ± SD,n= 8). The other eye was defined as eye 2. When the
VA of eye 2 decreased below 0.25 c/d, DBSI was per-formed again at the same day (14.4 ± 1.7 days post-immunization, mean ± SD, n= 8, one eye 2 did not de-velop ON but still included in statistical analyses) defined as time 2 (Fig. 1). There was no difference between eye 1 and eye 2 at time 2 (p= 0.15).
DBSI reflected acute inflammation and axonal pathology specifically
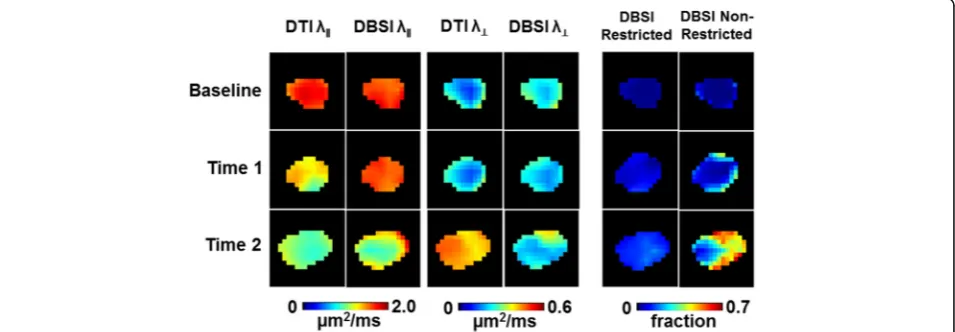
DTI- and DBSI-derived parametric maps from EAE optic nerve revealed decreased DTI-λ∥ (1.65 ± 0.16μm2/ms vs. control 1.79 ± 0.12 μm2/ms, p< 0.05), normal DBSI-λ∥ (1.82 ± 0.08μm2/ms vs. control 1.79 ± 0.12 μm2/ms, p= 0.059) and normal DTI-λ⊥(0.16 ± 0.03μm2/ms vs. control 0.16 ± 0.04 μm2/ms, p= 0.088) and DBSI-λ⊥ (0.20 ± 0.03μm2/ms vs. control 0.17 ± 0.03μm2/ms,p= 0.065) at time 1 (Fig. 2). Similarly, mild but not significant inflam-matory cell infiltration and putative significant vasogenic edema, manifested as the increased DBSI restricted (0.03 ± 0.01 vs. control 0.01 ± 0.01,p= 0.29) and non-restricted (0.04 ± 0.03 vs. control 0.02 ± 0.01, p < 0.05) isotropic diffusion fractions, was also seen at time 1 in this particu-lar nerve. Both DTI and DBSI measurements showed decreasedλ∥(DTIλ∥: 1.25 ± 0.32μm2/ms vs. control 1.79 ± 0.12 μm2/ms, p< 0.005 and DBSI λ∥: 1.57 ± 0.17 μm2/ ms vs. control 1.79 ± 0.12 μm2/ms, p< 0.005) and in-creasedλ⊥(DTIλ⊥: 0.22 ± 0.06μm2/ms vs. control 0.16 ± 0.04μm2/ms, p< 0.005 and DBSIλ⊥: 0.21 ± 0.03μm2/ms vs. control 0.17 ± 0.03 μm2/ms, p= 0.16) at time 2, sug-gesting axonal and myelin injury, respectively [16]. Con-sistent with the increased DBSI restricted (0.08 ± 0.05 vs. control 0.01 ± 0.01, p< 0.005) and non-restricted (0.09 ± 0.06 vs. control 0.02 ± 0.01, p< 0.05) isotropic diffusion fractions, exaggerated DTI λ∥ and λ⊥ change at time 2
Fig. 2DTI- and DBSI-derived parametric maps of one representative EAE optic nerve (eye 1) from baseline (top row), time 1 (middle row, onset), and time 2 (bottom row, onset of the fellow eye). Decreased axial diffusivity (λǁ,columns 1 and 2) and increased radial diffusivity (λ⊥,columns 3
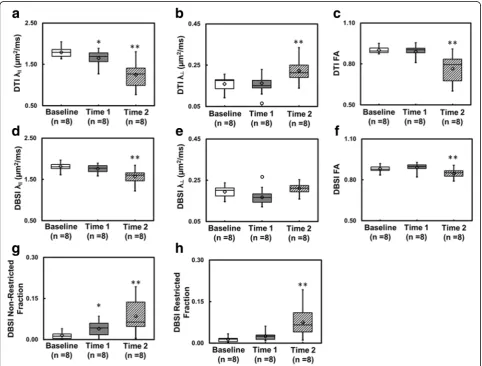
paralleled inflammatory cell infiltration and putative vaso-genic edema (Fig. 2). Data from eye 1 and eye 2 were aver-aged at baseline, time 1 and time 2. Exaggerated changes in DTI-derived maps (Fig. 3a–c) when compared to DBSI-derivedλ∥,λ⊥, and FA (Fig. 3d–f ) at time 2, resulted from confounding effects from inflammation (Fig. 3g, h). For the EAE mice in this cohort, slightly increased inflamma-tory cell infiltration (seen as increased DBSI restricted fraction, Fig. 3h) and significant edema (as increased DBSI non-restricted fraction, Fig. 3g, p< 0.05) at time 1 were seen while axon and myelin damage was still absent (Fig. 3d–f ). The EAE mice in this cohort developed axonal injury (Fig. 3d), mild demyelination (Fig. 3e), and signifi-cantly increased cell infiltration (Fig. 3g) and edema (Fig. 3h) at acute ON.
DBSI detected and quantified axonal loss in the presence of optic nerve swelling
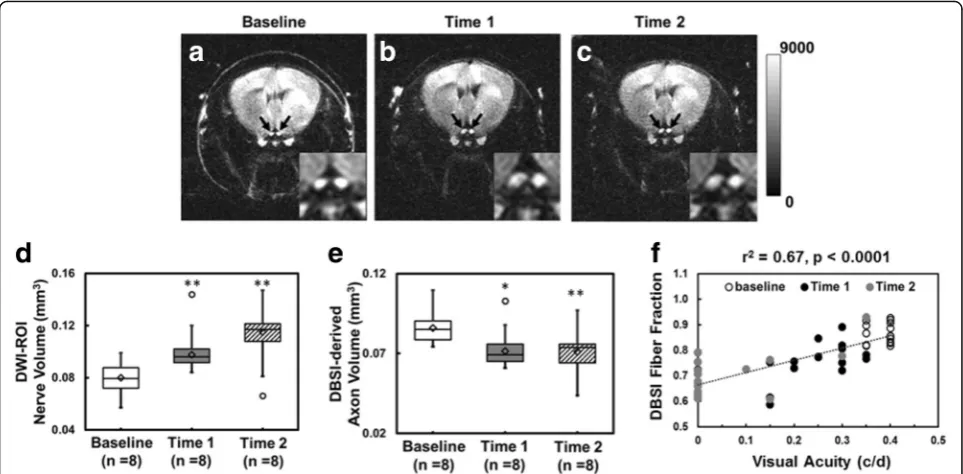
Onset of EAE ON was highly associated with inflamma-tory cell infiltration and putative edema, which led to optic nerve swelling in diffusion-weighted images (DWI, Fig. 4a–c). Group-average of nerve volume showed sig-nificant swelling at time 1 (0.10 ± 0.01 mm3 vs. control 0.08 ± 0.01 mm3, p< 0.005) and 2 (0.12 ± 0.02 mm3 vs. control 0.08 ± 0.01 mm3, p< 0.005, Fig. 4d). The corre-sponding DBSI-derived axon volume (nerve volume multiplying DBSI fiber fraction of corresponding ROI) demonstrated significant 16 and 17% axonal loss at time 1 and time 2, respectively (Fig. 4e). DBSI fiber fraction correlated well with VA measurement from baseline to time 2 (Fig. 4f ).
Fig. 3Box plots summarize the group distribution of DTI-derivedλǁ,λ⊥, and FA (a–c) and DBSI-derivedλǁ,λ⊥, FA, restricted, and
non-restricted diffusion fraction (d–h) from baseline, time 1, and time 2, respectively. Axonal injury developed at time 2 suggested by the significantly decreased DTI- and DBSI-λǁ(a,d,p< 0.005). At time 1, significant decrease was only seen in DTI-λǁbut not in DBSI-λǁreflecting the confounding effects of inflammatory cell infiltration and vasogenic edema (a,d). The same confounding effects also resulted in increased DTI-λ⊥at time 2 but not in DBSI-λ⊥(b,e).The distribution of DBSI results (d–f) was much tighter than DTI
Immunohistochemistry of optic nerve
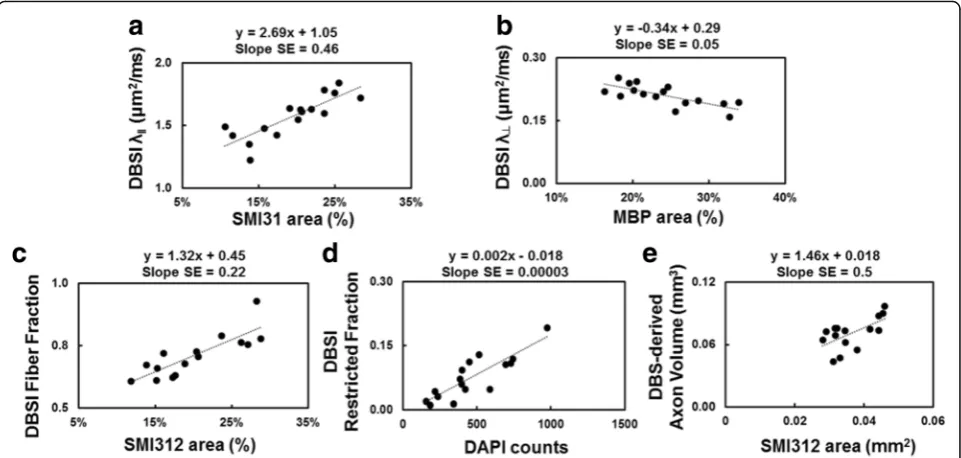
Post-MRI immunohistochemistry staining of optic nerves (Fig. 5) was used to assess axon (312, SMI-31) and myelin (MBP) integrity, and extent of cellularity (DAPI). The EAE optic nerves showed significant axonal swelling (yellow arrows, Fig. 5a), inflammation, and axonal injury (red and white circles, Fig. 5b, c). Both eyes from each EAE mouse was selected for the regression analyses. The regression of SMI-31, MBP, and SMI-312 area fraction and DBSIλ∥, DBSI λ⊥, DBSI fiber fraction, and DBSI restricted fraction (Fig. 6a–d) supported that DBSI indexes were able to reflect the optic-nerve path-ologies. Similarly, DBSI-derived axon volume was able to reflect SMI-312 area (Fig. 6e).
Discussion
We examined optic nerve pathology in EAE mice at the onset of the ON when VA impairment was observed (Fig. 1). Optic neuritis in EAE-affected mice, much like in MS, is heterogeneous in pathology with a mixture of axonal injury, demyelination, cellular inflammation, and edema (Fig. 5) [22, 29–31]. We employed DBSI to moni-tor the evolving optic nerve pathology in EAE mice with ON by distinguishing and quantifying inflammation, demyelination, and axonal injury/loss simultaneously (Figs. 3, 4, and 6). DBSI parameters suggested the
presence of prominent inflammation-associated increase in cellularity and edema at the onset of ON (Fig. 3g, h), consistent with the postmortem immunohistochemistry findings (Figs. 5 and 6). These pathological components not only contributed to the impaired visual function clinically but also confounded interpretation of DTI de-rived axonal injury and demyelination metrics (Fig. 3a– c).
Current MRI diagnostic approaches fail to accurately assess the progression of MS. Advanced MRI measures such as quantitative relaxation, diffusion, and magnetization transfer imaging provide more informa-tion than conveninforma-tional MRI but unfortunately cannot distinguish between reversible and irreversible patholo-gies. Imaging markers sensitive and specific to axonal loss, which is thought to be irreversible, would provide the critical tools needed for assessing MS progression. The advent of optical coherence tomography (OCT) has enabled the quantification of neuronal (ganglion cell layer/inner plexiform layer, GCL + IPL) and axonal (ret-inal nerve fiber layer, RNFL) loss in the visual system allowing the direct correlation of structure with func-tion [32–34]. In MS patients with or without history of clinical optic neuritis, GCL + IPL and RNFL thinning can be observed [35, 36]. Interestingly, OCT-detected RNFL thinning has also been reported to
correlate with brain atrophy [37–41]. The portions of the anterior visual pathway measured using OCT have thus been considered to reflect the more global central nervous system (CNS) integrity; OCT has increasingly been sug-gested as an outcome measure in MS [42–45].
However, OCT is not as useful in the presence of early acute inflammation, due to the confounding presence of acute cell infiltration and vasogenic edema [46]. The posterior visual pathway (optic nerves/tracts/radiations) is not directly visualized by OCT due to the limited penetration of the technique. Moreover, the ability of OCT-detected intraocular pathologies to represent CNS pathologies outside of the visual system is indirect and imperfect in the individual patient. Thus, imaging bio-markers that can interrogate the entire CNS white mat-ter, and distinguish and quantify different components of pathology without succumbing to their confounding interferences are greatly needed in MS. DBSI fiber frac-tion estimated axonal density of the optic nerve includ-ing the dilution effect of inflammation (optic nerve swelling on DWI, Fig. 4a–c) in each voxel. The
correlation of VA and DBSI fiber fraction indicated that visual function was affected by inflammation (revers-ible) and axonal loss (irreversible, Fig. 4d). The recov-ery of visual function independent of initial visual loss in MS patients with optic neuritis may suggest the irreversible axonal loss is below the threshold of permanent vision loss [10, 47].
We contend that DBSI could provide the unmet needs in MS and neurological disorders in general by present-ing specific pathological metrics to quantitatively reflect axonal injury, demyelination, inflammation, and axonal loss. A longitudinal DBSI measurement could assess the effectiveness of anti-inflammatory therapies on axonal preservation by longitudinally assessing axonal patholo-gies in real time. The axonal loss in this cohort of EAE mice occurred early (Fig. 6e). Since axonal integrity plays a crucial role in neurological disability [48, 49], longitu-dinal measurements of DBSI-derived axonal volume could potentially quantify the rate of irreversible axonal loss and serve as a biomarker of MS progression preceding detect-able clinical symptoms.
Conclusions
Our findings support the notion that axonal loss could occur early in EAE mice. Diffusion basis spectrum im-aging detected pathologies in the posterior visual path-way unreachable by optical coherence tomography and without confounding inflammation induced optic nerve swelling. Diffusion basis spectrum imaging could thus decipher the interrelationship among various patho-logical components and the role each plays in disease progression. Quantification of the rate of axonal loss could potentially serve as the biomarker to predict treat-ment outcome and to determine when progressive dis-ease starts.
Abbreviations
CNS:Central nervous system; DBSI: Diffusion basis spectrum imaging; DTI: Diffusion tensor imaging; EAE: Experimental autoimmune encephalomyelitis; GCL + IPL: Ganglion cell layer/inner plexiform layer; MS: Multiple sclerosis; OCT: Optical coherence tomography; ON: Optic neuritis; PBS: Phosphate-buffered saline; PFA: Paraformaldehyde; RNFL: Retinal nerve fiber layer; VA: Visual acuity
Acknowledgements
The authors thank Mr. Bob Mikesell for excellent technical assistance.
Funding
This study was supported in part by the grants from National Institute of Health R01-NS047592 (S.-K.S.), P01-NS059560 (A.H.C.),
U01-EY025500 (S.-K.S.), National Multiple Sclerosis Society (NMSS) RG 4549A4/ 1 (S.-K.S.), RG-1507-05315 (T.-H. L.), and Department of Defense Idea Award W81XWH-12-1-0457 (S.-K.S.). AHC was supported in part by the Manny and Rosalyn Rosenthal-Dr. John L. Trotter MS Center Chair in Neuroimmunology of Barnes-Jewish Hospital Foundation.
Availability of data and materials
Please contact author for data requests.
Authors’contributions
THL, CWC, and CJPT conducted experiments, analyzed data, and jointly wrote the manuscript. PS designed the data processing routine and helped analyzing the DBSI data. MW helped with experiment design and conducted the statistical analyses. RES helped with tissue histological analysis design and evaluation. AHC designed experiments and wrote the manuscript. SKS designed experiments and the data processing software, helped analyzing the data, and significantly contributed to the writing of the manuscript. All authors read and approved the final manuscript.
Competing interests
S.-K. Song is the co-inventor of DBSI: USA patent Serial No. 61/345,367: Y. Wang, Q. Wang, S.K. Song,“Diagnosis of Central Nervous System White Matter Pathology Using Diffusion MRI”.
Consent for publication
Not applicable.
Ethics approval
All animal experiments were performed according to protocols approved by the Institutional Animal Care and Use Committee (IACUC) at Washington University and in compliance with the NIH guidelines.
Publisher’s Note
Springer Nature remains neutral with regard to jurisdictional claims in published maps and institutional affiliations.
Author details
1Radiology, Washington University School of Medicine, 660 S Euclid Ave, St.
Louis, MO 63110, USA.2Biostatistics, Washington University School of
Medicine, 660 S Euclid Ave, St. Louis, MO 63110, USA.3Pathology, Washington University School of Medicine, 660 S Euclid Ave, St. Louis, MO 63110, USA.4Neurology, Washington University School of Medicine, 660 S
Disorders, Washington University School of Medicine, 660 S Euclid Ave, St. Louis, MO 63110, USA.6Biomedical Engineering, Washington University, 1
Brookings Dr, St. Louis, MO 63130, USA.7Current Address: Institute of
Biomedical Engineering and Nanomedicine, National Health Research Institute, 35 Keyan Road, Zhunan, Miaoli County 35053, Taiwan.8Current
Address: School of Health Sciences, Purdue University, 550 W Stadium Ave, West Lafayette, IN 47907, USA.9Biomedical MR Laboratory, Washington
University School of Medicine, Campus Box 8227, Room 2313, 4525 Scott Ave, St Louis, MO 63110, USA.
Received: 23 January 2017 Accepted: 26 March 2017
References
1. Bjartmar C, Kidd G, Mork S, Rudick R, Trapp BD. Neurological disability correlates with spinal cord axonal loss and reduced N-acetyl aspartate in chronic multiple sclerosis patients. Ann Neurol. 2000;48:893–901. 2. Kornek B, Lassmann H. Axonal pathology in multiple sclerosis. A historical
note. Brain Pathol. 1999;9:651–6.
3. Trapp BD, Peterson J, Ransohoff RM, Rudick R, Mork S, Bo L. Axonal transection in the lesions of multiple sclerosis. N Engl J Med. 1998;338: 278–85.
4. Trapp BD, Bo L, Mork S, Chang A. Pathogenesis of tissue injury in MS lesions. J Neuroimmunol. 1999;98:49–56.
5. Lassmann H, van Horssen J, Mahad D. Progressive multiple sclerosis: pathology and pathogenesis. Nat Rev Neurol. 2012;8:647–56.
6. Kamm CP, Uitdehaag BM, Polman CH. Multiple sclerosis: current knowledge and future outlook. Eur Neurol. 2014;72:132–41.
7. Bitsch A, Schuchardt J, Bunkowski S, Kuhlmann T, Bruck W. Acute axonal injury in multiple sclerosis. Correlation with demyelination and inflammation. Brain. 2000;123(Pt 6):1174–83.
8. Bjartmar C, Wujek JR, Trapp BD. Axonal loss in the pathology of MS: consequences for understanding the progressive phase of the disease. J Neurol Sci. 2003;206:165–71.
9. Beck RW, Trobe JD, Moke PS, Gal RL, Xing D, Bhatti MT, Brodsky MC, Buckley EG, Chrousos GA, Corbett J, et al. High- and low-risk profiles for the development of multiple sclerosis within 10 years after optic neuritis: experience of the optic neuritis treatment trial. Arch Ophthalmol. 2003;121: 944–9.
10. Shams PN, Plant GT. Optic neuritis: a review. Int MS J. 2009;16:82–9. 11. Torres-Torres R, Sanchez-Dalmau BF. Treatment of acute optic neuritis and
vision complaints in multiple sclerosis. Curr Treat Options Neurol. 2015;17:328. 12. Rueda-Lopes FC, da Cruz LC Jr H, Doring TM, Gasparetto EL.
Diffusion-weighted imaging and demyelinating diseases: new aspects of an old advanced sequence. AJR Am J Roentgenol. 2014;202:W34–42. 13. Narayana PA. Magnetic resonance spectroscopy in the monitoring of
multiple sclerosis. J Neuroimaging. 2005;15:46S–57S.
14. Mallik S, Samson RS, Wheeler-Kingshott CA, Miller DH. Imaging outcomes for trials of remyelination in multiple sclerosis. J Neurol Neurosurg Psychiatry. 2014;85:1396–404.
15. Song SK, Sun SW, Ramsbottom MJ, Chang C, Russell J, Cross AH. Dysmyelination revealed through MRI as increased radial (but unchanged axial) diffusion of water. Neuroimage. 2002;17:1429–36.
16. Song SK, Sun SW, Ju WK, Lin SJ, Cross AH, Neufeld AH. Diffusion tensor imaging detects and differentiates axon and myelin degeneration in mouse optic nerve after retinal ischemia. Neuroimage. 2003;20:1714–22.
17. Song SK, Yoshino J, Le TQ, Lin SJ, Sun SW, Cross AH, Armstrong RC. Demyelination increases radial diffusivity in corpus callosum of mouse brain. Neuroimage. 2005;26:132–40.
18. Sun SW, Liang HF, Trinkaus K, Cross AH, Armstrong RC, Song SK. Noninvasive detection of cuprizone induced axonal damage and demyelination in the mouse corpus callosum. Magn Reson Med. 2006;55:302–8.
19. Xie M, Tobin JE, Budde MD, Chen CI, Trinkaus K, Cross AH, McDaniel DP, Song SK, Armstrong RC. Rostrocaudal analysis of corpus callosum demyelination and axon damage across disease stages refines diffusion tensor imaging correlations with pathological features. J Neuropathol Exp Neurol. 2010;69:704–16.
20. Wang Y, Wang Q, Haldar JP, Yeh FC, Xie M, Sun P, Tu TW, Trinkaus K, Klein RS, Cross AH, Song SK. Quantification of increased cellularity during inflammatory demyelination. Brain. 2011;134:3590–601.
21. Wang Y, Sun P, Wang Q, Trinkaus K, Schmidt RE, Naismith RT, Cross AH, Song SK. Differentiation and quantification of inflammation, demyelination and axon injury or loss in multiple sclerosis. Brain. 2015;138:1223–38. 22. Chiang CW, Wang Y, Sun P, Lin TH, Trinkaus K, Cross AH, Song SK.
Quantifying white matter tract diffusion parameters in the presence of increased extra-fiber cellularity and vasogenic edema. Neuroimage. 2014; 101:310–9.
23. Lin TH, Kim JH, Perez-Torres C, Chiang CW, Trinkaus K, Cross AH, Song SK. Axonal transport rate decreased at the onset of optic neuritis in EAE mice. Neuroimage. 2014;100C:244–53.
24. Douglas RM, Alam NM, Silver BD, McGill TJ, Tschetter WW, Prusky GT. Independent visual threshold measurements in the two eyes of freely moving rats and mice using a virtual-reality optokinetic system. Vis Neurosci. 2005;22:677–84.
25. Tu TW, Budde MD, Xie M, Chen YJ, Wang Q, Quirk JD, Song SK. Phase-aligned multiple spin-echo averaging: a simple way to improve signal-to-noise ratio of in vivo mouse spinal cord diffusion tensor image. Magn Reson Imaging. 2014;32:1335–43.
26. Batchelor PG, Atkinson D, Hill DL, Calamante F, Connelly A. Anisotropic noise propagation in diffusion tensor MRI sampling schemes. Magn Reson Med. 2003;49:1143–51.
27. Wang X, Cusick MF, Wang Y, Sun P, Libbey JE, Trinkaus K, Fujinami RS, Song SK. Diffusion basis spectrum imaging detects and distinguishes coexisting subclinical inflammation, demyelination and axonal injury in experimental autoimmune encephalomyelitis mice. NMR Biomed. 2014;27:843–52. 28. Blewitt ES, Pogmore T, Talbot IC. Double embedding in agar/paraffin wax as an aid to orientation of mucosal biopsies. J Clin Pathol. 1982;35:365. 29. Diem R, Demmer I, Boretius S, Merkler D, Schmelting B, Williams SK, Sattler
MB, Bahr M, Michaelis T, Frahm J, et al. Autoimmune optic neuritis in the common marmoset monkey: comparison of visual evoked potentials with MRI and histopathology. Invest Ophthalmol Vis Sci. 2008;49:3707–14. 30. Gold R, Linington C, Lassmann H. Understanding pathogenesis and therapy
of multiple sclerosis via animal models: 70 years of merits and culprits in experimental autoimmune encephalomyelitis research. Brain. 2006;129: 1953–71.
31. Sun SW, Liang HF, Schmidt RE, Cross AH, Song SK. Selective vulnerability of cerebral white matter in a murine model of multiple sclerosis detected using diffusion tensor imaging. Neurobiol Dis. 2007;28:30–8.
32. Costello F, Coupland S, Hodge W, Lorello GR, Koroluk J, Pan YI, Freedman MS, Zackon DH, Kardon RH. Quantifying axonal loss after optic neuritis with optical coherence tomography. Ann Neurol. 2006;59:963–9.
33. Frohman EM, Fujimoto JG, Frohman TC, Calabresi PA, Cutter G, Balcer LJ. Optical coherence tomography: a window into the mechanisms of multiple sclerosis. Nat Clin Pract Neurol. 2008;4:664–75.
34. Leung CK. Diagnosing glaucoma progression with optical coherence tomography. Curr Opin Ophthalmol. 2014;25:104–11.
35. Walter SD, Ishikawa H, Galetta KM, Sakai RE, Feller DJ, Henderson SB, Wilson JA, Maguire MG, Galetta SL, Frohman E, et al. Ganglion cell loss in relation to visual disability in multiple sclerosis. Ophthalmology. 2012;119:1250–7. 36. Burkholder BM, Osborne B, Loguidice MJ, Bisker E, Frohman TC, Conger A,
Ratchford JN, Warner C, Markowitz CE, Jacobs DA, et al. Macular volume determined by optical coherence tomography as a measure of neuronal loss in multiple sclerosis. Arch Neurol. 2009;66:1366–72.
37. Dorr J, Wernecke KD, Bock M, Gaede G, Wuerfel JT, Pfueller CF, Bellmann-Strobl J, Freing A, Brandt AU, Friedemann P. Association of retinal and macular damage with brain atrophy in multiple sclerosis. PLoS One. 2011;6, e18132.
38. Gordon-Lipkin E, Chodkowski B, Reich DS, Smith SA, Pulicken M, Balcer LJ, Frohman EM, Cutter G, Calabresi PA. Retinal nerve fiber layer is associated with brain atrophy in multiple sclerosis. Neurology. 2007;69:1603–9. 39. Grazioli E, Zivadinov R, Weinstock-Guttman B, Lincoff N, Baier M, Wong JR,
Hussein S, Cox JL, Hojnacki D, Ramanathan M. Retinal nerve fiber layer thickness is associated with brain MRI outcomes in multiple sclerosis. J Neurol Sci. 2008;268:12–7.
40. Sepulcre J, Murie-Fernandez M, Salinas-Alaman A, Garcia-Layana A, Bejarano B, Villoslada P. Diagnostic accuracy of retinal abnormalities in predicting disease activity in MS. Neurology. 2007;68:1488–94.
42. Saidha S, Sotirchos ES, Oh J, Syc SB, Seigo MA, Shiee N, Eckstein C, Durbin MK, Oakley JD, Meyer SA, et al. Relationships between retinal axonal and neuronal measures and global central nervous system pathology in multiple sclerosis. JAMA Neurol. 2013;70:34–43.
43. Calabresi PA, Balcer LJ, Frohman EM. Retinal pathology in multiple sclerosis: insight into the mechanisms of neuronal pathology. Brain. 2010;133:1575–7. 44. Balcer LJ. Clinical trials to clinical use: using vision as a model for multiple
sclerosis and beyond. J Neuroophthalmol. 2014;34(Suppl):S18–23. 45. Balcer LJ, Miller DH, Reingold SC, Cohen JA. Vision and vision-related
outcome measures in multiple sclerosis. Brain. 2015;138:11–27. 46. Syc SB, Saidha S, Newsome SD, Ratchford JN, Levy M, Ford E, Crainiceanu
CM, Durbin MK, Oakley JD, Meyer SA, et al. Optical coherence tomography segmentation reveals ganglion cell layer pathology after optic neuritis. Brain. 2012;135:521–33.
47. Beck RW, Cleary PA, Backlund JC. The course of visual recovery after optic neuritis. Experience of the optic neuritis treatment trial. Ophthalmology. 1994;101:1771–8.
48. Kornek B, Storch MK, Weissert R, Wallstroem E, Stefferl A, Olsson T, Linington C, Schmidbauer M, Lassmann H. Multiple sclerosis and chronic autoimmune encephalomyelitis: a comparative quantitative study of axonal injury in active, inactive, and remyelinated lesions. Am J Pathol. 2000;157:267–76. 49. Lassmann H. Axonal injury in multiple sclerosis. J Neurol Neurosurg
Psychiatry. 2003;74:695–7.
• We accept pre-submission inquiries
• Our selector tool helps you to find the most relevant journal
• We provide round the clock customer support
• Convenient online submission
• Thorough peer review
• Inclusion in PubMed and all major indexing services
• Maximum visibility for your research
Submit your manuscript at www.biomedcentral.com/submit