Transactions D:
Computer Science & Engineering and Electrical Engineering
Vol. 16, No. 2, pp. 104{118 c
Sharif University of Technology, December 2009
On-Chip Interconnection Network
with an Ecient Parallel Buer
Structure and Generic Trac Model
J.H. Bahn
1and N. Bagherzadeh
2;Abstract. In this paper, we present two important topics indirectly related to the design and simulated analysis of Network-on-Chip (NoC) architectures. In order to enhance the performance of the baseline router to achieve maximum throughput,a new parallel buer architecture and its management scheme are introduced. By adopting an adjustable architecture that integrates a parallel buer with each incoming port, the design complexity and its utilization can be optimized. By utilizing simulation-based performance evaluation and comparison with previous NoC architectures, its eciency and superiority are proven. One of the key areas of research addressed in this work is to nd more realistic trac models in order to properly test the buer management schemes proposed in this work. Therefore, we introduce a generic trac model for on-chip interconnection networks that is superior to previous techniques for NoC architectural performance evaluation. Our trac model is based on three empirically-derived statistical characteristics using temporal and spatial distributions. With captured parameters, accurate trac patterns can be generated recursively to show similar statistical characteristics of the observed on-chip networks. Keywords: Network-on-Chip; Virtual channel; Parallel buer; Router; Generic trac mode.
INTRODUCTION
In designing Network-on-Chip (NoC) systems, there are several issues to be considered, such as topology, routing algorithm, performance, latency and complex-ity. All these factors are taken into account when the design of a NoC have developed better perfor-mance routing techniques using oblivious/deterministic or adaptive routing algorithms [1-6]. In addition, adop-tion of the Virtual Channel (VC) has been prevailing because of its versatility. By adding virtual channels and proper utilization of their channels, deadlock-freedom can be easily accomplished. Network through-put can be increased by dividing the buer storage as-sociated with each network channel into several virtual channels [4]. By proper control of virtual channels, network ow control can be easily implemented [7]. Also, to increase the fault tolerance in a network, the
1. Qualcomm CDMA Technologies, Qualcomm Inc., San Diego, CA, 92121-1714, USA.
2. Department of Electrical Engineering and Computer Science, University of California, Irvine, CA, 92697-2625, USA. *. Corresponding author. E-mail: [email protected]
Received 30 January 2009; received in revised form 21 September 2009; accepted 3 November 2009
concept of a virtual channel has been utilized [8,9]. However, in order to maximize utilization, allocation of virtual channels is a critical issue in designing routing algorithms [10,11].
In order to evaluate the performance of either these routing algorithms or their routers, including implementations, many researchers have used conven-tional trac patterns [1,12] or some limited number of real trac traces. Even though these static trac patterns exhibit similar patterns of some particular applications, there is a fundamental limit in covering complete trac patterns of real applications. For this reason, some researchers have used real trac patterns extracted from real applications to evaluate the performance of their proposed routing, algorithm or router based on more practical bench marks [13,14]. In this paper, we proposed a base NoC architec-ture adopting a minimal adaptive routing algorithm with near-optimal performance and feasible design complexity [6]. Based on this NoC architecture, a new routing-independent parallel buer structure and its management scheme are discussed as a viable alter-native to the VC approach. As a result, the channel utilization and maximum throughput in performance are improved. In order to utilize a realistic trac
model for our proposed architectural entrenchment to the NoC router, a generic trac model for NoC environments is described. The proposed model is based on the spatial/temporal prole of trac using three statistical parameters.
The organization of this paper is as follows. In the next section, a brief introduction of base NoC architecture, adopting a minimal adaptive routing algorithm, is provided. While explaining the proposed Parallel Buer (PB) structure and its management scheme, the enhanced NoC architecture including these parallel buers will be introduced. In order to prove its benet, several simulation-based evaluation results and a comparison with the base NoC architecture will be provided. In the following section, an overview of our trac model with three dierent statistical components for NoC is provided and the details of each component are presented. The overall procedure of generating trac patterns with the given parameters is described and the accuracy of the proposed trac model is validated by comparing it with real trac traces. Finally, some conclusions will be drawn. BASE NETWORK-ON-CHIP (NOC) ARCHITECTURE
We propose an adaptive routing algorithm and the baseline architecture for a exible on-chip interconnec-tion [6]. It adopts a wormhole switching technique and its routing algorithm is livelock-/deadlock- free in a 2-D mesh. Specically, to eliminate the deadlock situation and simplify the routing algorithm, two disjoint vertical channels are provided instead of using virtual channels. The use of a vertical channel is limited by the direction of delivered data. That is, each vertical channel is de-noted by N1/S1 for east-bounded and N2/S2 for west-bounded packets, respectively. Also, the data from the internal Processing Element (PE) or Execution Unit (EU) connected with the router uses separate injection ports, IntL-in and IntR-in, depending on its direction of target node. As a result, available routing ports are grouped as fW-in, N1, E-out, S1, IntR-ing and
fE-in, N2, W-out, S2, IntL-ing where N1/N2 or N2/S2 represents incoming/outgoing ports simultaneously (-in an (-incom(-ing port, and -out an outgo(-ing port for the given channel, respectively).
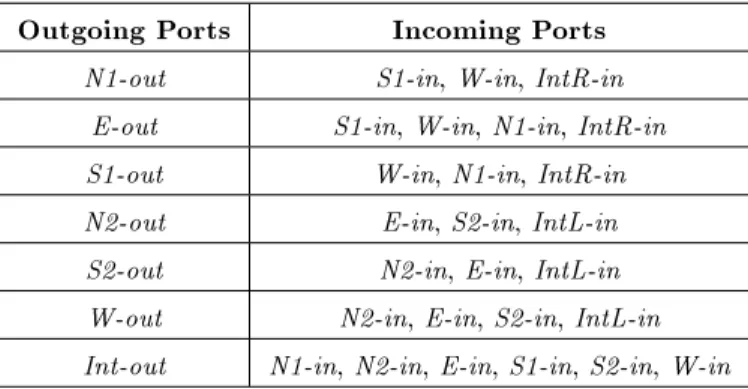
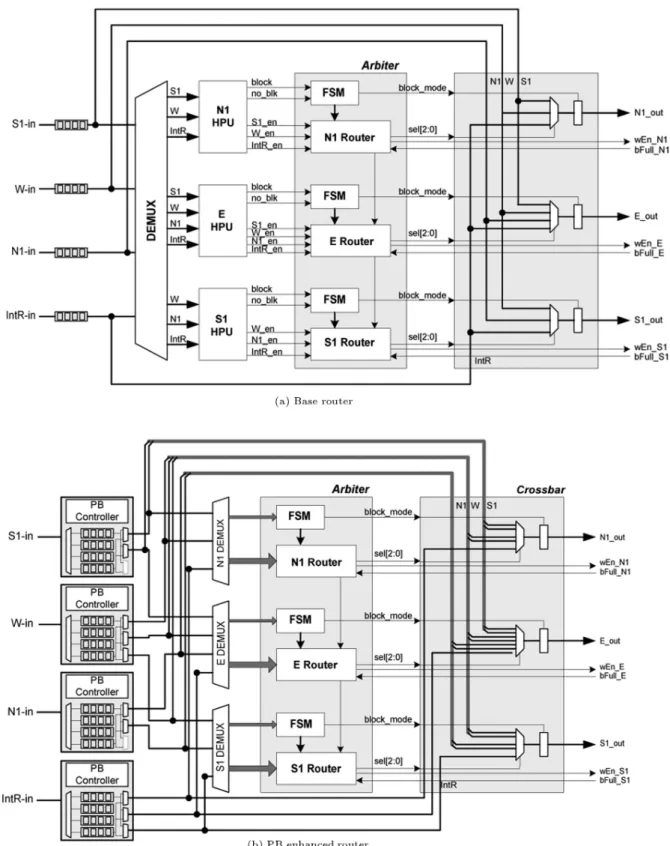
For each set of ports, the routing decision is independently performed. For instance, in the set of east-bounded ports, i.e. fW-in, N1, E-out, S1, IntR-ing, incoming ports are routed to each output port depending on port priority as shown in Table 1. There are two dierent levels of priority on incoming ports and outgoing ports, respectively. The priority on outgoing ports is given in the order of N1-out, E-out, S1-E-out, and Int-out. Thus, it is organized by starting from the north in a clockwise direction to the port connected to EU, Int-out, having the lowest priority. The other priority on incoming ports is dierently assigned, depending on the given outgoing port. For the given outgoing port, the priority on incoming ports is given in the order of a clockwise direction, starting from the incoming port next to the given outgoing port, if the incoming port has a deliverable it to the given outgoing port. If any incoming port is routed to an outgoing port with higher priority, that port is not considered in the routing decision for outgoing ports with lower priority. Algorithm 1 summarizes a detailed procedure of the routing decision. Based on these operations, the micro-architecture of either a Right or Left router is designed as Figure 1a.
ENHANCED NETWORK-ON-CHIP (NOC) ARCHITECTURE WITH PARALLEL BUFFERS
In order to enhance the performance of base NoC architecture, an approach similar to the parallel buer technique of virtual channels is selected as shown in Figure 1b. Instead of using dedicated buers for each port, parallel buers with a small depth queue or FIFO are added in front of each incoming port. The dierence from previous approaches with virtual channels is a routing-independent parallel buer structure and its
Table 1. Priority assignment on incoming/outgoing ports. Outgoing Ports Incoming Ports
N1-out S1-in, W-in, IntR-in E-out S1-in, W-in, N1-in, IntR-in S1-out W-in, N1-in, IntR-in N2-out E-in, S2-in, IntL-in S2-out N2-in, E-in, IntL-in W-out N2-in, E-in, S2-in, IntL-in Int-out N1-in, N2-in, E-in, S1-in, S2-in, W-in
106 J.H. Bahn and N. Bagherzadeh
Algorithm 1. Pseudo routing algorithm for base router. ecient management scheme, which will be described
in detail.
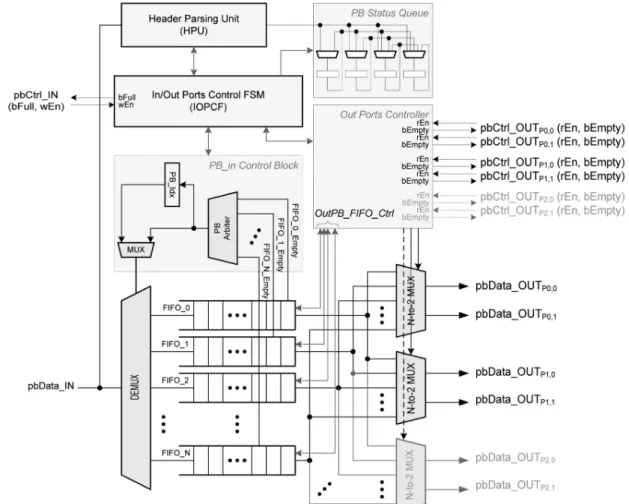
Figure 2 shows a detailed parallel buer struc-ture applied in the enhanced NoC architecstruc-ture. To maximize the utilization of channels, multiple outputs from a parallel buer for each forwarded direction are provided to the routers. By virtue of 2-D mesh topol-ogy, the maximum number of forwarded directions is 3. For each forwarded direction, a maximum of 2 outputs from a parallel buer are provided. The following example explains how to extract the maximum number of outputs from a parallel buer for each output port. Let's assume that a parallel buer with 8 FIFOs at each incoming port is allocated and all FIFOs that are only in the parallel buer at the incoming port W-in contaW-in packets. Also, the packets occupyW-ing FIFOs in the parallel buer at W-in port arrived at dierent times. The destination of each packet occupying each FIFO in the parallel buer is E, NE, N, SE, SE, S, NE, and S in the order of fP B0, P B1, P B2, P B3, P B4,
P B5, P B6, P B7g where P Bi represents the ith FIFO
in the given parallel buer. Let's assume the order of arrival time for each packet is fP B1, P B3, P B0,
P B2, P B4, P B6, P B5, P B7g. If each FIFO in the
parallel buer is grouped in the order of arrival time and its available routing direction, the resultant groups of FIFOs are fP B1, P B2, P B6g for N-out, fP B1,
P B3, P B0, P B4, P B6g for E-out, and fP B3, P B4,
P B5, P B7g for S-out. Because no incoming ports other
than W-in have deliverable data, the routing decision is performed only on port W-in. According to the
described priority in Table 1, the outgoing port N-out is the rst one to be considered. For N-out outgoing port, the packet stored in P B1 will be selected. For
E-out outgoing port, the packet stored in P B3 will
be chosen because P B1 is already occupied by the
outgoing port N-out with a higher priority. Finally, to S-out outgoing port, the packet stored in P B4 will be
forwarded because the earlier packet in P B3is already
reserved for E-out. Therefore, instead of searching all the entries in each group, the rst 2 entries are sucient for checking the available incoming packet for the routing decision. Algorithm 2 summarizes a detail routing procedure for the enhanced PB router.
Diering from the conventional VC approaches, the operation of the proposed parallel buer is no longer dependent on neighboring routers. By au-tonomous management of a parallel buer, depending on outgoing port read requests, the parallel buer can be simply assumed as a single FIFO. That is, from the previous neighboring router, the parallel buer is recognized as a single FIFO with ordinary interfaces such as bFull (buer fullness) or wEn (write enable). Therefore, the only task of this parallel buer is to store the incoming packets and manage their occupancy with respect to their destination and read operations depending on routing decision. In order to manage the empty FIFOs in the given parallel buer, as illustrated in Figure 2, simple logic circuits are added in PB in Control Block. With given empty signals from all input FIFOs, one of the empty FIFO indices is chosen, which controls the path of storing incoming it into
Figure 1. Micro-architecture of base and PB enhanced router.
the corresponding FIFO. Simultaneously, to control the incoming packet in it the Header Parsing Unit (HPU) and the associated control unit (IOPCF) are needed.
In the proposed parallel buer structure, every two outputs among the allocated FIFOs in the parallel buer are chosen and forwarded to the inputs of
routing decision logic for the corresponding outgoing port. The parallel buer controller manages the history of arrival packets and their FIFO locations in the parallel buer, and groups of in-use FIFOs based on its outgoing direction; HPU is utilized for this purpose. By moving the location of HPU, which
108 J.H. Bahn and N. Bagherzadeh
Figure 2. Proposed parallel buer structure.
is originally placed in the router logic as Figure 1a, the critical path for the enhanced router is reduced. Because the performance of FIFOs is much faster than that of the router logic with HPU [6], it results in balancing the workload of each block, with respect to the timing. Therefore, the enhanced NoC architecture obtains a better performance for real implementa-tions.
EVALUATION OF THE PERFORMANCE IN THE ENHANCED NOC ARCHITECTURE Evaluation Environment
In order to evaluate the performance of the base NoC architecture, a time-accurate simulation model was implemented in SystemC. By comparing with dierent routing algorithms, its competitive performance has been evaluated. Parallel buers with an ecient management scheme expect an overall performance increment. The parallel buers with the proposed man-agement scheme were included in this model, replacing the previous FIFO module approach.
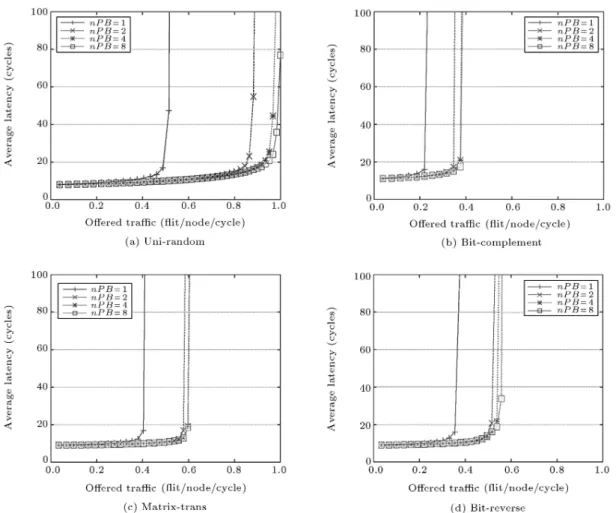
All the network simulations were performed using 100,000 cycles with 4 commonly used trac patterns,
such as uniform random, bit-complement, matrix-transpose trac and bit-reverse trac. Two dierent sizes of 2-D mesh topology based on 44 and 88 were studied, and the number of FIFOs in the parallel buer per incoming port was varied. However, the depth of FIFO in the parallel buer was xed as 4, and 4-it long packets were used. For the measurement of throughput and adjusting incoming trac, the standard inter-connection network measurement technique [1] was adopted.
Simulation Results and Their Analysis
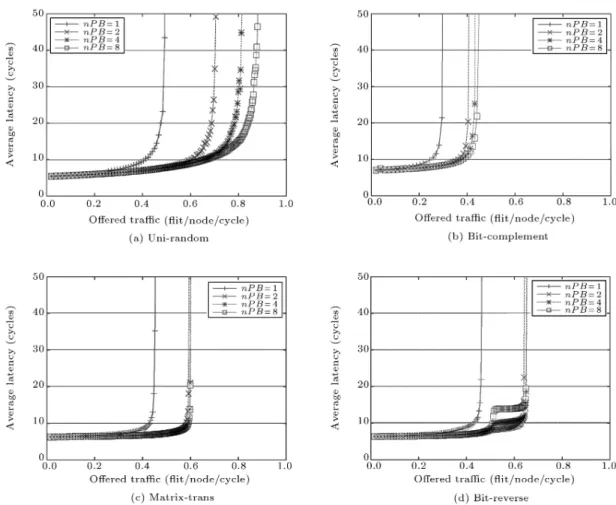
SystemC simulations with various trac patterns and two dierent network topologies resulted in experimen-tal results of PB enhanced NoC architecture. With these collected data, the plots of average latency vs. oered trac are drawn in Figures 3 and 4 for 44 and 88 mesh, respectively. For a 44 mesh network, both uniform random and bit-reverse trac patterns show a notable increase in maximum throughput, approxi-mately 25% and 19%, respectively. In the 8 8 mesh network, uniform random, matrix-transpose and bit-reverse trac patterns show a noticeable improvement of around 28%, 28% and 18%, respectively. However,
110 J.H. Bahn and N. Bagherzadeh
Figure 4. Performance in 8 8 mesh.
for bit-complement trac patterns in 4 4 and 8 8, the improvement of performance seems to be minor. The bit-complement trac pattern anomaly is because it has relatively lower exibility in choosing routing paths from source to destination and most of the trac patterns concentrate on the central region for a given mesh, resulting in severe routing contention and blocking similar to the analysis in [11]. As the size of 2-D mesh topology increases, the eect of a parallel buer in improving performance grows, because the size increase provides a much higher degree of exibility in routing paths.
As shown in [6], the previous base NoC ar-chitecture reaches up to 0.4 oered trac with a uniform random trac pattern for the 8 8 mesh network, even when innite buers are allocated be-tween links. However, in the new parallel buers adopted NoC architecture, the performance already outperforms, even when two-FIFO parallel buer per incoming port are applied, as shown in Figure 4a. Furthermore, by applying a four-FIFO parallel buer per incoming port, the maximum throughput for 8 8 mesh reaches up to 0.45 (about 13% improve-ment). With comparison to the base NoC architec-ture, four-FIFO parallel buers per incoming port
achieve an optimal performance benet. Also, com-pared with the general virtual channel approach [3] where at least 8 virtual channels per physical chan-nel are required to get nominal performance and resolve the deadlock problem, the proposed NoC ar-chitecture with parallel buers has its own bene-t.
OVERVIEW OF THE PROPOSED TRAFFIC MODEL
As part of enhancing NoC modeling and simulation improvements, we propose a generic trac model for NoC based on trac traces obtained from a full system simulation or real system devices. This model combines the spatio-temporal characteristics of trac with three independent components, (Hs, s, (s;d)) where s and
d represent the indices of the source node and the destination node, respectively. With three independent components, the given trac can be analyzed and characterized in a statistical manner. Dierent from the approach used in [15], each statistical component is derived per node. To dene the burstiness of each node, the Hurst exponent, Hs, for source node, s, is
self-similarity, Hs determines the temporal burstiness of
trac at each node, that is, the peak size of injection packets and their injection patterns of arrival time. To dene one of the spatial properties in NoC trac traces, distribution of the average injection rate at every node, denoted by s, is captured. Finally, (s;d),
representing distribution of the trac ratio from s node to d node in the given injection rate, s, is
extracted.
For each component of our (Hs, s, (s;d)) trac
model, we analyze and extract the proposed statistical distribution against 8 trac traces used in [16]. Those are SPLASH-2 [17] traces gathered by running the benchmarks on Bochs [18], a multiprocessor simulator with an embedded Linux 2.4 kernel. Each benchmark was run in Bochs with 49 (= 77) concurrent threads, and the memory trace is captured. This memory trace is then applied to a memory system simulator that models the classic MSI (Modied, Shared, Invalid) directory-based cache coherence protocol, with the home directory nodes statically assigned, based on the least signicant bits of the tag, distributed across all processors in the entire chip.
TRAFFIC MODELING
In this Section, we explain the details of our (Hs,
s, (s;d)) trac model. Based on the extracted
parameters, the procedure for generating a synthetic trac trace will be provided as well. Trac model-ing is an important component of our parallel buer evaluation, since lack of good trac loads could poten-tially skew the outcome of our architectural evaluation for NoC.
Temporal Burstiness: Hs
In classic networks, self-similarity is one of the key features to characterize burstiness, as well as Long-Range Dependence (LRD) of trac, in the temporal sense. To measure such burstiness and LRD, the Hurst parameter, H, is used, where H 2 (1=2; 1) indicates the presence of LRD. As many communication tracs are proven to be statistically self-similar, some researchers already showed that the trac in NoC also has a self-similar characteristic [15,19]. Thus, we parameterize such a degree of burstiness or LRD using H. Fur-thermore, in order to be accurate, this parameter, indicating burstiness is analyzed on every injection node.
Because the denitions of self-similarity are well described in the literature, in this section, a brief description of self-similarity will be introduced. For additional details, refer to [20-23].
Considering a cumulative process Y (t) with sta-tionary increments, let Xt be its corresponding
incre-mental process:
Xt= Y (t) Y (t 1): (1)
Process Xs(m)is dened as an aggregated process of Xt
if: X(m)
s = [Xsm m+1+ Xsm m+2+ ::: + Xsm]=m: (2)
Process Xtis self-similar if Xtis indistinguishable from
Xs(m). Because this is a very restrictive denition,
usually second-order self-similarity is considered for trac analysis, i.e. auto-covariance of the original and aggregated processes should be the same:
(m)(k) = (k); (3)
lim
m!1
(m)(k) = (k); (4)
where (k) = E[(Xt )(Xt+k )] and (m)(k) =
E[(Xs(m) )(Xs+k(m) )]. Process Xtis exactly
second-order similar or asymptotically second-second-order self-similar if Equation 3 or Equation 4 is satised, respec-tively.
In order to measure the degree of self-similarity, the Hurst parameter, H, is used, where a process is self-similar with parameter H(0 < H < 1) if:
Y (t) = kHY (kt); 8k > 0; t 0; (5)
which means that the original and normalized aggre-gated processes should have the same distribution. In other words, the self-similarity can be understood as the ability of an aggregated process to preserve the burstiness of the original process, i.e. the property of slowly decaying variance:
var(X(m)) m2H 2: (6)
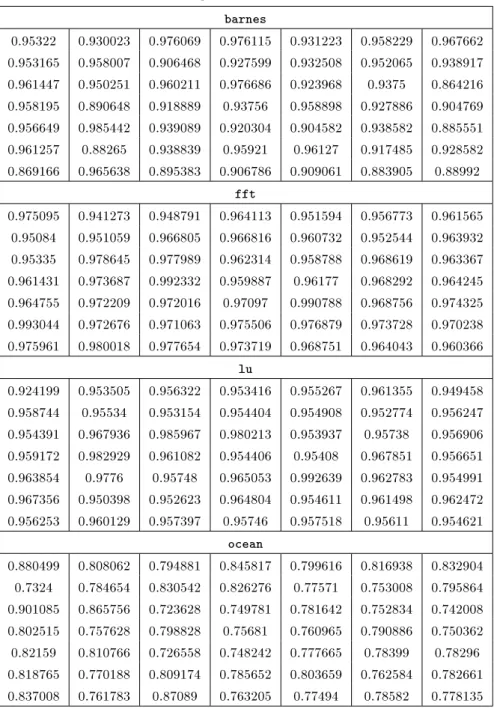
In this paper, Equation 6 is computed to measure the Hurst parameter, H. Table 2 shows the measured H value per node for eight dierent traces.
Injection Rate: s
As one of the spatial parameters in our trac the model, trac injection rate determines the distribution of the injection load per node. In [15], this spatial injection distribution is parameterized by the standard deviation, , of the injection distribution with an actual coordinate assignment. In that approach, it assumes that the actual results possess Gaussian-type distributions. Even though that approach can help the injection distribution be quantied using a single value, the mapping to Gaussian-like distribution is not always accurate in a real NoC trac situation. Also, it requires large amounts of computation to
112 J.H. Bahn and N. Bagherzadeh
Table 2. Measured Hurst parameter for trac traces in 7 7 mesh. barnes
0.95322 0.930023 0.976069 0.976115 0.931223 0.958229 0.967662 0.953165 0.958007 0.906468 0.927599 0.932508 0.952065 0.938917 0.961447 0.950251 0.960211 0.976686 0.923968 0.9375 0.864216 0.958195 0.890648 0.918889 0.93756 0.958898 0.927886 0.904769 0.956649 0.985442 0.939089 0.920304 0.904582 0.938582 0.885551 0.961257 0.88265 0.938839 0.95921 0.96127 0.917485 0.928582 0.869166 0.965638 0.895383 0.906786 0.909061 0.883905 0.88992
fft
0.975095 0.941273 0.948791 0.964113 0.951594 0.956773 0.961565 0.95084 0.951059 0.966805 0.966816 0.960732 0.952544 0.963932 0.95335 0.978645 0.977989 0.962314 0.958788 0.968619 0.963367 0.961431 0.973687 0.992332 0.959887 0.96177 0.968292 0.964245 0.964755 0.972209 0.972016 0.97097 0.990788 0.968756 0.974325 0.993044 0.972676 0.971063 0.975506 0.976879 0.973728 0.970238 0.975961 0.980018 0.977654 0.973719 0.968751 0.964043 0.960366
lu
0.924199 0.953505 0.956322 0.953416 0.955267 0.961355 0.949458 0.958744 0.95534 0.953154 0.954404 0.954908 0.952774 0.956247 0.954391 0.967936 0.985967 0.980213 0.953937 0.95738 0.956906 0.959172 0.982929 0.961082 0.954406 0.95408 0.967851 0.956651 0.963854 0.9776 0.95748 0.965053 0.992639 0.962783 0.954991 0.967356 0.950398 0.952623 0.964804 0.954611 0.961498 0.962472 0.956253 0.960129 0.957397 0.95746 0.957518 0.95611 0.954621
ocean
0.880499 0.808062 0.794881 0.845817 0.799616 0.816938 0.832904 0.7324 0.784654 0.830542 0.826276 0.77571 0.753008 0.795864 0.901085 0.865756 0.723628 0.749781 0.781642 0.752834 0.742008 0.802515 0.757628 0.798828 0.75681 0.760965 0.790886 0.750362 0.82159 0.810766 0.726558 0.748242 0.777665 0.78399 0.78296 0.818765 0.770188 0.809174 0.785652 0.803659 0.762584 0.782661 0.837008 0.761783 0.87089 0.763205 0.77494 0.78582 0.778135
nd out the exact coordinate assignment. Hence, in this paper, the original distribution of injection rate on every node is kept as it is. This enables more accurate synthetic trac generation than -based Gaussian-like distribution. Figure 5 shows injection rate distributions for trac traces in a 7 7 mesh. Spatial Distribution: (s;d)
Another spatial distribution, (s;d), represents the
trac ratio from source node s to destination node d, based on injection rate s. In [15], spatial hop
distribution p is adopted. In order to formulate the hop count distribution model, the mechanism was applied
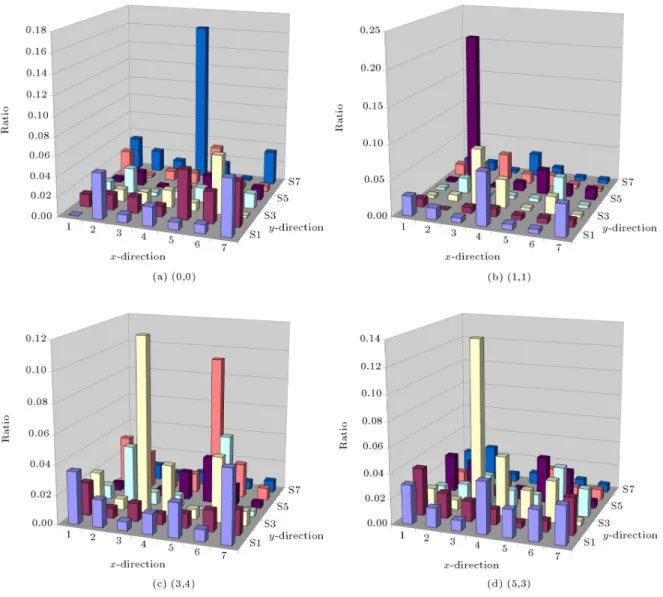
so that the mapping should not choose a receiver whose distance is d hops from the sender unless it cannot nd one. Also, in that model, there is no concern about the geometry of destination nodes. In other words, all nodes with the same d-hop distance from the source node are considered to have the same statistical characteristics. This assumption is somewhat dierent from typical NoC trac, regardless of the optimal communication mapping. However, our model considers the dierence of location of destination nodes within the same distance of hops when the trac ratio between the source and the destination node is analyzed. Moreover, the matrix of trac ratio from each source node is constructed
Figure 5. Injection rate distributions for trac traces in 7 7.
in order to characterize the spatial distribution of source/destination pairs. Figure 6 illustrates the dis-tribution of trac ratio for each node in the barnes application.
Synthetic Trac Generation
To describe how our (Hs, s, (s;d)) model can generate
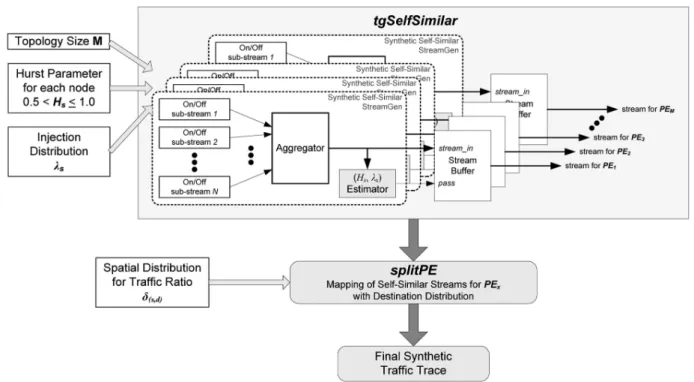
synthetic network trac, we implemented tgNePA, a tool that automatically generates NoC trac of the given network topology from the congured (Hs, s,
(s;d)) trac model. Figure 7 shows the trac
genera-tion ow intgNePA.
tgSelfSimilar: Trac Generation Based on (Hs,
s)
To generate self-similar NoC traces, tgNePA uses the method described in [24]. For this method, the synthetic self-similar trac is obtained by aggregating
multiple sub-streams, each consisting of alternating Pareto-distributed on/o periods. Pareto distribution is dened by a heavy-tailed distribution with the probability-density function f(x) = ab=x+1, x b,
where is a shape parameter and b is a location parameter. Pareto distribution with 1 < < 2 has a nite mean and an innite variance. To generate Pareto-distributed values, the following formula is used: XP areto= b=[U1=] where U is a uniform random
variable (0 U 1). The Hurst parameter, H, of the self-similar trace generated by this method can be derived by H = (3 )=2 [24,25].
Additionally, while generating Pareto-distributed values, the injection rate for each sub-stream is con-trolled. Therefore, by applying s to each
gen-eration of the self-similar stream for corresponding node s, the (Hs, s) congured self-similar trac is
obtained.
Depending on the method of self-similar trac generation, its accuracy may be varied. To minimize
114 J.H. Bahn and N. Bagherzadeh
Figure 6. Distributions of trac ratio on selected nodes for barnes trac trace in 7 7.
error between the expected (Hs, s) and the measured
value from the generated trac, a recursion is applied, as shown in the rst phase of tgSelfSimilar (see Fig-ure 7). Along with generating self-similar trac with the expected (Hs, s) conguration, (Hs0, 0s)-tuple
components of the generated trac are measured. If the error for the expected (Hs, s), as compared to the
measured (H0
s, 0s), is acceptable, then the generated
self-similar trac is delivered to the next step,splitPE. Otherwise, generation of self-similar trac with a similar conguration is repeated.
splitPE: Trac Generation Based on (s;d)
The second phase generates the destination node upon the generated self-similar trac of each node. Because the ratio of trac from each source node, s, to each destination node, d, is already provided by the distribution of (s;d), generation of the destination node
for each instance of trac from corresponding source
node s can be accurately controlled. Dierent from the Trident's approach [15], the ratio of trac for each pair of source and destination is separately assigned. Therefore, the distribution of source/destination pairs can be more accurately emulated.
VALIDATION
Each synthetic trac is generated using analyzed (Hs, s, (s;d)) for each application mentioned in the
previous Section. In order to control the recursion of
tgSelfSimilar, we set the marginal error bound of Hs
and s to 5%. In the recursive generation of
self-similar trac for each node, Hurst parameter Hs can
be easily matched with the given marginal percentage. However, in matching the lower injection rate, s, it
requires excessive computation time. For that reason, to reduce such a large computation time in matching the injection rate, a proportional margin value is applied as an alternative approach. That is, for a
Figure 7. tgNePA trac generation ow diagram.
relatively higher injection rate, a tighter margin value is applied. Reversely, in a relatively lower injection rate, a lower margin value is applied. For instance, by using the logarithmic scale of injection rate, the marginal value can be scaled by multiplying it with j log10(s)jj log10(s)j. Because the higher injection rate
is dominant, the eect of larger error at source nodes with lower injection rates can be minimized. Table 3 shows the measured Hurst parameter of synthetic trac according to the analyzed trac model of each application. The Hs parameter for synthetic trac
has accuracy in the range of a 2.7% to 4.3% average error bound. However, the accuracy of s is varied
depending on the level of injection rates of applications, because the proportional margin value to the level of injection rates is applied in matching the injection rate during the rst phase of trac generation. For instance, inbarnesapplication, the average of injection rates of original trac is 0.065 and the ratio of average error in injection rates is 6.8%. On the other hand, for
fftapplication, the average of injection rates of original trac is 0.0089 and the ratio of average error is 26%. In this case, the level of injection rates is relatively low, i.e. the scale factor to apply a proportional margin is 27 (=33) during the recursion. Therefore, the resultant
synthetic trac has relatively large error compared to the original injection rates.
For source/destination distribution (s;d) of
syn-thetic trac, its accuracy is almost 100%, as shown in Figure 8.
Finally, throughout the cycle of NoC simulation, using original trac traces as well as synthetic trac
traces, the accuracy of the overall network performance is observed (see Table 4).
CONCLUSION
We proposed a new parallel buer structure and management scheme, as well as its optimal micro-architecture. By applying this proposed parallel buer to the previously based NoC architecture, remarkable performance improvement was observed using simula-tions of various trac patterns. Even though deadlock-freedom is realized by providing disjoint vertical chan-nels instead of virtual chanchan-nels, which is a general approach for this purpose, considerable performance benet can be obtained by adding parallel buers with a smaller number of FIFOs. Also by moving the header parseing unit into the parallel buer controller, the timing balance between the parallel buer and router logic can be obtained at the micro-architecture level. In order to enhance our simulation-based architectural validation approach, a generic trac model for on-chip interconnection networks was described. To keep the temporal and spatial distribution of trac traces, all statistical information is measured per node. In order to characterize the burstiness of injection nodes, Hurst parameter Hs is chosen. For specifying
temporal statistics, the distribution of injection rates s and the ratio of source/destination pairs (s;d) on
the given source node are used. With the proposed trac model, we also introduced a recursive trac generation method to minimize the error of statistical components, and allow synthetic trac traces with
116 J.H. Bahn and N. Bagherzadeh
Table 3. Measured Hurst parameter for synthetic trac traces in 77 mesh. barnes
0.922604 0.900864 0.929619 0.932654 0.887087 0.924292 0.924685 0.910217 0.92359 0.894023 0.892669 0.900064 0.922199 0.916118 0.913906 0.924976 0.918239 0.93298 0.878349 0.890662 0.87693 0.933494 0.873282 0.90397 0.912061 0.924956 0.891938 0.887996 0.926644 0.949166 0.894207 0.888905 0.879505 0.917606 0.898869 0.940055 0.898484 0.894776 0.911445 0.925797 0.888928 0.922339 0.831892 0.917855 0.917632 0.892862 0.879119 0.886606 0.862894 Average error ratio = 0.032 fft
0.930469 0.901261 0.904385 0.919863 0.905215 0.920039 0.927163 0.918589 0.930192 0.932514 0.93347 0.921322 0.913654 0.953305 0.907441 0.929731 0.931737 0.91638 0.911257 0.935479 0.91756 0.927311 0.927169 0.950335 0.933219 0.934989 0.923255 0.925058 0.930802 0.92372 0.95463 0.924153 0.942931 0.920807 0.942047 0.950361 0.932204 0.937753 0.935888 0.929717 0.925567 0.928409 0.944464 0.931497 0.933646 0.927396 0.928349 0.932712 0.920281 Average error ratio = 0.041 lu
0.920638 0.913734 0.926406 0.914993 0.912014 0.929957 0.930625 0.915871 0.913395 0.923574 0.93993 0.914495 0.925637 0.910338 0.919504 0.95263 0.937157 0.935734 0.908091 0.915819 0.916393 0.917747 0.936518 0.91593 0.915539 0.912704 0.94054 0.92322 0.919705 0.933109 0.91106 0.918234 0.944434 0.923524 0.913384 0.926757 0.904367 0.90686 0.927362 0.912072 0.916251 0.91677 0.917779 0.929412 0.920856 0.918243 0.920673 0.918731 0.924098
Average error ratio = 0.039 ocean
0.8483 0.783373 0.770411 0.875487 0.766814 0.828058 0.824162 0.739303 0.77524 0.798285 0.8164 0.80788 0.719764 0.780451 0.895681 0.849855 0.709589 0.728271 0.758329 0.756766 0.705397 0.841761 0.745178 0.807255 0.721676 0.736948 0.787291 0.71473 0.837015 0.799498 0.699795 0.717817 0.815538 0.754053 0.804242 0.805689 0.780835 0.790708 0.818814 0.764959 0.742495 0.753796 0.799607 0.76778 0.853409 0.795997 0.752484 0.785473 0.752427 Average error ratio = 0.027
Table 4. Comparison of cycle accurate NoC simulation between original and synthetic trac traces in 7 7 mesh. Original Trac Synthetic Trac Error Ratio (%)
Application Oered load
Avg. Latency
Oered Load
Avg. Latency
Oered Load
Avg. Latency barnes 0.06522 7.26 0.06951 7.32 6.58 0.86
fft 0.00889 8.20 0.01125 7.95 26.63 2.94 lu 0.03560 7.67 0.03240 7.52 8.99 2.17 ocean 0.06881 7.65 0.07345 7.78 6.75 1.70 radix 0.03690 7.96 0.04177 8.00 13.18 0.42 raytrace 0.00636 7.99 0.00987 7.95 55.21 0.53 water-nsquared 0.01649 7.93 0.01939 7.77 17.60 2.22 water-spatial 0.02221 7.99 0.02529 7.76 13.83 2.89
Figure 8. Distributions of trac ratio on selected nodes for synthetic trac trace of barnes application in 7 7.
similar temporal and spatial statistics to be generated. Throughout detailed comparison of each component and performance simulation, our proposed trac model can reconstruct trac patterns with a similar tendency of real NoC trac and provide insights into NoC trac. REFERENCES
1. Dally, W.J. and Towles, B. \Principles and practices of interconnection networks", Morgan Kaufmann, San Francisco (2004).
2. Sullivan, H. et al. \A large scale, homogeneous, fully distributed parallel machine", in ISCA'77, pp. 105-117, ACM Press, New York (1977).
3. Seo, D. et al. \Near-optimal worst-case through-put routing for two-dimensional mesh networks", in ISCA'05, pp. 432-443, ACM Press, New York (2005). 4. Dally, W.J. and Seitz, C.L. \Deadlock-free message
routing in multiprocessor interconnection networks",
IEEE Trans. Computer, C-36(5), pp. 547-553, IEEE Computer Society, Washington (1987).
5. Glass, C.J. and Ni, L.M. \The turn model for adaptive routing", J. ACM, 31(5), pp. 874-902, ACM Press, New York (1994).
6. Bahn, J.H. et al. \On design and analysis of a feasible network-on-chip (NoC) architecture", in ITNG'07, pp. 1033-1038, IEEE Computer Society, Washington (2007).
7. Dally, W.J. \Virtual-channel ow control", IEEE Trans. Parallel and Distributed Systems, 3(2), pp. 194-205, IEEE Press, Piscataway (1992).
8. Boppana, R.V. and Chalasani, S. \Fault-tolerant wormhole routing algorithms for mesh networks", IEEE Trans. Computers, 44(7), pp. 846-864, IEEE Computer Society, Washington (1995).
9. Zhou, J. and Lau, F.C.M. \Adaptive fault-tolerant wormhole routing with two virtual channels in 2D meshes", in ISPAN'04, pp. 142-148, IEEE Computer Society, Los Alamitos (2004).
118 J.H. Bahn and N. Bagherzadeh
10. Vaidya, A.S. et al. \Impact of virtual channels and adaptive routing on application performance", IEEE Trans. Parallel Distributed Systems, 12(2), pp. 223-237, IEEE Press, Piscataway (2001).
11. Rezazad, M. and Sarbazi-azad, H. \The eect of virtual channel organization on the performance of interconnection networks", in IPDPS'05, pp. 264.1, IEEE Computer Society, Washington (2005).
12. Lahiri, K. et al. \Evaluation of the trac-performance characteristics of system-on-chip communication archi-tectures", in VLSID'01, pp. 29-35, IEEE Computer Society, Washington (2001).
13. Hu, J. and Marculescu, R. \DyAD - smart routing for network-on-chip", in DAC'04, pp. 260-263, ACM Press (2004).
14. Palesi, M. et al. \A methodology for design of applica-tion specic deadlock-free routing algorithms for NoC systems", in CODES+ISSS'06, pp. 142-147, ACM, Seoul (2006).
15. Soteriou, V. et al. \A statistical trac model for on-chip interconnection networks", in MASCOTS'06, pp. 104-116, IEEE Computer Society, Washington (2006). 16. Kumar, A. et al. \Express virtual channels: Towards the ideal interconnection fabric", in ISCA'07, pp. 150-161, ACM, San Diego (2007).
17. SPLASH-2, http:
//www-ash.stanford.edu/apps/SPLASH
18. Lawton, K.P. \Bochs: A portable PC emulator for unix/X", Linux Journal, 1996(29es), Specialized Sys-tems Consultants, Inc., Seattle (1996).
19. Varatkar, G.V. and Marculescu, R. \On-chip trac modeling and synthesis for MPEG-2 video applica-tions", IEEE Trans. Very Large Scale Integration (VLSI) Systems, 12(1), pp. 108-119, IEEE Educa-tional Activities Department, Piscataway (2004). 20. Doukhan, P. et al., Theory and Applications of
Long-Range Dependence, in Birkhauser Boston (2002). 21. Park, K. and Willinger, W., Self-Similar Network
Trac and Performance Evaluation, in John Wiley & Sons, Inc., New York (2000).
22. Leland, W.E. et al. \On the self-similar nature of Ethernet trac (extended version)", in IEEE/ACM Trans. Network, 2(1), pp. 1-15, IEEE Press, Piscat-away (1994).
23. Tsybakov, B. and Georganas, N.D. \Self-similar pro-cesses in communications networks", in IEEE Trans. Information Theory, 44(5), pp. 1713-1725, IEEE Press, Piscataway (1998).
24. Taqqu, M.S. et al. \Proof of a fundamental result in self-similar trac modeling", SIGCOMM Computer Communication Review, 27(2), pp. 5-23, ACM, New York (1997).
25. Willinger, W. et al. \Self-similar through high-variability: Statistical analysis of Ethernet LAN trac at the source level", in SIGCOMM Computer Commu-nication Review, 25(4), pp. 100-113, ACM, New York (1995).