AN ANALYSIS OF CAUSAL RELATION BETWEEN STOCK RETURN AND TRADING VOLUME IN NIGERIAN CAPITAL MARKET
MutalibAnifowose Department of Accounting Ahmadu Bello University, Zaria E-mail:[email protected]
+234-803-7327-140
&
Salami Suleiman Graduate student Department of Accounting Ahmadu Bello University, Zaria E-mail:[email protected]
+234-805-3329-132
Abstract
Return-volume relationships are of common interest as they may unearth dependencies that can form the basis of profitable trading strategies, and this has implications for market efficiency. This study examines relationship between trading volume and returns volatility in Nigerian capital marketusing daily stock data of 40 equities listed on the floor Nigerian Stock Exchange NSE for the period January 2009 to June 2012.Engle-Granger bivariate causality test was adopted to analyze the secondary data that were extracted from daily official price list of NSE. The study finds evidence of causality run from stock return to trading volume. It is therefore, recommended among others that the financial analysts and advisers should come up with their buy and sell recommendations to their client by studying the past securities prices so as to formulate efficient and effective portfolio for them.
Key words: Stock Return, Volume, Granger Causality, Nigerian Stock Market
INTRODUCTION
The Nigerian capital market provides the necessary lubricant that keeps turning the wheel of the economy like any other market globally. It does not only provide the funds required for investment but also efficiently allocates these funds to projects of best returns to fund owners. This allocative function is critical in determining the overall growth of the economy. The functioning of the capital market affects liquidity, acquisition of information about firms, risk diversification, savings mobilization and corporate control (Okereke- Onyiuke, 2000). Okereke- Onyiuke (2000) posited that the cheap source of funds from the capital market remains a critical element in the sustainable development of the economy. She enumerated the advantages of capital market financing to include no short repayment period as funds are held for medium and long term period or in perpetuity, funds to state and local government without pressures and ample time to repay loans.
The trading activity in the Nigeria capital market generate indices which serve as mirror through which market efficiency can be measured on one hand and as a barometer of nation’s economy on the other. Therefore, the value of capital market indices depends largely on prices and volume of the securities listed on the floor of exchange. In addition, stock prices variability (return) and trading volume changes can be said to be the two prime indicators of trading activity in a stock market. Return-volume relationships are of common interest as they may expose dependencies that can form the basis of profitable trading strategies, and this has implications for market efficiency (Chen, Firth & Yu, 2004).
events as the power of these tests can be increased by incorporating price-volume relationship, if the changes in price and volume are jointly determined. Thirdly, this relationship is critical to the debate over the empirical distribution of speculative prices; the price - volume tests generally support the mixture of distribution hypothesis–one of the two competing theories that explain the kurtotic distribution of stock returns.
However, numerous pricing anomalies reported in the finance literature suggest that the price discovery process is not immediate. Moreover, trading volume might serve as useful indicators regarding the extent to which pricing information is impounded in security prices and, thus, they may have some predictive power regarding the future behavior of stock prices.
In the last three decades, Nigeria government has been initiating reform process to open up her economies. Subsequently, the economy has received huge inflows of capital in the recent past and became viable alternative for investors seeking international diversification. As a result, demand for investment funds grew significantly and Nigeria capital market played an increasingly important role in the process which later translated to effectiveness in the market.
However, of recent, Nigeria capital market has suffered liquidity problem by recent market crashed that led to loss of confident from both domestic and foreign investors in the market. This has been of great concern to both regulatory authorities and dealing members in the market as investors’ confident need to be restored back if the market is expected to perform its statutory roles. At this crucial stage, it is necessary to assess the level of efficiency of the Nigeria stock market in order to establish its longer term role in nation’s economy. The analysis of stock market is an important segment through which countries exposure to the outer world could be readily felt. Examining the causality between stock returns and trading volume provides us further understanding of how new information is impounded in stock prices. In this context, deeper understanding of the role of trading volume in the dynamics of stock prices may help investors to identify future patterns of the stock market which can be exploited in their investment decisions.
However, available researches in Nigeria focused mainly on the impact of macroeconomic variables on the market volatility (such as, Olowe, 2009, Aliyu, 2010, and Nwachukwu and Okpara, 2010).Olowe (2009) examined the impact of global financial crises on return volatility whereas Aliyu (2010) and Nwachukwuand Okpara (2010) examined the impact of inflation rate and financial Deeping respectively on the return volatility in Nigerian stock market. This study adds to the growing literature on the stock market by a further examination of the return-volume relationship as no previous in Nigeria has explored this relationship to the best of our knowledge.
Besides, the objective of this study is to find out the causality between trading volume and stock return in Nigeria capital market which was hypothesised in null form as there is no significant causal relation between stock returns and trading volume in Nigerian capital market. The scope of the study comprises all 207 listed equity securities on the floor of Nigerian Stock Exchange (NSE) as at January, 2009. Equity was selected because of the dominant role it plays in the market as it constitutes the largest portion of market activities. The period covered by the study is January, 2009 to June, 2012. A three and half year period was considered in order to avoid deficiencies of long term data which can encapsulate archaic data that relate to long forgotten good or poor performance can distort the overall results giving a misleading picture interpretation of recent trends.The study will contribute to the existing literature by investigating the relationship between trading volume and stock return volatility in Nigerian Stock Exchange (NSE) by utilizing a relatively more recent database and extensive dataset including individual stocks instead of a general index which has been primarily used in previous studies.
The remaining parts of this study were organised as follows: section two covered the review of relevant literature on the subject matter while section three, four and five housed methodology adopted, data analysis and presentation of results and conclusion and recommendations respectively.
LITERATURE REVIEW
Moosa and Al-Loughani (1995) examined the price-volume relation for four Asian stock markets. Using monthly aggregate price and volume data, they find that, there is strong evidence for causality running from volume to absolute price changes and from price changes to volume in the case of Malaysia, Singapore, and Thailand. However, they report no causality for the Philippines. Brooks (1998) using both linear and non linear Granger causality tests, provides extensive evidence of bidirectional feedback between volume and volatility. He used the square of the daily return as a measure of the Dow Jones stock returns volatility. Silvapulle and Choi (1999) used linear and nonlinear Granger causality tests to examine the dynamic relationship between daily Korean stock returns and trading volume. They find a bidirectional linear and nonlinear causality between stock returns and volume changes. Lee and Rui (2002) demonstrated that stock returns Granger cause volume in the U.S.A and Japanese markets but not in England. Meanwhile, they show that trading volume does not Granger cause stock market returns on the stock exchanges of the U.S.A, Japan, and England Market. Rashid (2007) found unidirectional linear Granger causality from stock returns to trading volume and, unidirectional nonlinear Granger causality from volume changes to stock returns in the Karachi Stock Exchange.
In addition, there have been number of empirical studies in developed markets which provide evidence on the contemporaneous relationship between trading volume and stock returns. Using monthly stock data, Rogalski (1978) found a positive contemporaneous correlation between returns and trading volume. In an emerging market context, Saatcioglu and Starks (1998) examined the relationship between price changes and volume for six Latin American markets (Argentina, Brazil, Chile, Colombia, Mexico, and Venezuela) and found a positive contemporaneous relationship between returns and volume.
For the Australian stock market, Brailsford (1996) found a positive contemporaneous relationship between absolute returns and volatility. Ratner and Leal (2001) examined the Latin American and Asian financial markets and found a positive contemporaneous relation between return and volume in these countries except India. At the same time they observed that there exists a bi-directional causal relation between return and volume. In Australia, Mestel, Gurgul&Majdosz(2003) found a weak support for a contemporaneous and dynamic relationship between stock returns and trading volume, implying that forecasts of one of these variables cannot be improved by knowledge of the other. Besides, they find evidence of a strong contemporaneous relationship between return volatility and trading volume and that return volatility contains information about upcoming trading volume. Deo, Srinivasan and Devanadhen (2008) demonstrate a significant contemporaneous relationship between trading volume and absolute value of price changes. They have stressed with strong evidence that in the selected Asia-Pacific Stock market, return caused volume rather than volume causing returns.
Going by the above, there is no conclusion as to the direction of dynamic (causal) relation between market returns and trading volume across the global stock markets. This might have resulted from the data utilized, the time period studied and the underlying markets characteristics.
RESEARCH METHODOLOGY
The basic research methods adopted by this research are descriptive and historical. Descriptive method is where data are collected for the purpose of describing and interpreting existing conditions, purposely to make discovery and explanation of past events. The historical method involves using data from past records and it is essential for the purpose of giving a better and clearer understanding of the present.While historical research method is adopted because it provides room for studying situation based on past trend and current position and also advances comprehension of the future, descriptive method is utilized because it enables exploring relationship between two or more variables. The population of study comprises all listed 207 first-tier equity securities on the floor of NSE as at January 2009. Based on the nature and objectives of this study, we employed a filter to eliminate some of the firms that are considered unsuitable for the study. The filter is to eliminate non active securities, which are securities not frequently traded, as they cannot provide adequate data for the achievement of the study objectives. Subsequent to the adoption of this filter, the population is reduced from 207 to 125.The sample size of the study is 40 listed equity securities on floor of Nigerian stock exchange and it is arrived at by using Watson (2001) sample size formula, which is represented thus:
=
Where: n = sample size required; N = number of securities in the population; P = estimated variance in population, as a decimal: (0.5);A = Precision desired, expressed as a decimal (5%); Z = based on confidence level: 1.96; R = Estimated Response rate, as a decimal
Simple random sampling is a basic sampling design adopted in selecting the sample because it allows equal representation. The selection of the subject is done in such a way to include all securities after the adoption of the filter. This is done in anticipation that such a sampling of the subjects will provide the necessary variety of information required of the study.
The study utilizes data mainly from secondary sources because the core of the data needed for analysis is extracted from the daily market report and other relevant publications issued by the NSE/SEC for the daily period of January 2009 to June 2012. The trading volume is measured as number of shares traded on the floor daily. Both earlier (Gallant and Tauchen (1992)) and more recent studies (including, for example, Lee and Rui (2002)) report non-linear trends in the trading volume series. Since the study wishes to work with stationary data, the study followed Lee and Rui (2002) by replacing the raw trading volume by a de-trended oneṼ which is obtained as the estimated residual from the regression
= + + + Ṽ ………(i)
Where; t is time period from 1,2,3...n; t2is square of t;β toβ are coefficient;Ṽis residual of the equation
In addition, Returns are proxied by the log difference change in the price of sampled securities. The stock return is calculated as the continuously-compounded return using the closing price:
= ln ………..(ii)
Where: =stock price returns; =stock price for the period t; =price for the period t-1;ln = the natural logarithm operator
The use of logarithmic price changes prevents non-stationarity of the level of stock prices from affecting stock returns volatility (Rashid and Ahmad 2008). Besides, the study checked whether the time series data for stock returns and trading volume of the hypothesis were stationary by using the Augmented Dickey Fuller (ADF) test.
The study proceeded to test for Granger causality relations between volume and returns. Granger causality testing investigates whether the past of one time series improves the predictability of the present and future of another time series. A pairwise granger causality model was adopted using stock returns and trading volume as both exogenous and endogenous variables respectively. The model was expressed as:
= + + Ṽ + … … … ( )
Ṽ = + Ṽ + + … … … ( )
where,
Ṽis the de-trended trading volume at time t and is the return at time t. The coefficients and represent the effect of lagged returns and lagged volume on the present returns. The significance of the parameters indicates that the causality runs from volume to return.
Similarly, and represent the effect of lagged volume and lagged return on the present volume and the significance of the parameters indicates that the causality runs from returns to volume. If both parameters and is significant then there exists a bi-directional causal relation between returns and trading volume. Different test statistics have been proposed to test for linear Granger causality restrictions. This study relied on the conventional F-test for joint exclusion restrictions and this was used to test the hypothesis of the study.
DATA ANALYSIS AND PRESENTATION OF RESULTS DESCRIPTIVE STATISTICS OF THE STUDY
Securiti es
Returns Trading Volume
Mean Std Skwn e
Kurt JB Prob. Mean Std Skwne Kurt JB Prob.
Ftn 0.139 4.372 -2.129 15.29 6
1636.9 4
0.000 46.070 4468 5
10.247 132.74 166765 0.000
Presco 1.011 28.94 22.22 7
530.7 71399 0.000 -0.003 6882 5
7.6288 79.071 153249 0.000
Nahco -0.058 8.32 -0.319 41.03 5
36840 0.000 550.21 1075 2
4.1837 30.125 20513 0.000
Rtbrisc oe
-0.297 14.96 0.675 169.8 3
705196 0.000 3135.2 4124 4
10.404 127.96 406568 0.000
Diamon d
-0.044 8.93 -0.193 163.7 5
657832 0.000 3774.7 1352 3
3.443 20.940 9401.02 0.000
Firstba nk
-0.081 31.83 -0.005 77.63 6
141829 0.000 4736.2 2505 3
9.654 135.95 459536 0.000
NB 0.013 3
8.357 0.180 89.25 3
189403 0.000 -1342 2519 9
4.2899 28.529 18466.9 0.000
CAP -0.043 8.939 -0.999 181.0 3
804409 0.000 32.677 1660 0
8.8856 94.909 222367 0.000
Redstar e
-0.046 21.75 -0.183 85.53 4
173138 0.000 -0.010 6822 8
2.950 15.564 4897.08 0.000
Omatek -0.250 20.7 0.179 102.7 4
202707 0.000 -711.4 2187 7
5.680 43.190 35539 0.000
PZ 0.018 5
25.29 -0.011 247.9 9
152555 0.000 1326.2 1931 6
8.7470 105.67 275702 0.000
Jberger 2.650 0.106 -0.745 47.97 3
51209. 7
0.000 40.244 2038 9
13.426 204.58 104596 0.000
Charm -0.197 3.198 0.256 2.151 9.490 0.000 -3876 4317 7
3.339 21.108 3600.96 0.000
Nestle 0.013 16.88 -0.083 131.0 5
41611 0.000 -0.006 3696 5.8246 47.708 54164 0.000
ETI -0.017 27.01 0.116 129.3 7
40394 0.000 3902 6532 4
5.8571 55.989 74485 0.000
Fidson -0.044 10.25 -0.158 67.20 0
104075 0.000 -4459 4412 8
9.460 107.30 283727 0.000
Guinne ss
0.115 50.68 0.002 58.04 9
29294 0.000 -0.011 4139 3
3.340 15.857 2029.39 0.000
Vitafoa m
0.020 9.877 -0.181 58.01 5
77058 0.000 0.0080 5765 4
7.0929 92.493 209019 0.000
Starco m
-0.141 20.73 0.132 7
232.1 5
133692 0.000 -1603 7648 4
5.412 43.584 44915.6 0.000
Custod yin
2.370 0
6.568 0.154 88.33 3
185381 0.000 238.03 7452 1
7.0778 72.078 126584 0.000
CILeasi n
-0.002 0.032 -0.574 66.59 6
102998 0.000 -45.85 4555 3
17.301 357.67 323285 0.000
Japaulo il
-0.007 0.027 -0.522 39.02 5
33068 0.000 -2125 6552 9
5.6719 48.393 55734 0.000
Daarco m -0.001 0.112 4 -0.021 60.51 7 84221. 6
0.000 -119.2 5600 0
15.197 273.50 188635 0.000
UNHo me
-0.001 0.123 8.190 123.7 4
371136 0.000 908.47 3377 8
6.1639 61.559 91170.3 0.000
FCMB 0.102 28.75 -0.063 16.39 3
1734.1 0
0.000 -6040 9825 4
2.415 9.798 672.29 0.000
Ashaka 0.192 3.679 -0.976 6.289 137.78 9
0.000 4080.7 1641 2
Crusad er
-0.001 0.068 -0.343 42.09 5
38924. 8
0.000 -17057 1749 4
16.677 335.00 283443 0.000
Bagco -0.001 0.053 0.174 8
115.1 5
319684 0.000 145.07 4978 8
8.8479 120.36 358054 0.000
AP/FO -0.531 14.07 -0.147 38.81 8
26140 0.000 894.08 8644 2
9.4620 123.81 304667 0.000
Total 7.340 0.127 0.008 3
202.7 0
100525 0.000 420.20 3759 2
22.40 531.51 709203 0.000
UPL -3.920 0.155 0.111 100.1 1
238503 0.000 66.584 6522 4
5.830 42.939 43782.8 0.000
Glaxos mit
0.020 9
2.231 0.072 5.026 49.543 0.000 -77.878 6729 1 10.834 149.52 8 263280 0.000 Chevro n
-9.790 9.684 -0.013 139.5 3
223689 0.000 0.0066 3981 0
5.005 39.324 17035.4 1
0.000
Ikejaho t
-0.069 4.350 -2.252 21.68 0
4453.0 5
0.000 0.0098 1430 11
2.262 10.042 840.755 0.000
Cutix -0.050 21.94 3.321 146.7 4
248495 0.000 -1.060 1340 0
3.7857 21.727 4896.47 0.000
Dunlop 0.000 28.37 0.000 114.5 0
118624 0.000 20856 7905 8
11.9965 165.36 257020 0.000
Aiico 0.061 8.049 -1.143 32.42 0
7800.2 9
0.000 19407 1884 2
7.6347 62.831 34157 0.000
UACro p
-.0001 0.037 -0.065 193.9 5
922191 0.000 1092.2 1002 4
6.246 52.057 64814 0.000
ABCTr an -0.001 0.119 0 .0024 2 120.3 0
350314 0.000 -2.193 5292 5
24.316 597.73 906513 0.000
Guaran ty
-0.018 7.368 0.389 87.27 2
68656 0.000 -12606 1184 3
1.9894 9.237 529.12 0.000
Source: Data Analysis output by author using e-view (2012). Details of outputs are available on request.
An investigation into relationship between return, return volatility and volume provides significant information regarding the price discovery efficiency of the securities. Significant JarqueBera statistics clearly rejects the hypothesis, which implies that pattern of all variables does not conform to normal distribution, which is the precondition for any market to be efficient in the weak form.
Further, for the returns, it can be deduced from table 1 that average value of most of the sampled securities under the consideration was negative. Take for instance, presco, rtbriscoe, diamond firstbank, starcom just to mention few have a mean returns over the period of -0.058, -0.297, -0.044, -0.081,-0.141 respectively. The standard deviation of the return showed a wide dispersion from normality as it evident the unequal nature of mean, mode and median of the series employed in the study. The skewness of the returns were also negative evident the series were skewed to the left and displayed non normality of the data. The excess kurtosis of the return enshrines the evidence of the nature of departure from normality. The Jarque-Bera figures for returns of sampled securities also evidenced returns to be asymmetric and non-normal and it can also be verified from p value of Jarque-Bera test. The trading volume of the study on the other hand exhibited similar outcome as that of returns especially with the kurtosis and jargue-Bera. The positive skewness is observed for volume showed that the series were skewed to the right and it indicated non normality of the series. The excess figures of standard deviation of trading volume showed dispersion and this means that the mean, mode and median of the trading volume series employed in the study are not equal which means that the series were not normally distributed .
Summarily, the absent of normality has been observed for the returns and trading volume series employed in this study. This implied that the series data cannot be analyzed by Ordinary Least Square (OLS) because the series exhibited the present of heterogeneity of data as against the homogeneity assumption which make the OLS to the Best Linear Unbiased Estimator. The study therefore adopted ARCH and GARCH model family that can incorporate the heterogeneity nature of the data.
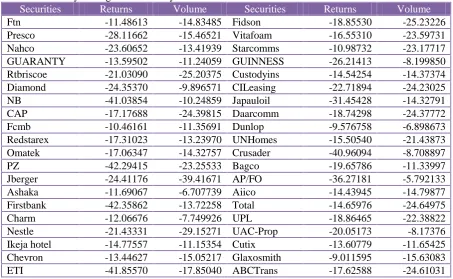
STATIONERITY TEST
Table 2 displays the result of unit root conducted using ADF tests for each security’s time series of stock returns and trading volume. The main aim of the test is to determine whether the time series data adopted for the study were invariant with the time.
Table 2: Summary of Augmented Dickey-Fuller Unit Root Test
Securities Returns Volume Securities Returns Volume
Ftn -11.48613 -14.83485 Fidson -18.85530 -25.23226
Presco -28.11662 -15.46521 Vitafoam -16.55310 -23.59731 Nahco -23.60652 -13.41939 Starcomms -10.98732 -23.17717 GUARANTY -13.59502 -11.24059 GUINNESS -26.21413 -8.199850 Rtbriscoe -21.03090 -25.20375 Custodyins -14.54254 -14.37374 Diamond -24.35370 -9.896571 CILeasing -22.71894 -24.23025 NB -41.03854 -10.24859 Japauloil -31.45428 -14.32791 CAP -17.17688 -24.39815 Daarcomm -18.74298 -24.37772 Fcmb -10.46161 -11.35691 Dunlop -9.576758 -6.898673 Redstarex -17.31023 -13.23970 UNHomes -15.50540 -21.43873 Omatek -17.06347 -14.32757 Crusader -40.96094 -8.708897
PZ -42.29415 -23.25533 Bagco -19.65786 -11.33997
Jberger -24.41176 -39.41671 AP/FO -36.27181 -5.792133 Ashaka -11.69067 -6.707739 Aiico -14.43945 -14.79877 Firstbank -42.35862 -13.72258 Total -14.65976 -24.64975
Charm -12.06676 -7.749926 UPL -18.86465 -22.38822
Nestle -21.43331 -29.15271 UAC-Prop -20.05173 -8.17376 Ikeja hotel -14.77557 -11.15354 Cutix -13.60779 -11.65425 Chevron -13.44627 -15.05217 Glaxosmith -9.011595 -15.63083 ETI -41.85570 -17.85040 ABCTrans -17.62588 -24.61031 Source: Data Analysis output by author using e-view (2012)
Details of outputs are available on request.
1% Critical Value* 5% Critical Value* 10% Critical Value*
-3.4408 -2.8660 -2.5692
*MacKinnon critical values for rejection of hypothesis of a unit root
The study here employed the unit root test to examine the time series properties of concerned variables. Unit root test describes whether a series is stationary or non-stationary. For the test of unit root the present study employed the Augmented Dickey Fuller test. ADF test is used to measure the stationarity of time series data which in turn tells whether regression can be done on the data or not.
The output is presented in the Table 2. On observing the outputs of ADF tests, it can be seen that the ADF test statistic for all variables is less than the critical values at 1%, 5% and 10% confidence level. So, the null hypothesis is rejected and the data is found to be stationary at level. Hence we came to the conclusion that both time series can be assumed to be invariant with respect to time. We therefore employed them for further analysis.
TEST OF HYPOTHESIS
THE CAUSALITY BETWEEN TRADING VOLUME AND STOCK RETURNS
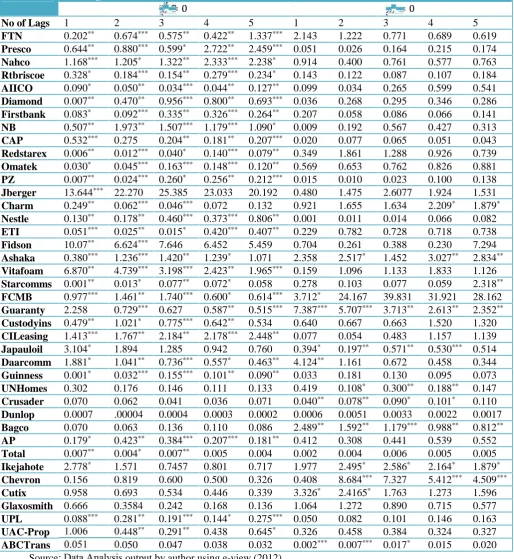
Table 3: Granger Causality Test Result Securities Trading Volume
= 0 = 0
No of Lags 1 2 3 4 5 1 2 3 4 5
FTN 0.202** 0.674*** 0.575** 0.422** 1.337*** 2.143 1.222 0.771 0.689 0.619 Presco 0.644** 0.880*** 0.599* 2.722** 2.459*** 0.051 0.026 0.164 0.215 0.174 Nahco 1.168*** 1.205* 1.322** 2.333*** 2.238* 0.914 0.400 0.761 0.577 0.763 Rtbriscoe 0.328* 0.184*** 0.154** 0.279*** 0.234* 0.143 0.122 0.087 0.107 0.184 AIICO 0.090* 0.050** 0.034*** 0.044** 0.127** 0.099 0.034 0.265 0.599 0.541 Diamond 0.007** 0.470** 0.956*** 0.800** 0.693*** 0.036 0.268 0.295 0.346 0.286 Firstbank 0.083* 0.092*** 0.335** 0.326*** 0.264** 0.207 0.058 0.086 0.066 0.141 NB 0.507** 1.973** 1.507*** 1.179*** 1.090* 0.009 0.192 0.567 0.427 0.313 CAP 0.532*** 0.275 0.204** 0.181** 0.207*** 0.020 0.077 0.065 0.051 0.043 Redstarex 0.006** 0.012*** 0.040* 0.140*** 0.079** 0.349 1.861 1.288 0.926 0.739 Omatek 0.030* 0.045*** 0.163*** 0.148*** 0.120** 0.569 0.653 0.762 0.826 0.881 PZ 0.007** 0.024*** 0.260* 0.256** 0.212*** 0.015 0.010 0.023 0.100 0.138 Jberger 13.644*** 22.270 25.385 23.033 20.192 0.480 1.475 2.6077 1.924 1.531 Charm 0.249** 0.062*** 0.046*** 0.072 0.132 0.921 1.655 1.634 2.209* 1.879* Nestle 0.130** 0.178** 0.460*** 0.373*** 0.806** 0.001 0.011 0.014 0.066 0.082 ETI 0.051*** 0.025** 0.015* 0.420*** 0.407** 0.229 0.782 0.728 0.718 0.738
Fidson 10.07** 6.624*** 7.646 6.452 5.459 0.704 0.261 0.388 0.230 7.294
Ashaka 0.380*** 1.236*** 1.420** 1.239* 1.071 2.358 2.517* 1.452 3.027** 2.834** Vitafoam 6.870** 4.739*** 3.198*** 2.423** 1.965*** 0.159 1.096 1.133 1.833 1.126 Starcomms 0.001** 0.013* 0.077** 0.072* 0.058 0.278 0.103 0.077 0.059 2.318** FCMB 0.977*** 1.461** 1.740*** 0.600* 0.614*** 3.712* 24.167 39.831 31.921 28.162 Guaranty 2.258 0.729*** 0.627 0.587** 0.515*** 7.387*** 5.707*** 3.713** 2.613** 2.352** Custodyins 0.479** 1.021* 0.775*** 0.642** 0.534 0.640 0.667 0.663 1.520 1.320 CILeasing 1.413*** 1.767** 2.184** 2.178*** 2.448** 0.077 0.054 0.483 1.157 1.139 Japauloil 3.104* 1.894 1.285 0.942 0.760 0.394* 0.197** 0.571** 0.530*** 0.514 Daarcomm 1.881* 1.041** 0.736*** 0.557* 0.463** 4.124** 1.161 0.672 0.458 0.344 Guinness 0.001* 0.032*** 0.155*** 0.101** 0.090** 0.033 0.181 0.130 0.095 0.073 UNHomes 0.302 0.176 0.146 0.111 0.133 0.419 0.108* 0.300** 0.188** 0.147 Crusader 0.070 0.062 0.041 0.036 0.071 0.040** 0.078** 0.090* 0.101* 0.110 Dunlop 0.0007 .00004 0.0004 0.0003 0.0002 0.0006 0.0051 0.0033 0.0022 0.0017 Bagco 0.070 0.063 0.136 0.110 0.086 2.489** 1.592** 1.179*** 0.988** 0.812** AP 0.179* 0.423** 0.384*** 0.207*** 0.181** 0.412 0.308 0.441 0.539 0.552
Total 0.007** 0.004* 0.007** 0.005 0.004 0.002 0.004 0.006 0.005 0.005
Ikejahote 2.778* 1.571 0.7457 0.801 0.717 1.977 2.495* 2.586* 2.164* 1.879* Chevron 0.156 0.819 0.600 0.500 0.326 0.408 8.684*** 7.327 5.412*** 4.509***
Cutix 0.958 0.693 0.534 0.446 0.339 3.326* 2.4165* 1.763 1.273 1.596
Glaxosmith 0.666 0.3584 0.242 0.168 0.136 1.064 1.272 0.890 0.715 0.577
UPL 0.088*** 0.281** 0.191*** 0.144* 0.275*** 0.050 0.082 0.101 0.146 0.163 UAC-Prop 1.006 0.448** 0.291** 0.438 0.645* 0.326 0.458 0.384 0.324 0.327 ABCTrans 0.051 0.050 0.047 0.038 0.032 0.002*** 0.007*** 0.017* 0.015 0.020
Source: Data Analysis output by author using e-view (2012).
∗∗∗,∗∗ ∗indicate level of significant at 1%, 5% and 10% respectively.
In order to test for causality we estimated a bivariate pair wise granger causality test. The results of analysis were shown on table 3 indicated the F-statistics and their corresponding level of significance at different time lags. Granger causality results provide very important information regarding the direction of information transmission. Causality has been observed significantly from return to volume in most of securities.
Fcmb, Custodyins, CILeasing, GUINNESS, AP, Total, UPL, UAC-Prop) securities of 40 securities sampled for the study representing about 62.5%. This implied that by studying the prices of these securities, the various stakeholders can predict the market and formulate an efficient portfolio.
However, there were 6 securities (UNHomes, Crusader, Bagco, Chevron, Cutix, ABCTrans) representing about 15%, that indicated causality ran from trading volume to stock returns which means that it is volume that influenced the price variability. The implication of this is that by studying the volume of transaction traded daily on these securities, their future performance can be determined and this can serve as investment decisional strategies for the various investor both existing and potential ones.
Besides, there were 7 securities (Charm, Ashaka, Starcomms, GUARANTY, Ikeja hotel, Japauloil, Daarcomm) representing about 17.5%, that showed evidence bi-directional relation between trading volume and stock return whereas non causality was found in the case of Dunlop and Glaxosmith representing 5% of the sampled equity securities in the Nigerian Stock Market for daily information from January, 2009 to June, 2012.
For the bi-directional, the decision maker is left with option of which of the series to be used as their strategies instrument out the price variability and volume of share traded as this implied that both of the can serve as veritable instrument for investment decision. But for non causality, it means that other factors need to be considered when analyzing the suitability of the securities for the purpose of investment and portfolio development.
In the overall, the result provides evidence for the rejection of the first null hypothesis that there is no significant causal relation between stock returns and trading volume in Nigerian capital market. This finding is consistent with the observations of Rogalski (1978), Smirlock and Starks (1988), Moosa and Al-Loughani (1995) Lee and Rui (2002) and Rashid (2007). The finding also contradicts the works of Hiemstra and Jone (1994) and Silvapille and Choi (1999). However, the Granger causality results show that returns cause volume and that the past trading volume also Granger causes returns albeit in lesser number of stocks. This evidence supports the sequential processing of information hypothesis argued by Smirlock and Starks (1988). They proposed that the information arrives sequentially rather than simultaneously in the market. The evidence that volume Granger causes returns for some stocks supports theoretical models which imply that there is information content in volume which predicts future returns. The difference in direction of causality across stocks may be due to nature of the industry, types of investors among others.
However, in the overall as indicated by 62.5% of sampled securities, it can be inferred that returns contain significant information for trading volume.The possible explanation of the result was that since the liquidity has dried up the market as a result of market crash, investors are now looking for any available price increment so as to dispose off their investments. This implies that past prices are being used as forecasts element in Nigerian capital market.
CONCLUSIONS
Nigerian Stock market contributes to economic growth through the specific services it performs either directly or indirectly. Notable among the functions of the stock market are mobilization of savings, creation of liquidity, risk diversification, improved dissemination and acquisition of information, and enhanced incentive for corporate control as well as improving macroeconomic stability. Therefore, studies on microstructure of the market to ascertain its effectiveness particularly in the area of return predictability would be of great importance and significance. Findings from such studies would no doubt have a number of implications. First, given outcome of this study, the model used in this study could be used as a basis for formulating investment policies in quest for return forecasting in the Nigerian stock market. Second, the result of this study provided information on the true nature of relationship between stock return and trading volume in the Nigerian capital market. It further debunked the notion that mere demand and supply determine the prices of the securities. Consequently, the findings of the research should be able to make the existing and potential investors determine what to place on any securities when making ask-bid recommendation. Finally, the findings should be of policy relevance to SEC. It is hope that results from this study would make management of SEC to look both inward at microstructure of the market when formulating policy for the effectiveness of the market
Based on the findings of the study, the following recommendations are made:
i) The financial analysts and advisers in developing the buy and sell recommendations should examine the past securities prices in order to formulate efficient portfolio for their client
ii) SEC should put adequate policies in place to prevent manipulation of market information data as these have significant effect in determination of market dynamics which can result into nation’s macroeconomic stability.
Reference
Aliyu, S.U.R. (2010): “Does inflation has an impact on Stock Returns and Volatility? Evidence from Nigeria and Ghana,”Economic and Financial Review (N. E. F. R.) December 2010
Arestis, P, Demetriades, P. &Luintel, K.B. (2001): “Financial Development and Economic Growth: The Role of Stock Markets”,Journal of Money, Credit and Banking, 33(2):16-41.
Brailsford, T. (1996): “The empirical relationship between trading volume, returns, and volatility,”
Accounting and Finance, 35: 89–111.
Brooks, C. (1998): “Predicting stock index volatility: Can market volume help?”,J. Forecast. 17: 59-80.
Chen, Firth & Yu, (2004): “The Price-Volume Relationship in China’s Commodity Futures Markets”,The Chinese Economy, 37(3): 87-122.
Deo, M. Srinivasan, K. and Devanadhen, K. (2008): “The Empirical Relationship between Stock Returns, Trading Volume and Volatility: Evidence from Select Asia-Pacific Stock Market”,
European Journal of Economics, Finance and Administrative Sciences, Issue: 12
Dickey, D. A. & Fuller, W.A. (1979): “Distribution of Estimators for Autoregressive Time Series with a Unit Root”,Journal of the American Statistical Association, 74(366): 427-431.
Dickey, D. A. & Fuller, W.A. (1981): “Likelihood Ratio Statistics for Autoregressive Time Series with a Unit Root”,Econometrica, 49(4): 1057-1072.
Engle, R.F. & Ng, V.K. (1993): "Measuring and Testing the Impact of News on Volatility”, Journal of Finance, December, Vol.48: pp.1749-1778.
Gallant, Rossi &Tauchen, (1992): “Stock Prices and Volume”,The Review of Financial Studies,5(2):
199-242.
Hiemstra, C., & Jones, D. (1994): “Testing for Linear and Nonlinear Granger Causality in the Stock Price-Volume Relation”,The Journal of Finance, 49(5): 639-1664.
Karpoff J.M (1987): “The relation between price changes and trading volume: A survey”, Journal of Financial and Quantitative Analysis 22(1): 109-126
Lee, B.S. &Rui, O.M. (2002): “The Dynamic Relationship between Stock Returns and Trading Volume: Domestic and Cross-Country Evidence”,Journal of Banking and Finance, 26(1): 51-78.
Levine, R &Zervos S. (1996): “Stock Market Development and Long-Run Growth”,World Bank Economic Review, 10(1): 323-339.
Moosa, I. A. & Al-Loughani, N. E. (1995): “Testing the price-volume relation in emerging Asian stock markets,”Journal of Asian Economics, 6: 407-422.
Nwachukwu, N.C &Okpara, G.C (2010): “The effect of financial deepening on stock market returns and volatility: Evidence from Nigeria”, International Research Journal of Finance and Economics, ISSN 1450-2887 Issue 40. http://www.eurojournals.com/finance.htm
Okereke-Onyiuke N (2000): “Stock Market Financing Options for Public Projects in Nigeria”,The Nigerian Stock Exchange Factbook 2000.
Olowe, R. A. (2009): “Stock Return, Volatility And The Global Financial Crisis In An Emerging Market: The Nigerian Case”,International Review of Business Research Papers Vol. 5(4) Pp.
426-447.
Poterba, J. M. (2000): “Stock Market Wealth and Consumption”,Journal of Economic Perspectives, 14(2):
99-118.
Rashid, A. (2007): “Stock prices and trading volume: An assessment for linear and nonlinear Granger causality”,J. Asian Econ.18(4): 595- 612.
Ratner, M. & Leal R. (2001): “Stock returns and trading volume: Evidence from the emerging markets of Latin America and Asia”,Journal of Emerging Markets, 6: 5–22.
Rogalski, R.J. (1978): “The Dependence of Prices and Volume,”The Review of Economics and Statistics,
Vol.60: No.2, 268-274.
Silvapulle, P & Choi, J. (1999): “Testing for linear and nonlinear granger causality in the stock price volume relation: Korean evidence”, The Quarterly Review of Economics and Finance, Elsevier,
39(1), pages 59-76.
Smirlock, M., & Starks, L.T. (1988): “An empirical analysis of the stock price-volume relationship”,Journal of Banking & Finance, 12: 31-41.
Watson, J. (2001). How to Determine a Sample Size: Tipsheet #60, University Park, PA: Penn State
Cooperative Extension. Available at: