ADSORPTION BEHAVIOUR OF REACTIVE RED 2 (RR2)
TEXTILE DYE ONTO CLAYS: EQUILIBRIUM AND KINETIC
STUDIES
Manpreet Kaur
[a]and Monika Datta
[b]*Keywords: adsorption; adsorption kinetics; cation exchange; montmorillonite; organophilic clays; zeta potential
Batch adsorption studies were carried out to investigate the adsorption behaviour of textile dye- Reactive red 2 (RR2) from aqueous solution onto montmorillonite (Mt) clay and organophilic Mt clays. The monovalent organic cations- cetyltrimethylammonium (CTA+) and cetylpyridinium (CP+) were exchanged for the metal cations in montmorillonite clay to prepare the organophilic Mt clays- CTA–Mt and CP-Mt. The synthesis of these organophilic clays was confirmed by X-Ray diffraction (XRD), Fourier Transformed Infra Red (FTIR), specific surface area (BET ) and zeta potential techniques. The adsorption affinity of Mt, CTA-Mt and CP-Mt for RR2 was investigated as a function of pH of the aqueous dye solution, contact time, initial dye concentration and adsorbent dosage. The adsorption data obtained was fitted to the Langmuir, Freundlich and Temkin adsorption models and it was found that Langmuir adsorption isotherm yielded the most favourable representation of the adsorption behaviour of RR2. The adsorption kinetics of RR2 has been studied in terms of pseudo-first-order, pseudo-second-order and intraparticle diffusion processes. It was found that the pseudo-second-order mechanism is predominant in the present adsorption system suggesting chemisorption of the dye.
*Corresponding Authors
E-Mail: [email protected]
[a] Department of Chemistry, University of Delhi, Delhi-110007, India. E-mail:[email protected]
[b] Department of Chemistry, University of Delhi, Delhi-110007, India
INTRODUCTION
Treatment of a highly colored aqueous effluent from textile dye house industries has attracted the attention of environmentalists, technologists as more than 60 % of the world dyes production is consumed by textiles industries.1 The classes of dyes mostly used by the textile industry are azo dyes containing reactive group.2 Fibre reactive dyes are colored organic compounds capable of forming covalent bonds between reactive group of the dye molecule and nucleophilic groups on the polymer chain within the fibre. Reactive dyeing of cotton is currently the most widespread textile dyeing process in the world. Approximately 80% of the reactive dyes are based on the azo chromogen.3
Reactive dyes react with cellulosic fibres (cotton) under alkaline conditions. However, because of the competition between the Cell-O- from the cellulose fibres and hydroxide (OH-) ions present in the dye bath at elevated pH values, a portion of the dye reacts with OH- ions instead of the Cell-O- ions. Under typical dyeing conditions, approximately 50 % of the dye remains in the dyebath in its hydrolyzed form which has no further affinity for the fiber.4 Thus reactive dyes have a low utilization degree compared to other types of dyestuff because of undesirable hydrolysis reaction.
Reactive dye wastewater is characterized by poor biodegradability, thus conventional wastewater treatment is not suitable.5 Thus both biological and physical/chemical methods have been employed for dye removal, the former have not been very successful, due to the essential non-biodegradable nature of most of these dyes.6,7 The physical/chemical methods that have
been proven to be successful are adsorption, coagulation/ flocculation, membrane filtration, chemical oxidation and electrochemical treatment.8
Currently the adsorption technique is proved to be an effective and attractive process for the treatment of these dye bearing wastewaters.9,10 The use of activated carbon as an adsorbent is still very popular because of its extended surface area, micro porous structure, high adsorption capacity and high degree of surface reactivity. However, regeneration or reuse of carbon results in a steep reduction in performance, and efficiency becomes unpredictable.11
Because of the abundance in most continents of the world, low cost, high specific surface area, potential for ion exchange, high sorption capability etc., clays such as montmorillonite, bentonite, and sepiolite are being considered as low cost alternative adsorbents.12,13 Among many kinds of clay minerals, montmorillonite (Mt) clays have often been used in the remove of organic pigments and dyes due to their high surface area and high cation exchange capacity. Montmorillonite is a 2:1 smectite clay having chemical composition-M+
x+y(Al2-x)(OH)2(Si4-yAly)O10. The isomorphous substitution of Al3+ for Si4+ in the tetrahedral layer and Mg2+ for Al3+ in the octahedral layer results in a net negative surface charge which is balanced by inorganic exchangeable cations (Na+, Ca2+, etc.). These highly hydrated ions are responsible for the hydrophilic nature of the clay.14-16
Eur. Chem. Bull., 2014, 3(8), 838-849 DOI: 10.17628/ECB.2014.3.838
839
by variation of surfactant properties,19 such as alkyl chain length, number and branches.20,21 Although the modification of clays with surfactants increases their cost significantly, the resultant increase in adsorption capacity may still make surfactant-modified clays cost effective. So clay and modified clay based derivatives may prove to be promising adsorbents.
The present work is aimed to study the adsorption capacity and mechanism of removal of anionic dye Reactive red 2 (RR2) by Mt and organophilic Mt clays from aqueous solution. The reason behind selecting C.I. Reactive red 2 dye in the present work, is its extensive use in textile industry for dyeing cellulose fiber, its high solubility and its persistent nature once it is discharged into the water bodies. Moreover, only 60-70% of this dye reacts with the fiber during dyeing, the remaining gets hydrolyzed and is released into the water bodies. Also, reactive red 2 is a non biodegradable dye because of the recalcitrant nature of the azo group.
The removal of RR2 from aqueous solutions by the clays was investigated with respect to pH of the aqueous dye solution, contact time, initial dye concentration and adsorbent dosage. The experimental data were evaluated by applying different kinetic models to understand the dye adsorption behaviour.
EXPERIMENTAL
Materials
All the reagents used in the present work were of analytical grade and were used without any further purification. The clay montmorillonite used in the present work was obtained from Sigma Aldrich, St. Louis, U.S.A. The cation exchange capacity (CEC) of the clay was determined by ion exchange method22 and was found to be
47.83 mEqv./100 g. The textile dye - Reactive red 2 (C.I. 18200) (empirical formula - C19H10Cl2N6Na2O7S2, mol. wt.
615.33 g mol-1, dye content – 40 % and absorbance maxima
- 537 nm was obtained from Sigma Aldrich, St. Louis, U.S.A. The surfactant N-cetylpyridiniumchloride monohydrate (C21H38ClN.H2O, mol.wt. 358.01 g mol-1) was
obtained from E. Merck, Germany and cetyltrimethylammonium bromide, ([CH3(CH2)15](CH3)3
NBr, mol. wt. 364.47 g mol-1) was obtained from BDH,
England. For the entire experimental process, double distilled water was used.
Structure of montmorillonite (Mt) clay
Chemical structure of C.I. reactive red 2
Synthesis of organophilic clays
Organophilic clays were prepared via a cation-exchange process employing a modification of the reported procedure.23 To a known amount of Mt in 100 ml of double
distilled water 1% aqueous solution of organic cation was gradually added with continuous stirring over a period of 5-6 hours. The resultant clay was centrifuged at 8000 rpm using REMI R24 centrifuge and washed with double distilled water till complete removal of halide ions and then dried in an oven at 80 C. The organophilic clays thus prepared are designated as CP-Mt and CTA-Mt.
Characterization of the synthesized organophilic clays
X-Ray diffraction (XRD) patterns of Mt, CP-Mt and CTA-Mt were recorded using Cu K radiation (n 1.54056 Ǻ) on a Philips X′ Pert-PRO MRD system operating at 2
values between 250°. The system was operated at 50 kV and 100 mA in continuous scan mode with a scanning speed of 0.008 ° sec-1. The FT-IR spectra were recorded using a
Perkin-Elmer FT-IR spectrophotometer. The spectra of the samples contained in a KBr matrix were recorded at room temperature over the wavenumber range 4000400 cm1
employing a total of 64 scans at a resolution of 4 cm1. The
specific surface areas of the clay and the organophilic clays calculated by the BET method were determined using an ASAP - Micromeritics 2420 instrument employing nitrogen as the adsorbate at 196 oC. The zeta potential
measurements were performed using Malvern zetasizer. All the measurements were done with samples dispersed in double distilled water for zeta potential measurements.
pH stability study of the aqueous RR2 dye solution
To investigate the pH stability of the aqueous RR2 dye solution, the aqueous dye solutions (20 mgdm-3
concentration) in the pH range 2 to 10 were prepared. The pH of the solutions was maintained using 0.1N and 0.01N HCl/NaOH solutions using pH 510 cyberscan pH meter (Eutech instruments). The solutions thus prepared were analysed spectrophotometrically at 537 nm.
Adsorption equilibrium studies of RR2 dye on clay and organophilic clays
Employing the batch method, the adsorption behaviour of the dye on Mt, CP-Mt and CTA-Mt was investigated as a function of
N N
N Cl
Cl HN OH S
N
O O
O
S O
O O
pH of the aqueous dye solution contact time for batch adsorption concentration of the dye solution adsorbent dosage
All adsorption experiments were performed using 0.1 g of each adsorbent at 30 °C. To investigate the effect of pH on the adsorption efficiency, the aqueous dye solutions (50 mg dm-3concentration) having pH values 2, 4, 6, 8 and 10 were
prepared. Each one of these solutions (50 ml) was treated with the adsorbents for a fixed period of 25 minutes. To study the effect of contact time on the adsorption efficiency, 50 ml of 50 mg dm-3of the aqueous dye solution maintained
at pH 6.0 were treated with the adsorbents over a period of 5 to 120 minutes. To investigate the effect of initial dye concentration on adsorption efficiency, aqueous dye solutions having 40 mg dm-3 to 280 mg/dm3 concentration
range were prepared. Each one of these solutions (50 ml) maintained at pH 6.0 was treated with the adsorbents for a fixed time period of 25 minutes. To study the effect of adsorbent dosage on adsorption efficiency, 50 ml of 300 mg dm-3of the aqueous dye solution maintained at pH 6.0 were
treated with 0.1 to 0.3 g of the adsorbent dosage for a period of 25 minutes. After each set of experiment, the adsorbent was recovered by centrifugation at 10 000 rpm for 20 min using an REMI R24 centrifuge and the supernatant thus obtained was used for the estimation of the unadsorbed dye in the solution by spectrophotometric method. The absorbance was measured at 537 nm and the concentration of the unadsorbed dye was determined from the Beer’s Lamberts plot at 537 nm with the percentage of the dye adsorbed, β and the amount of dye adsorbed qe (mg g-1) being calculated using equation (1) and (2)
respectively.
(1)
where,
Ci is the initial concentration (mg dm-3) of the dye
solution and
Ce is the concentration of the dye (mg dm-3) in the
supernatant at the equilibrium stage.
(2)
where,
V is the volume of the dye solution (dm3) and
m is the mass of adsorbent employed (g).
Kinetic modelling
The kinetic studies of the dye adsorption were carried out with respect to the initial concentration of the dye solution at 30 °C. Three different concentrations of the dye – 50, 100 and 160 mg dm-3 were prepared and 50 dm3 of each of these
solution maintained at pH 6.0 was treated with 0.1g of the adsorbents for a time period of 5 to 60 minutes.
RESULTS AND DISCUSSION
Characterization of the synthesized organophilic clays
X-Ray diffraction (XRD) studies
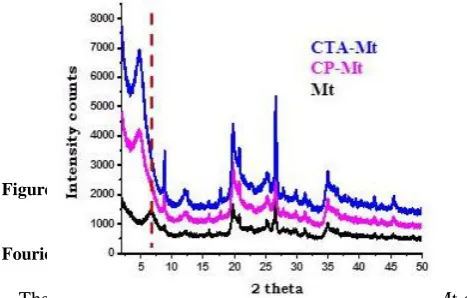
To confirm the intercalation of CP+ and CTA+ in the interlayer region of Mt, XRD studies were performed. The diffractogram of Mt, CP-Mt and CTA-Mt (Fig.1) indicated a shift in the peak in the lower angle region in the 001 plane from 2θ= 6.8° in the pristine Mt to 4.8° in CP-Mt and 4.9° in CTA-Mt resulting in an increase in the corresponding d spacing from 13.4 Å in pristine Mt to 18.2 Å in both the cases. This relative increase in the d spacing confirms the intercalation of the surfactants into the interlayer region of Mt.24
Figure 1. XRD pattern of clay and organophilic clays
Fourier Transformed IR (FTIR) spectral studies
The FTIR spectra of pristine Mt, CP-Mt and CTA-Mt are shown in Fig.2. In the FTIR spectrum of Mt, the vibrational band at 1049 cm-1 has been assigned to Si-O stretching and
is the characteristic band of Mt. The vibrational band at 1639 cm-1 corresponds to the H-O-H bending mode from
sorbed water. The broad band from 3000 to 3700 cm-1 in Mt
has been assigned to H-O-H stretching vibrations from sorbed water and O-H stretching vibrations of the structural OH groups merged together. The band is broad because of hydrogen bonding between the interlayer water and structural OH groups. The vibrational bands at 527 cm-1 and
466 cm-1 are strong bending vibrations corresponding to
Al-O-Si and Si-Al-O-Si respectively.25
Pair of strong vibrational bands at 2925, 2852 cm-1 and 2925,
2853 cm-1 observed in the case of CP-Mt and CTA-Mt
correspond to the C-H antisymmetric and C-H symmetric vibrations respectively from the methylene group of surfactants.26 In case of CP-Mt and CTA-Mt, the vibrational
bands at 3449 cm-1 and 3451 cm-1 respectively have been
assigned to the H-O-H stretching vibrations of the sorbed water but the intensity of these peaks is low as compared to Mt as the intercalation of the surfactant (confirmed by XRD) in the clay layers displaces the water molecules. The displacement of the water molecules is also evident from the presence of relatively distinct and sharp peaks at 3631cm-1 and 3632 cm-1 observed in
case of CP-Mt and CTA-Mt respectively as the extent of hydrogen bonding is lesser. The presence of these bands in the synthesized organophilic clays indicate the presence of surfactant in the clay.27,28
i e
i
( - ) β = C C ×100
C
i e e
(
-
)
=
C C V
q
Eur. Chem. Bull., 2014, 3(8), 838-849 DOI: 10.17628/ECB.2014.3.838
841
Figure 2. FTIR spectraof clay and organophilic claysSurface charge analysis using zeta potential measurements
The adsorption of the surfactant (organic cations) on Mt was also evident from the zeta potential measurements. The Mt particles were found to carry a net positive charge, +6.23 mV. However, after treatment with the surfactant, the clay particles exhibited an increased positive charge from +6.23 mV in Mt to +22.6 mV and +17.2 mV in case of CTA-Mt and CP-Mt respectively. The results obtained indicates that the organic cations after complete interlayer exchange with the hydrated metal ions covers the surface of Mt as the surfactant loading was found to be in excess of the cation exchange capacity (CEC) of clay (1.3 times of CEC). The organic cations are probably oriented in a bilayer arrangement on the surface of Mt, thus making the surface of the organophilic clays more positive.
Specific surface area measurement by BET method
Application of BET analysis to the respective nitrogen isotherms measured at -196 oC showed that the specific
surface areas of Mt, CP-Mt and CTA-Mt were 2.87 m2 g-1,
8.2 m2 g-1 and 9.82 m2 g-1, respectively. This increase in
surface area may be attributed to an increase in the basal spacing (d), and to the creation of micro porosity due to intercalation of the organic cations in the clay interlayers.
Figure 3. Absorption spectra of aqueous dye solution as a function of pH
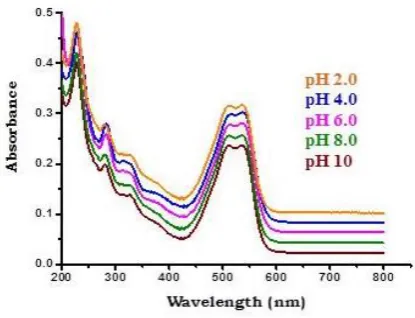
pH stability study of the aqueous RR2 dye solution
The behaviour of the aqueous dye solution in the pH range 2 - 10 was investigated spectrophotometrically (Fig. 3). The
absorption band at 537 nm corresponds to the π–π* transition of electrons in the azo-group connecting phenyl and naphtyl ring.29 Within near ultraviolet region (280–380
nm), absorption bands result from the unsaturated system of benzene and naphthalene ring. However, no shift in the absorption maxima of the dye was found indicating that the dye remains stable in the entire pH range studied.
Adsorption equilibrium studies of RR2 dye on clay and organophilic clays
Influence of pH of the aqueous dye solution on adsorption efficiency
There was no pronounced effect of pH of the aqueous dye solution on the adsorption efficiency of CP-Mt and CTA-Mt as more than 95 % of the dye was removed in the entire pH range studied except at pH 6.0 at which almost 100 % of the dye was absorbed by the organophilic clays (Fig. 4). On the other hand, the dye uptake by Mt was low, showing a maximum of 24 % uptake at pH 6.0. Under strong alkaline conditions (pH 10.0), the dye adsorption by Mt fell sharply which may be because of de-protonation of the silanol/aluminol groups on the clay giving rise to negatively charged surface which resists the adsorption of the anionic dye.30
AlOH + OH— ֶ→ AlO— + H2O
Since pristine Mt is hydrophilic in nature owing to the presence of greater amount of surface and interlayer water hence it is more susceptible to change in pH values.
Figure 4. Effect of pH of aqueous dye solution on adsorption efficiency. Adsorbent dose = 0.1 g; conc. of dye = 50 mg dm-3; contact time = 25 min; T = 30° C
Influence of contact time on adsorption efficiency
concentration of 50 mg dm-3) beingremoved in the first 10
minutes of the contact time. This initial rapid uptake can be attributed to the concentration gradient created at the start of the adsorption process between dye concentration in solution and that at the adsorbent surface. As the dye loading increases on the adsorbent, this gradient reduces and gives way to a slower uptake.
Figure 5. Effect of contact time on adsorption efficiency. Adsorbent dose = 0.1 g; conc. of dye = 50 mg dm-3; pH = 6.0; T = 30° C
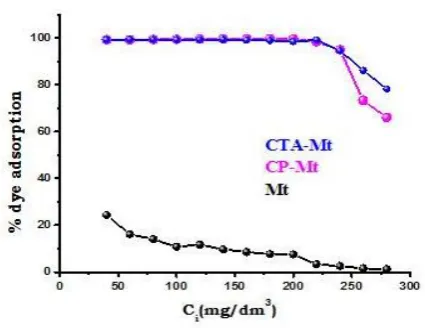
Influence of the initial dye concentration on adsorption efficiency
It was observed that with an increase in the initial dye concentration, the % adsorption decreased after reaching saturation at a particular initial dye concentration for all the three adsorbents studied (Fig. 6). Almost 100 % adsorption was observed in case of CP-Mt and CTA-Mt up to 220 mg dm-3 dye concentration after which a decrease was seen. A
similar trend was also observed in case of Mt but the % adsorption decreased rapidly with increase in the initial dye concentration, showing a maximum of 25 % adsorption.
Figure 6. Effect of initial dye concentration on adsorption efficiency.Adsorbent dose = 0.1 g; pH = 6.0; contact time = 25 min; T = 30° C
For all the three adsorbents studied, the % dye adsorption was higher for low initial dye concentration because of the availability of the unoccupied sorption sites on the
adsorbents. At higher concentrations, the number of available adsorption sites becomes lower, and subsequently the removal of dye depends on the initial concentration.
Influence of the adsorbent dose on adsorption efficiency
It was observed that as the mass of the adsorbent dosage increased from 0.1 g to 0.3 g, the percentage dye adsorption also increased (Fig. 7). This increase in % adsorption observed with all the three adsorbents is due to increase in the number of adsorption sites associated with higher adsorbent dosage.
Figure 7. Effect of adsorbent dosage on adsorption efficiency. Contact time = 25 min; conc. of dye = 300 mg dm-3; pH = 6.0; T = 30° C
Adsorption equilibrium models
The adsorption capacity of Mt, CP-Mt and CTA-Mt for the dye was determined by studying the equilibrium adsorption isotherm. The adsorption isotherms of reactive red 2 dye on CP-Mt and CTA-Mt as shown in Fig. 8 were of L-type according to the Giles classification.31 In this type of
isotherm, the initial curvature indicates that a large amount of dye gets adsorbed at lower dye concentrations; however with increase in the dye concentration monolayer formation occurs, signified by the plateau as near the monolayer capacity all sorption sites are occupied. Three common isotherms equations were tested in the present study: Langmuir, Freundlich and Temkin models. Applicability of the adsorption isotherm equations was compared by judging the correlation coefficients.
Langmuir adsorption isotherm
The Langmuir adsorption isotherm is based on the assumption of a structurally homogeneous adsorbent, where all the sorption sites are identical and energetically equivalent.17 Therefore the sorbent has a finite capacity for
Eur. Chem. Bull., 2014, 3(8), 838-849 DOI: 10.17628/ECB.2014.3.838
843
Figure 8. Adsorption isotherm, qe as a function of Ce(3)
where
Ce (mg dm-3) is the liquid phase concentrationof the
adsorbate at equilibrium
qe (mg g-1) is the solid phase concentration of an
adsorbate at equilibrium
qmax = monolayer capacity of the adsorbent (mg g-1), a
constant related to the area occupied by a monolayer of adsorbate, reflecting the limiting adsorption capacity,
KL = Langmuir adsorption constant (dm3 mg-1) which
measures the enthalpy of adsorption process.
The plot of Ce/qe vs. Ce gives a straight line (Fig. 9), with
slope equal to 1/qmax and intercept equal to 1/(qmaxKL).
The essential characteristics of the Langmuir equation can be expressed in terms of a dimensionless constant which is defined as
(4)
where,
Ci = highest initial dye concentration
The value of RL indicates the type of the isotherm to be
either unfavourable (RL >1), linear (RL =1) or favourable (RL
<1).32,33
Figure 9. Langmuir adsorption isotherm
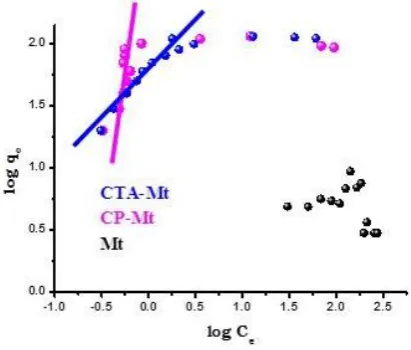
Freundlich adsorption isotherm
The Freundlich adsorption isotherm is applicable to multilayer and heterogeneous surface and is expressed by the following equation.
(5)
where,
KF is a constant for the system, related to the
bonding energy.
The slope 1/n, ranging between 0 and 1, is a measure for the adsorption intensity or surface heterogeneity.34
1/n values indicate the type of isotherm to be irreversible (1/n = 0), favourable (0 < 1/n < 1), and unfavourable (1/n > 1).35 A plot of log q
e vs log Ce (Fig. 10) enables the
empirical constants KF and 1/n to be determined from the
intercept and slope of the linear regression.
Figure 10. Freundlich adsorption isotherm
Temkin adsorption isotherm
e e
e max L max
1
=
+
C
C
q
q
K
q
L
L i
1 =
1+ R
K C
e F e
1 log q = log K + log C
The Temkin isotherm equation assumes that the heat of adsorption of all the molecules in layer decreases linearly with coverage due to adsorbent-adsorbate interactions, and that the adsorption is characterized by a uniform distribution of the bonding energies, up to some maximum binding energy.36
The Temkin isotherm is given as:
(6)
where
A (dm3 g-1) is the equilibrium binding constant,
corresponding to the maximum binding energy and
constant B is related to the heat of adsorption.
A plot of qe versus ln Ce (Fig. 11) enables the
determination of the isotherm constants B and A from the slope and intercept of the straight line plot.
Figure 11. Temkin adsorption isotherm
The model parameters for all the isotherms studied at 30 °C are presented in table 1. The linear plot of specific sorption (Ce/qe) against the equilibrium concentration (Ce)
(Fig. 9) shows that the adsorption of the dye on CP-Mt and CTA-Mt obeys the Langmuir model. The high regression coefficient values R2 obtained for this model for CP-Mt and
CTA-Mt as compared to the Freundlich and Temkin adsorption isotherm support this fact. Also, the value of RL
obtained for the adsorption of the dye on CP-Mt and CTA-Mt falls in the range 0 < RL < 1, indicating that the
adsorption process is favourable. For Mt, the experimental adsorption data follows Langmuir adsorption model only upto 120 mg dm-3 dye concentration and does not fit beyond
this concentration. Till this concentration, the adsorption is favorable as indicated by the R2 and R
L values.
The Freundlich and Temkin adsorption isotherms do not fit well to the experimental adsorption data in the higher
concentration region. The magnitude of KL quantifies the
relative affinity between an adsorbate and the adsorbent surface. The higher value of KL observed in the case of
CP-Mt as compared to CTA-CP-Mt demonstrates the higher ability of this adsorbent to adsorb dye molecules and form stable complexes. The high value of KF obtained in case of CP-Mt
as compared to CTA-Mt indicates that CP-Mt has a strong affinity for the dye. However, at higher concentration of the dye, CTA-Mt was found to be a more suitable adsorbent. The high value of the constant B obtained from the Temkin model in case of CP-Mt and CTA-Mt suggest that there is a strong interaction between the adsorbate and the adsorbent surface. The confirmation of the experimental adsorption data with the Langmuir model in the entire concentration range studied indicates the monolayer coverage of dye on the surface of CP-Mt and CTA-Mt which suggests that the adsorption of the dye on CP-Mt and CTA-Mt involves chemisorption. This is because chemisorption involves a more specific binding of the adsorbate to the adsorbent hence chemisorption ceases once a mono layer is formed.
Table 1. Parameters for the fitted isotherm models for RR2 dye adsorption
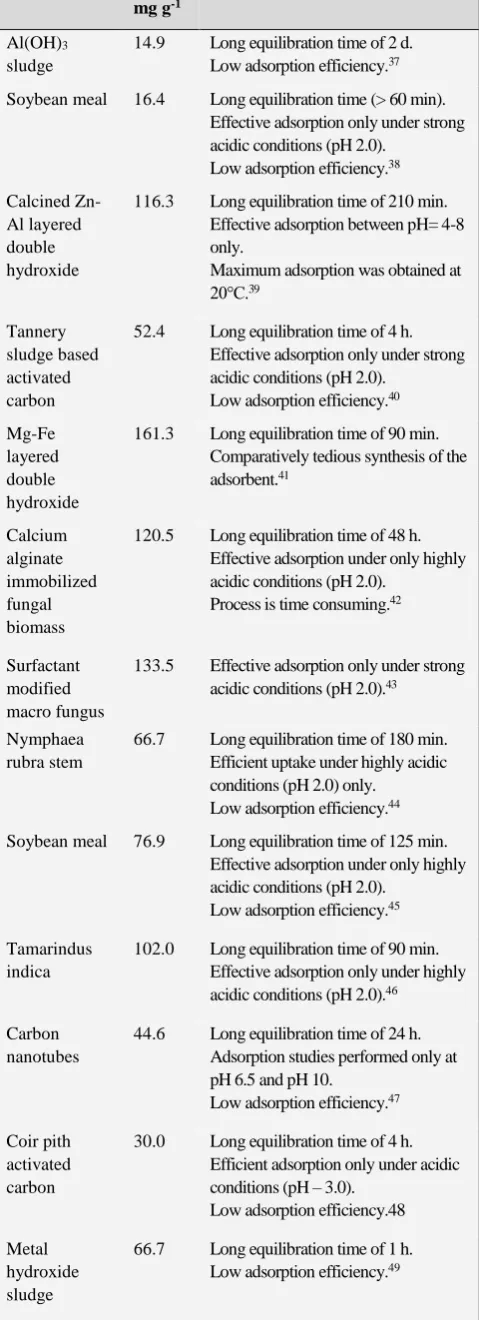
The qmax values for the adsorption of Reactive red 2 dye
on the adsorbents used in the present study listed in table 1 are compared in table 2 with the corresponding values for other adsorbents reported in the literature for this dye. As can be seen, the adsorption efficiency of organophilic clays towards Reactive red 2 dye is found to be relatively high in comparison to most of the adsorbents reported in the literature recently except few. Mg-Fe layered double hydroxide shows higher monolayer adsorption capacity but this efficiency was attained at relatively longer equilibration time (90 minutes) and the synthesis of the adsorbent is comparatively tedious in comparison to the present adsorption system.
Calcium alginate immobilized fungal biomass shows slightly more monolayer adsorption efficiency but the processing of the adsorbent is time consuming as is the case with biological treatment processes. Moreover, the equilibration is achieved in 2 days and effective adsorption takes place under highly acidic conditions.
Table 2.qmax values reported in the literature for the adsorption of RR2 dye
Isotherm Parameters Adsorbents CP-Mt CTA-Mt Mt
Langmuir KL, dm3 mg-1 7.7883 1.8628 -0.02099
qmax, mg g-1 93.721 111.61 2.853
RL 0.00046 0.0019 -0.2049
R2 0.9995 0.9994 0.9010
Freund-lich
KF, mg g-1
(dm3mg-1/n)
59.73 54.11 11.324
1/n 0.1557 0.2648 -0.1702
R2 0.5662 0.7829 0.2997 Temkin A,dm3 mg-1 1162 39.35 3.76×10⁻⁷
B 9.5778 16.8905 -0.5326
R2 0.6126 0.8463 0.1804 e
= ln + ln
eEur. Chem. Bull., 2014, 3(8), 838-849 DOI: 10.17628/ECB.2014.3.838
845
Adsorbent qmaxmg g-1
Limitations
Al(OH)3 sludge
14.9 Long equilibration time of 2 d. Low adsorption efficiency.37 Soybean meal 16.4 Long equilibration time (> 60 min).
Effective adsorption only under strong acidic conditions (pH 2.0).
Low adsorption efficiency.38 Calcined
Zn-Al layered double hydroxide
116.3 Long equilibration time of 210 min. Effective adsorption between pH= 4-8 only.
Maximum adsorption was obtained at 20°C.39
Tannery sludge based activated carbon
52.4 Long equilibration time of 4 h. Effective adsorption only under strong acidic conditions (pH 2.0).
Low adsorption efficiency.40 Mg-Fe
layered double hydroxide
161.3 Long equilibration time of 90 min. Comparatively tedious synthesis of the adsorbent.41 Calcium alginate immobilized fungal biomass
120.5 Long equilibration time of 48 h. Effective adsorption under only highly acidic conditions (pH 2.0).
Process is time consuming.42
Surfactant modified macro fungus
133.5 Effective adsorption only under strong acidic conditions (pH 2.0).43
Nymphaea rubra stem
66.7 Long equilibration time of 180 min. Efficient uptake under highly acidic conditions (pH 2.0) only.
Low adsorption efficiency.44 Soybean meal 76.9 Long equilibration time of 125 min.
Effective adsorption under only highly acidic conditions (pH 2.0).
Low adsorption efficiency.45 Tamarindus
indica
102.0 Long equilibration time of 90 min. Effective adsorption only under highly acidic conditions (pH 2.0).46
Carbon nanotubes
44.6 Long equilibration time of 24 h. Adsorption studies performed only at pH 6.5 and pH 10.
Low adsorption efficiency.47 Coir pith
activated carbon
30.0 Long equilibration time of 4 h. Efficient adsorption only under acidic conditions (pH – 3.0).
Low adsorption efficiency.48
Metal hydroxide sludge
66.7 Long equilibration time of 1 h. Low adsorption efficiency.49
Zn-Al calcined layered double hydroxide as adsorbent showed slightly higher uptake but it was achieved at a longer equilibration time (210 min) and the process was
found to be pH and temperature dependent. Surfactant modified macro fungus as an adsorbent is highly pH dependent as it is found to be efficient only under highly acidic conditions (pH=2.0). This is in comparison to the present adsorption system wherein the process was found to be nearly pH independent for organophilic clays in the entire experimental pH range (pH=2-10) studied and the equilibrium was attained within 10 minutes of the contact time.
Kinetic modelling
The kinetics of RR2 dye removal was carried out to understand the dye adsorption behaviour on the three adsorbents with respect to concentration. Since Mt did not show appreciable dye removal, therefore the kinetic studies were performed with the organophilic clays. To evaluate the mechanism of the adsorption process, pseudo first order, second order and intraparticle diffusion models were applied to the experimental data.
Pseudo-first-order kinetic model
The pseudo-first-order kinetic model known as the Lagergern equation can be represented in the linear form50,51
as:
(7)
where,
qe and qt relate to the amounts of dye (mg g-1)
adsorbed at equilibrium and at a time t (min), respectively and
k1 (min−1) is the equilibrium rate constant of the
pseudo-first-order adsorption process.
Figure 12. Pseudo-first order kinetic plot for dye adsorption
The pseudo first order rate constants and correlation coefficients were calculated from the plot of log(qe−qt)
versus t (Fig. 12) and are given in Table 3.
e 1 e t
log( - ) log( - ) =
2.303 q k
q q t
0
10
20
30
40
50
60
0.0
0.5
1.0
1.5
2.0
2.5
t /q t (min g/mg)Time(min)
50 ppm CPC-MMT
100 ppm CPC-MMT
160 ppm CPC-MMT
50 ppm CTAB-MMT
100 ppm CTAB-MMT
160 ppm CTAB-MMT
50 mg/dm3
0 10 20 30 40 50 60
0.0 0.5 1.0 1.5 2.0 2.5
t/q
t(min g/mg)
Time(min)
50 ppm CPC-MMT 100 ppm CPC-MMT 160 ppm CPC-MMT 50 ppm CTAB-MMT 100 ppm CTAB-MMT 160 ppm CTAB-MMT
100 mg/dm3
0
10
20
30
40
50
60
0.0
0.5
1.0
1.5
2.0
2.5
t/q
t(min g/mg)
Time(min)
50 ppm CPC-MMT
100 ppm CPC-MMT
160 ppm CPC-MMT
50 ppm CTAB-MMT
100 ppm CTAB-MMT
160 ppm CTAB-MMT
Eur. Chem. Bull., 2014, 3(8), 838-849 DOI: 10.17628/ECB.2014.3.838
846
The correlation coefficients, R2 obtainedfor pseudo first
order kinetic model were found to be very low. The calculated qe values for all dye concentrations obtained from
the first-order kinetic model do not give reasonable values, which are low compared with experimental qe values. Thus
pseudo first-order kinetic model of Lagergren does not fit well to the adsorption data.
Table 3. Pseudo first order kinetic parameters for dye adsorption
Adsor-bent
Dye conc. mg dm-3
qe(exp)
mg g-1
Parameters
k1,
min-1
qe,
cal mg g-1
R2
CP-Mt 50 25.0000 0.0016 0.4313 0.0318 100 49.7071 0.0083 1.9098 0.3445 160 79.7191 0.0084 2.0202 0.3791
CTA-Mt
50 24.7300 0.0950 4.9499 0.8697 100 49.6244 0.0325 1.6196 0.7565 160 79.2378 0.0203 0.9663 0.4851
Pseudo-second-order kinetic model
The pseudo-second-order model is based on the assumption that the rate-limiting step is chemical adsorption involving valance force through sharing or exchange of electrons between adsorbent and adsorbate.52,53
The linear form of the pseudo-second-order kinetic model can be represented as:
(8)
where,
k2 is the equilibrium rate constant [g (mg-1 min-1)] for
the pseudo-second-order adsorption process.
If the initial adsorption rate is h = k2qe2, then the above
equation becomes
(9)
Employing this equation and plotting t/qt versus t gives a
straight line of slope 1/qe and intercept 1/k2qe2.54
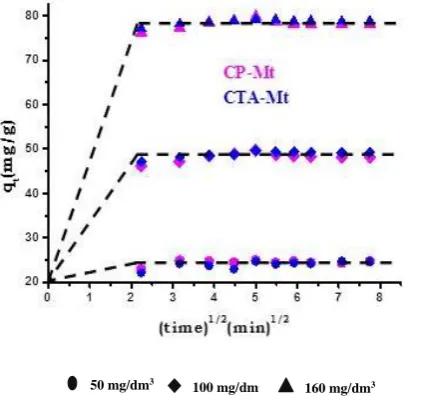
Fig.13 shows the applicability of the pseudo-second-order kinetic model to the experimental data generated for the adsorptive removal of dye from aqueous solution.
Figure 13. Pseudo-second order kinetic plot for dye adsorption
The pseudo-second-order rate constant k2, initial
adsorption rate h, amount of the dye adsorbed at equilibrium qe and the corresponding linear regression coefficients R2
are given in Table 4. It was observed that an increase in the initial dye concentration caused an increase in the equilibrium adsorption capacity, qe with both the adsorbents but reduced the
sorption rate, k2 in case of CP-Mt. However, in case of
CTA-Mt, an increase in the sorption rate, k2 and a decrease in the
initial adsorption rate, h was observed with an increase in the initial dye concentration. The calculated qe values agreed well
with the experimental qe values. The values of R2 obtained were
all greater than 0.999, which is much higher than the R2 values
obtained for pseudo first order kinetic model. The results show that the adsorption system studied fit with the pseudo-second-order kinetic model for the entire adsorption period. The higher values of R2 and the calculated values of equilibrium sorption
capacity, qe, which is very much in agreement with
experimental data for all initial dye concentrations, confirms that the adsorption process follows a pseudo-second order mechanism suggesting that chemisorption might be the rate limiting step that controlled the adsorption process.13
Figure 14. Intraparticle diffusion plot for dye adsorption
Table 4. Pseudo second order kinetic parameters for dye adsorption
2 t 2 e e
1 1
= +
t
t
q k q q
t e
1 1 = + t
t
q h q
0
10
20
30
40
50
60
0.0
0.5
1.0
1.5
2.0
2.5
t /q t (min g/mg)50 ppm CPC-MMT
100 ppm CPC-MMT
160 ppm CPC-MMT
50 ppm CTAB-MMT
100 ppm CTAB-MMT
160 ppm CTAB-MMT
0 10 20 30 40 50 60
0.0 0.5 1.0 1.5 2.0 2.5
t/q
t(min g/mg)
Time(min)
50 ppm CPC-MMT 100 ppm CPC-MMT 160 ppm CPC-MMT 50 ppm CTAB-MMT 100 ppm CTAB-MMT 160 ppm CTAB-MMT
0
10
20
30
40
50
60
0.0
0.5
1.0
1.5
2.0
2.5
t/q
t(min g/mg)
Time(min)
50 ppm CPC-MMT
100 ppm CPC-MMT
160 ppm CPC-MMT
50 ppm CTAB-MMT
100 ppm CTAB-MMT
160 ppm CTAB-MMT
0
10
20
30
40
50
60
0.0
0.5
1.0
1.5
2.0
2.5
t /q t (min g/mg)Time(min)
50 ppm CPC-MMT
100 ppm CPC-MMT
160 ppm CPC-MMT
50 ppm CTAB-MMT
100 ppm CTAB-MMT
160 ppm CTAB-MMT
50 mg/dm3
0 10 20 30 40 50 60
0.0 0.5 1.0 1.5 2.0 2.5
t/q
t(min g/mg)
Time(min)
50 ppm CPC-MMT 100 ppm CPC-MMT 160 ppm CPC-MMT 50 ppm CTAB-MMT 100 ppm CTAB-MMT 160 ppm CTAB-MMT
100 mg/dm3
0
10
20
30
40
50
60
0.0
0.5
1.0
1.5
2.0
2.5
t/q
t(min g/mg)
Time(min)
50 ppm CPC-MMT
100 ppm CPC-MMT
160 ppm CPC-MMT
50 ppm CTAB-MMT
100 ppm CTAB-MMT
160 ppm CTAB-MMT
Eur. Chem. Bull., 2014, 3(8), 838-849 DOI: 10.17628/ECB.2014.3.838
847
Intraparticle diffusion modelAccording to the intraparticle diffusion model proposed by Weber and Morris,55 the initial rate of intraparticle
diffusion is given by the equation:
1/2 t= i +
q k t C (10)
where,
ki is the intraparticle diffusion rate constant, mg g-1
min-1/2,
t is the time (min) and C is the intercept.
According to this model, a plot of qt versus t1/2 should be
linear if intraparticle diffusion is involved in the adsorption process and if the plot passes through the origin then intraparticle diffusion is the sole rate-limiting step.56 It has
also been suggested that in instances when qt versus t1/2 is
multilinear two or more steps govern the adsorption process.57 As the plots of q
t versus t1/2 in the present case are
linear (Fig. 14), it suggests that intraparticle diffusion is involved in adsorption but since the plots did not pass through the origin, it is indicative of the fact that intraparticle diffusion was not the rate-limiting step in the present adsorption process. The values of constant C and ki
along with regression coefficient are listed in Table 5.
Table 5. Intraparticle diffusion kinetic parameters for dye adsorption
Mechanism of RR2 dye adsorption on organophilic clays
Since the organic cations loading was found to be in excess of the cation exchange capacity of the clay (~1.3 times the CEC of the clay), therefore after complete exchange with the interlayer ions, the excess of the organic cation gets adsorbed on the clay surface in a bilayer arrangement making the clay surface positively charged. The reactive red 2 dye on being dissolved in aqueous medium becomes negatively charged because of the presence of two sulphonic acid groups. When the organophilic clay is added to this aqueous dye solution, the negatively charged dye ions are electrostatically attracted to the positively charged head groups of the organic cations adsorbed on the surface of the clay thereby removing the dye from the aqueous solution (Fig.15). Thus the clay is acting as a host material for localizing the organic cations on its surface.
Figure 15. Diagrammatic representation of adsorption of anionic dye on organophilic Mt clay
CONCLUSION
Adsorbent Dye conc., mg dm-3 qe (exp) mg g-1 Parameters
k2, g mg-1 min-1 h, mg g-1min-1 qe, cal mg g-1 R2
CP-Mt 50 25.0000 0.6060 1.6502 24.6310 0.9999
100 49.7071 0.2556 3.9129 48.2625 0.9999
160 79.7191 0.3353 2.9819 78.2473 0.9995
CTA-Mt 50 24.7300 0.0521 19.213 24.9626 0.9997
100 49.6244 0.1146 8.7227 49.4315 0.9999
160 79.2378 0.3536 2.8284 78.9266 0.9999
Ad- sor-bent
Dye conc. mg dm-3
Parameters
ki,
mg g-1 min-1/2
C,
mg g-1
R2
CP-Mt
50 0.1422 23.7428 0.4206 100 0.2696 46.8426 0.4812 160 0.2649 76.8194 0.4827 CTA
-Mt
The adsorptive removal of Reactive red 2 dye was studied using Mt, CP-Mt and CTA-Mt. The results of the present investigation show that the dye adsorption by organophilic clays remains almost independent of the pH of the aqueous dye solution in comparison to Mt. The equilibrium was established within 10 minutes of the contact time in case of organophilic clays. The adsorption process was found to be extremely rapid in case of organophilic clays with over 99% of the dye (initial concentration of 50 mg/dm3) being
removed in the first 10 minutes of the contact time suggesting very active surface phenomenon of these adsorbents. On the other hand, the dye adsorption efficiency of Mt was found to be very low as compared to the organophilic clays. The experimental adsorption equilibrium data obtained for all the adsorbate-adsorbent systems were tested for Langmuir, Freundlich and Temkin adsorption isotherm models. The Langmuir model provided a better fit than the others suggesting monolayer coverage of the dye on the surface of the adsorbents. The Langmuir monolayer adsorption capacity of Mt, CP-Mt and CTA-Mt for the dye was found to be 2.85, 93.72 and 111.61 mg g-1, respectively.
Three adsorption kinetic models pseudo first, pseudo second order and intraparticle diffusion models were applied to investigate the mechanism of adsorption. It was found that the intercept of the pseudo first order plot did not equal qe and the magnitude of the correlation coefficient were
quite low indicating that the reaction is not likely to be first order. The intraparticle diffusion kinetic model demonstrated linear plots but did not pass through origin suggesting that intraparticle diffusion is not the only rate controlling step, but also other kinetic processes may control the rate of adsorption, all of which may be operating simultaneously. However, low correlation coefficients were obtained suggesting the inapplicability of this model to the present adsorption system. Application of the pseudo second order kinetic model to the experimental data within the time range of adsorption showed high correlation coefficient all nearing 1.0 and the qe values obtained were close to the
experimental qe values. These findings suggest that the
pseudo second order mechanism is predominant and chemisorption may be the rate limiting step that controls the adsorption process.
ACKNOWLEDGEMENT
The authors are grateful to the Head of the Department of Chemistry and the Director of the University Science Instrumentation Centre of the University of Delhi for providing the necessary laboratory facilities and financial support.
REFERENCES
1Chatterjee, D., Patnam, V. R., Sikdar, A., Misra, P. R., Rao, N. N., J. Hazard. Mater.,2008, 156, 435-441.
2Akkaya, G., Uzun, I., Güzel, F., Dyes Pigm.,2007, 73, 168-177. 3Zollinger, H., Color Chemistry: Synthesis, Properties and
Applications of Organic Dyes and Pigments. 2nd Ed., VCH Publishers, New York, 1991.
4Rys, P., Zollinger, H., The Theory of Coloration of Textiles. Johnston, A., ed., Society of Textile Dyers and Colorists, West Yorkshire, England, 1989.
5Xu, Z. Y., Zhang, Q. X., Fang, H. H. P., Crit. Rev. Environ. Sci.
Technol.,2003, 33, 363-389.
6Mahlok, J. L., Shindala, A. M., Griff, E. C., Barnett, W. A., Am.
Dye Stuff Report,1975, 64, 24–46.
7Horning, R. H., Tex. Chem. Colourists,1977, 9, 24–27.
8Konduru, R., Ramakrishna, K. R., Viraraghavan, T., Water Sci.
Technol.,1997, 36, 189–196.
9El Guendi, M. S., Adsorpt. Sci. Technol.,1995, 13, 295–303. 10Mc Kay, G., Allen, S. J., Can. Chem. Eng.,1980, J58, 521–525. 11Raghavacharya, C., Chem. Eng. World,1997, 32, 53–58. 12Orthman, J., Zhu, H. Y., Lu, G. Q., Sep. Purif. Technol.,2003, 31,
53.
13Ozacar, M., Sengil, I. A., J. Hazard. Mater.,2003, B98, 211. 14Shen, Y. H., Chemosphere, 2001, 44, 989.
15Kim, J. H., Shin, W. S., Kim, Y. H., Choi, S. J., Jeon, Y. W., Song, D. I., Water Sci. Technol.,2003, 47, 59.
16Prost, R., Yaron, B., Soil Sci.,2001, 166, 880.
17Ozacan, A. S., Ozcan, A., J. Colloid Interface Sci.,2004, 276, 39. 18Juang, R. S., Lin, S. H., Tsao, K. H., J. Colloid Interface Sci.,
2002, 254, 234.
19Wolfe, T. A., Demirel, T., Baumann, E. R., Clays Clay Miner.,
1985, 33, 301–307.
20Smith, J. A., Galan, A., Environ. Sci. Technol.,1995, 29, 685– 692.
21Klumpp, E., Contreras-Ortega, C., Klahre, P., Tino, F. J., Yapar, S., Portillo, C., Stegen, S., Queirolo, F., Schwuger, M. J., Colloids Surf. A: Physicochem. Eng. Aspects, 2003,
230, 111–116.
22Kahr, G., Madsen, F. T., Appl. Clay Sci.,1995, 9, 327-336. 23He, H., Zhou, Q., Frost, R. L., Wood, B. J., Duong, L. V.,
Kloprogge, J. T., Spectrochim. Acta,2007, 66, 1180. 24Xiao, J., Hu, Y., Wang, Z., Tang, Y., Chen, Z., Fan, W., Eur.
Polym.,2005, J41, 1030.
25Bukka, K., Miller, J. D., Clays Clay Miner.,1992, 40, 92-102. 26Kaur, M., Datta, M., Adsorpt. Sci. Technol., 2011, 29, 306-307. 27Guangming, C., Suhuai, L., Shijuan, C., Zongneng, Q., Macromol.
Chem. Phys., 2001, 202, 1189–1193.
28Kungt, K. S., Hayes, K. F., Langmuir, 1993, 9, 263-267.
29Kusmierek, E., Chrzescijanska, E., Szadkowska-Nicze, M., Kaluzna-Czaplinska, J., J. Appl. Electrochem., 2011, 41, 51-62. 30Nagy, N. M., Kónya, J., Appl. Clay Sci., 2004, 25, 57– 69.
31Giles, C. H., MacEwan, T. H., Nakhwa, S. N., Smith, D., J.
Chem. Soc.,1960, 11, 3973.
32Baskaralingam, P., Pulikesi, M., Ramamurthi, V., Sivanesan, S.,
J. Hazard. Mater.,2006, B136, 989.
33Zheng, H., Wang, Y., Zheng, Y., Zhang, H., Liang, S., Long, M.,
Chem. Eng. J.,2008, 143, 117–123.
34Treybal, R. E., Mass transfer operations. 2nd ed., McGraw Hill, New York, 1968.
35Hameed, B. H., Mahmoud, D. K., Ahmad, A. L., J. Hazard.
Mater.,2008, 158, 65–72.
36Temkin, M. J., Pyzhev, V., Acta Physiochim USSR, 1940, 12, 217–222.
37Uçar, B., Güvenç, A., Mehmetoğlu, U., Hydrol. Current Res.,
2011, 2, 1-8.
38Peng, N., Wang, K., Proc.Int. Conf. Computer Distributed Control
Eur. Chem. Bull., 2014, 3(8), 838-849 DOI: 10.17628/ECB.2014.3.838
849
40Geethakarthi, A., Phanikumar, B. R., Int. J. Environ. Sci. Tech., 2011,
3, 561-570.
41Zhang, L., Chen, Y., IEEE 978-1-61284-459-6/11, 2011. 42Zhang, L., Wang, M., Adv. Mat. Res., 2011, 213, 432-436. 43Akar, T., Divriklioglu, M., Bioresource Technol., 2010, 101, 7271–
7277.
44Sahadevan, R., Kalpana, J., Kumar, M. D., Velan, M., Clean, 2009,
11, 901– 907.
45Sahadevan, R., Seenuvasan, M., Selvaraj, S., Gautam, P., Velan, M., Chem. Prod. Process Model, 2008, 3, 1-18.
46Sahadevan, R., Kumar, D., Mahendradas, Shanmugasundaram, V., Shanmugam, K., Velan, M., Int. J. Chem. Reactor Eng., 2009,
A33, 1-23.
47Wu, C-H., J. Hazard. Mater., 2007, 144, 93–100.
48Santhy, K., Selvapathy, P., Bioresource Technol., 2006, 97, 1329– 1336.
49Netpradit, S., Thiravetyan, P., Towprayoon, S., J. Colloid Interface
Sci., 2004, 270, 255-261.
50Feng-Chin, W., Ru-Ling, T., Ruey-Shin, J., J. Hazard. Mater.,
2001, B81, 167–177.
51Ho, Y. S., McKay, G., J. Environ. Sci. Health A,1999a, 34, 1179– 1204.
52Ho, Y. S., McKay, G., Process Biochem., 1999, 34, 451–465. 53Ho, Y. S., McKay, G., Process Safety Environ. Prot., 1998, 76,
332–340.
54Ho, Y. S., McKay, G., Water Res.,2004, 34, 735–742.
55Banat, F., Al-Ashed, S., Al-Makhadmeh, L., Process Biochem.,
2003A, 39, 193.
56Senthilkumaar, S., Kalaamani, P., Porkodi, K., Varadarajan, P. R., Subburaam, C. V., Bioresour. Technol.,2006, 14, 1618– 1625.
57McKay, G., Poots, V.J.P., J. Chem. Technol. Biotechnol., 1980, 30, 279–292.