Wireshark® Network Analysis
The Official Wireshark Certified Network Analyst™ Study Guide 2nd Edition (Version 2.1b)
Laura Chappell
Founder, Chappell University™ Founder, Wireshark University™
Readers interested in this book may also be interested in the associated Wireshark Certified Network
Analyst
Official Exam Prep Guide – Second Edition. 10-digit ISBN: 1-893939-90-1
13-digit ISBN: 978-1-893939-90-5
Wireshark® Network Analysis
The Official Wireshark Certified Network Analyst™ Study Guide 2nd Edition (Version 2.1b)
Copyright 2012, Protocol Analysis Institute, Inc, dba Chappell University. All rights reserved. No part of this ebook, or related materials, including interior design, cover design and contents of the referenced book website, www.wiresharkbook.com, may be reproduced or transmitted in any form, by any means (electronic, photocopying, recording or otherwise) without the prior written permission of the publisher.
To arrange bulk purchase discounts for sales promotions, events, training courses, or other purposes, please contact Chappell University at the address listed on the next page.
Book URL: www.wiresharkbook.com
Paperback Book 13-digit ISBN: 978-1-893939-94-3 Paperback Book 10-digit ISBN: 1-893939-94-4
Distributed worldwide for Chappell University through Protocol Analysis Institute, Inc.
For general information on Chappell University or Protocol Analysis Institute, Inc, including information on corporate licenses, updates, future titles or courses, contact the Protocol Analysis Institute, Inc at 408/378-7841 or send email to [email protected].
For authorization to photocopy items for corporate, personal or educational use, contact Protocol Analysis Institute, Inc at email to [email protected].
Trademarks. All brand names and product names used in this book or mentioned in this course are trade
exclusive developer for Chappell University.
Limit of Liability/Disclaimer of Warranty. The author and publisher have used their best efforts in
preparing this book and the related materials used in this book. Protocol Analysis Institute, Inc, Chappell University and the author(s) make no representations or warranties or merchantability or fitness for a
particular purpose. Protocol Analysis Institute, Inc and Chappell University assume no liability for any damages caused by following instructions or using the techniques or tools listed in this book or related materials used in this book. Protocol Analysis Institute, Inc, Chappell University and the author(s) make no representations or warranties that extend beyond the descriptions contained in this paragraph. No warranty may be created or extended by sales representatives or written sales materials. The accuracy or completeness of the information provided herein and the opinions stated herein are not guaranteed or warranted to produce any particular result and the advice and strategies contained herein may not be suitable for every individual. Protocol Analysis Institute, Inc, Chappell University and author(s) shall not be liable for any loss of profit or any other commercial damages, including without limitation special, incidental, consequential, or other damages.
Always ensure you have proper authorization before you listen to and capture network traffic. Copy Protection. In all cases, reselling or duplication of this book and related materials used in this training
course without explicit written authorization is expressly forbidden. We will find you, ya know. So don’t steal it or plagiarize this book.
This book and the book website, www.wiresharkbook.com, references Chanalyzer Pro software created by MetaGeek (www.metageek.net/wiresharkbook).
This book and the book website, www.wiresharkbook.com, references GeoLite data created by MaxMind, available from www.maxmind.com.
PhoneFactor™ SSL/TLS vulnerabilities documents and trace files referenced on the book website, www.wiresharkbook.com, were created by Steve Dispensa and Ray Marsh (www.phonefactor.com). This book and the book website, www.wiresharkbook.com, references trace files from Mu Dynamics (www.pcapr.net).
This book references rules released by Emerging Threats Copyright © 2003-2012, Emerging Threats. All rights reserved. For more information, visit emergingthreats.net.
Protocol Analysis Institute, Inc. 5339 Prospect Road, # 343 San Jose, CA 95129 USA www.wiresharkbook.com
Also refer to Chappell University at the same address [email protected]
www.chappellU.com
Cover: Fractal image, Waves Envisioned during Late Nights at Work, by Scott Spicer Created with Apophysis 2.09
Dedication
This Second Edition is dedicated to Gerald Combs, creator of Wireshark (formerly Ethereal) and a good friend. Twelve years ago, I sent Gerald a note—just out of the blue—"may I include Ethereal on my CD? I want to give it away at conferences." Expecting some pushback—after all, he didn’t know who the heck I was—I was amazed and thrilled to receive his response stating "sure, go ahead—that would be great!"
Gerald is more than the creator of Wireshark. Gerald is one of us. He struggled with a problem. He formulated a solution. Then he did something extraordinary—he shared his solution with the world. In his typical unselfish mode, Gerald opened up his project for the contribution and participation of others.
Ethereal morphed into Wireshark, and Wireshark continued to mature. Wireshark has surpassed every other network analyzer product in the industry to become the de facto standard for network traffic analysis.
In 2011 Wireshark was voted the #1 Security Tool on the SecTools.org Top 125 Network Security Tools survey (conducted by Gordon Lyons, creator of Nmap). This is a much deserved recognition that Wireshark and packet analysis is a must-have skill for IT security professionals.
professionals in our field.
Thank you Gerald.
p.s. Again I want to express very special thanks to Gerald’s wife, Karen, and their absolutely cute-beyond-belief, I-have-my-Daddy-wrapped-around-my-little-finger, smarty-pants-who-melts-your-heart daughter! Gerald always beams when he talks about you two very special ladies and it is a treat spending time with you both <girl power!>. I am grateful for the love, support and inspiration you have provided Gerald. Your tremendous humor and joie de vivre inspires me!
ACKs
There are many people who were directly and indirectly involved in creating the First and Second Editions of this book.
First and foremost, I would like to thank my children, Scott and Ginny, for your patience, support and humor during the many hours I was huddled over my computer to complete this book. Your words of encouragement really helped me balance work and life during some long days and nights of deadlines. It will be a treat to write that "Cooking Badly" book with you someday!
Mom, Dad, Steve and Joe—ahh… yes, the "fam." You guys have given me so much humorous material for
my presentations! Can’t wait for "take your daughter to work day," Mom!
Special thanks to Brenda Cardinal and Jill Poulsen who have worked with me for over 10 years each—you masochists! I am fortunate to have both of you around to brighten my days and put life in perspective. To Colton Cardinal, who provided humorous distractions, smiles and, giggles—thanks for all the time staring at the clocks during the past year and a half. I feel very fortunate to have the chance to watch you grow up!
Joy DeManty—I’m sure you’re sick of reading this book over and over and over again! I appreciate your keen
eye in reviewing this second edition. Let’s agree on this - no more 1,000 page books!
Lanell Allen—again you really pulled through for us on this project! Your tireless hours of work put into
finding my typos, half-sentences and dangling prepositions (he he) was invaluable. Thank you for taking on this project.
Gerald Combs—what can I say? You have selflessly shared with us a tremendous tool and I am so very
grateful for your devotion to Wireshark. The first and second editions of this book are dedicated to you.
The Wireshark developers—what a group! It has been a pleasure meeting so many of you in person at the
Sharkfest conferences. Your continued efforts to improve and enhance Wireshark have helped so many IT professionals find the root of network issues. Thank you for the many hours you have dedicated to making Wireshark the world’s most popular network analyzer solution! You can find the developer list at Help |
About Wireshark | Authors. I hope this book accurately explains the features you have spent so many
hours implementing. If I missed anything you’d like included in future editions of this book, please let me know.
Gordon "Fyodor" Lyon—the creation of the First Edition of this book was triggered when you released
"Nmap Network Scanning"—an excellent book that every networking person should own. I appreciate your time and effort looking over the network scanning section. I look forward to working with you on some future projects—there are so many possibilities!
Ryan Woodings and Mark Jensen of MetaGeek—it has been a pleasure collaborating with you folks on
ideas and microwave popping methods (g)! It has been a blast showing Wi-Spy/Chanalyzer Pro at conferences and sharing these hot products with the IT community. I look forward to more brainstorming sessions. Special thanks to Trent Cutler for reviewing the WLAN chapter and sending on some great feedback.
Steve Dispensa and Marsh Ray of PhoneFactor (www.phonefactor.com)—thank you both for kindly
allowing me to include your Renegotiating TLS document and trace files at www.wiresharkbook.com. You two did a great job documenting this security issue and your work benefits us all.
Stig Bjørlykke, Wireshark Core Developer—you came up with so many great additions to the First Edition
as the areas that often perplex people helped make this book much more valuable to the readers. We all appreciate your development efforts to make Wireshark such a valuable tool!
Sean Walberg—Thanks for being such a great resource on the VoIP chapter. You really have such a
wonderful talent explaining the inner workings of VoIP communications. I loved your presentation at Sharkfest —funny and geeky at the same time! I appreciate your efforts to clarify the VoIP chapter in this book.
Martin Mathieson, Wireshark Core Developer—I am so grateful for the fixes and tips you provided for
the VoIP chapter and the time you took to explain the duplicate IP address detection feature you added to Wireshark. I appreciate you providing the RFC references to be included and understanding that the readers may be new to VoIP analysis. The time and energy you have put into enhancing Wireshark are a benefit to us all!
Jim Aragon—Thanks so much for your tremendous feedback on the First Edition of this book and providing
the tip on capturing traffic. It’s always great to read your ideas and suggestions and you’ve given me loads of ideas for future tips and training.
Sake Blok, Wireshark Core Developer—Don’t you ever sleep? <g> Thanks for your feedback and
corrections on the First Edition of this book. It’s great having your case study, The Tale of the Missing ARP (in Chapter 16: Analyze Address Resolution Protocol (ARP) Traffic). I really appreciate the changes you made to Wireshark regarding the "field not in use, but existent" issue. Yippie!
Ron Nutter—Hey, buddy! Hard to believe we’ve known each other for a zillion years, eh? Thanks for adding
the Cisco spanning instructions in this Second Edition. I know the readers will appreciate that you shared your tips for setting up an efficient capture with Cisco equipment.
Jeff Carrell—You jumped right in to clean up my messy draft of IPv6 introductory materials. You did a great
job refocusing me to ‘show them the packets.’ No wonder people love your IPv6 classes! Thank so much for helping out over the holidays. I know you were working away on the "Guide to TCP/IP" book and your time is precious these days.
Betty DuBois—Thanks for all your review time and talent—not only on this book project, but also on the
Wireshark University Instructor-Led courses and the WCNA Exam. It’s always great to talk/work with a fellow packet-geekess!
Keith Parsons—Thanks for clarifying the concepts in the WLAN chapter and adding the awesome "To
DS/From DS" graphic and table! You always have great ideas and teaching methods—and you’re truly the "geek toy king" as well!
Anders Broman, Wireshark Core Developer—Thanks for taking the time to look through the VoIP chapter
and ensure the information was accurate and presented clearly. Thank you so much for all your efforts as a Wireshark core developer and making so many of the changes I’ve whined about.
The pcapr Team—I appreciate you allowing me to provide readers with several trace files from your online
repository at www.pcapr.net. Thank you to Mu Dynamics (www.mudynamics.com) for supporting the pcapr.net project.
David Teng—Thanks for your thorough read through of the first edition and the numerous edits and
suggestions you provided. It is difficult to imagine the effort you put into translating this huge book to Chinese, but I do hope to see it in print someday.
My Students—Sincere thanks to the hundreds of thousands of students who have taken my online
training courses, instructor-led courses and self-paced courses over 20 years of teaching. I’ve gotten to know so many of you as friends. Your honest and direct feedback has always helped me hone my training materials (and my jokes).
Gary Lewis—you wild guy, you! If anyone out there needs graphic design services, Gary is the "go to" guy
with a great (and somewhat twisted) sense of humor. Thanks for a great cover design on the First Edition— and a lovely rework of the Second Edition!
Case Study/Tip Submitters—Case studies were submitted from all around the world. Thanks to all of you
who overloaded my email with your Wireshark success stories. The following individuals provided case studies that were included in this book to offer a glimpse into how folks use Wireshark to save time and money.
Robert M. Jim McMahon Ron Nutter Karl R. Mark R. Guy Talbot Delfino L. Tiongco Sean Walberg -Christy Z.
And of course—Finally, I’d like to thank those folks who create lousy applications, cruddy TCP/IP stacks,
scummy operating systems, pathetic interconnecting devices and sad default configurations and the users who bring their muck onto the network— you make life so interesting!
If I’ve missed anyone in this ACK section, I apologize and plead brain-drain at this point!
Contents at a Glance
Chapter 1: The World of Network Analysis Chapter 2: Introduction to Wireshark Chapter 3: Capture Traffic
Chapter 4: Create and Apply Capture Filters Chapter 5: Define Global and Personal Preferences Chapter 6: Colorize Traffic
Chapter 7: Define Time Values and Interpret Summaries Chapter 8: Interpret Basic Trace File Statistics
Chapter 9: Create and Apply Display Filters Chapter 10: Follow Streams and Reassemble Data Chapter 11: Customize Wireshark Profiles
Chapter 12: Annotate, Save, Export and Print Packets Chapter 13: Use Wireshark’s Expert System
Chapter 14: TCP/IP Analysis Overview
Chapter 15: Analyze Domain Name System (DNS) Traffic Chapter 16: Analyze Address Resolution Protocol (ARP) Traffic Chapter 17: Analyze Internet Protocol (IPv4/IPv6) Traffic
Chapter 18: Analyze Internet Control Message Protocol (ICMPv4/ICMPV6) Traffic Chapter 19: Analyze User Datagram Protocol (UDP) Traffic
Chapter 20: Analyze Transmission Control Protocol (TCP) Traffic Chapter 21: Graph IO Rates and TCP Trends
Chapter 22: Analyze Dynamic Host Configuration Protocol (DHCPv4/DHCPv6) Traffic Chapter 23: Analyze Hypertext Transfer Protocol (HTTP) Traffic
Chapter 24: Analyze File Transfer Protocol (FTP) Traffic Chapter 25: Analyze Email Traffic
Chapter 26: Introduction to 802.11 (WLAN) Analysis Chapter 27: Introduction to Voice over IP (VoIP) Analysis Chapter 28: Baseline "Normal" Traffic Patterns
Chapter 29: Find the Top Causes of Performance Problems Chapter 30: Network Forensics Overview
Chapter 31: Detect Network Scanning and Discovery Processes Chapter 32: Analyze Suspect Traffic
Chapter 33: Effective Use of Command Line Tools Appendix A: Resources on the Book Website All Access Pass Training Offer
Table of Contents
Contents at a Glance List of Tips
Wireshark Certified Network Analyst Exam Topics $100 Off All Access Pass (AAP) Online Training Dedication
ACKs
Foreword by Gerald Combs Preface
About This Book
Wireshark Certified Network Analyst™ Program Overview
Chapter 1: The World of Network Analysis
Define Network Analysis Follow an Analysis Example
Walk-Through of a Troubleshooting Session
Walk-Through of a Typical Security Scenario (aka Network Forensics) Understand Security Issues Related to Network Analysis
Overcome the "Needle in the Haystack Issue Review a Checklist of Analysis Tasks
Understand Network Traffic Flows Launch an Analysis Session Case Study: Pruning the "Puke"
Case Study: The "Securely Invisible" Network Summary
Practice What You’ve Learned Review Questions
Answers to Review Questions
Chapter 2: Introduction to Wireshark
Wireshark Creation and Maintenance
Capture Packets on Wired or Wireless Networks Open Various Trace File Types
Understand How Wireshark Processes Packets Use the Start Page
Identify the Nine GUI Elements Navigate Wireshark’s Main Menu Use the Main Toolbar for Efficiency Focus Faster with the Filter Toolbar Make the Wireless Toolbar Visible
Work Faster Using RightClick Functionality Sign Up for the Wireshark Mailing Lists Join ask.wireshark.org!
Know Your Key Resources Get Some Trace Files
Case Study: Detecting Database Death Summary
Practice What You’ve Learned Review Questions
Answers to Review Questions
Chapter 3: Capture Traffic
Know Where to Tap Into the Network Run Wireshark Locally
Capture Traffic on Switched Networks Analyze Routed Networks
Analyze Wireless Networks
Capture at Two Locations (Dual Captures) Select the Right Capture Interface
Capture on Multiple Adapters Simultaneously Interface Details (Windows Only)
Capture Traffic Remotely
Summary
Practice What You’ve Learned Review Questions
Answers to Review Questions
Chapter 4: Create and Apply Capture Filters
The Purpose of Capture Filters Apply a Capture Filter to an Interface Build Your Own Set of Capture Filters Filter by a Protocol
Filter Incoming Connection Attempts
Create MAC/IP Address or Host Name Capture Filters Capture One Application’s Traffic Only
Use Operators to Combine Capture Filters Create Capture Filters to Look for Byte Values Manually Edit the Capture Filters File
Share Capture Filters with Others Case Study: Kerberos UDP to TCP Issue Summary
Practice What You’ve Learned Review Questions
Answers to Review Questions
Chapter 5: Define Global and Personal Preferences
Find Your Configuration Folders Set Global and Personal Configurations Customize Your User Interface Settings Define Your Capture Preferences
Automatically Resolve IP and MAC Names Plot IP Addresses on a World Map with GeoIP Resolve Port Numbers (Transport Name Resolution) Resolve SNMP Information
Configure Filter Expressions Configure Statistics Settings
Define ARP, TCP, HTTP/HTTPS and Other Protocol Settings Configure Protocol Settings with RightClick
Case Study: NonStandard Web Server Setup Summary
Practice What You’ve Learned Review Questions
Answers to Review Questions
Chapter 6: Colorize Traffic
Use Colors to Differentiate Traffic Types Disable One or More Coloring Rules Share and Manage Coloring Rules Identify Why a Packet is a Certain Color
Create a "Butt Ugly" Coloring Rule for HTTP Errors Color Conversations to Distinguish Them
Temporarily Mark Packets of Interest Alter Stream Reassembly Coloring
Case Study: Colorizing SharePoint Connections During Login Summary
Practice What You’ve Learned Review Questions
Chapter 7: Define Time Values and Interpret Summaries
Use Time to Identify Network Problems Send Trace Files Across Time Zones Identify Delays with Time Values Identify Client, Server and Path Delays
View a Summary of Traffic Rates, Packet Sizes and Overall Bytes Transferred Case Study: Time Column Spots Delayed ACKs
Summary
Practice What You’ve Learned Review Questions
Answers to Review Questions
Chapter 8: Interpret Basic Trace File Statistics
Launch Wireshark Statistics
Identify Network Protocols and Applications Protocol Settings Can Affect Your Results Identify the Most Active Conversations List Endpoints and Map Them on the Earth Spot Suspicious Targets with GeoIP
List Conversations or Endpoints for Specific Traffic Types Evaluate Packet Lengths
List All IPv4/IPv6 Addresses in the Traffic List All Destinations in the Traffic
List UDP and TCP Usage Analyze UDP Multicast Streams Graph the Flow of Traffic Gather Your HTTP Statistics Examine All WLAN Statistics
Case Study: Application Analysis: Aptimize Website Accelerator™ Case Study: Finding VoIP Quality Issues
Summary
Practice What You’ve Learned Review Questions
Answers to Review Questions
Chapter 9: Create and Apply Display Filters
Understand the Purpose of Display Filters Create Display Filters Using Auto-Complete Apply Saved Display Filters
Use Expressions for Filter Assistance
Make Display Filters Quickly Using RightClick Filtering Filter on Conversations and Endpoints
Filter on the Protocol Hierarchy Window Understand Display Filter Syntax
Combine Display Filters with Comparison Operators Alter Display Filter Meaning with Parentheses Filter on the Existence of a Field
Filter on Specific Bytes in a Packet Find Key Words in Upper or Lower Case More Interesting Regex Filters
Let Wireshark Catch Display Filter Mistakes Use Display Filter Macros for Complex Filtering Avoid Common Display Filter Mistakes
Manually Edit the dfilters File
Case Study: The Chatty Browser
Case Study: Catching Viruses and Worms Summary
Practice What You’ve Learned Review Questions
Answers to Review Questions
Chapter 10: Follow Streams and Reassemble Data
The Basics of Traffic Reassembly
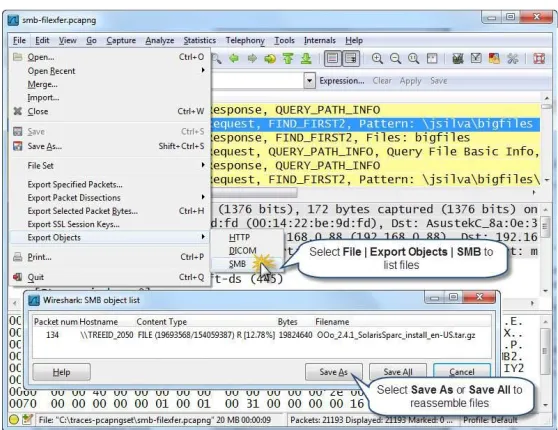
Follow and Reassemble UDP Conversations Follow and Reassemble TCP Conversations Follow and Reassemble SSL Conversations Reassemble an SMB Transfer
Case Study: Unknown Hosts Identified Summary
Practice What You’ve Learned Review Questions
Answers to Review Questions
Chapter 11: Customize Wireshark Profiles
Customize Wireshark with Profiles
Case Study: Customizing Wireshark for the Customer Summary
Practice What You’ve Learned Review Questions
Answers to Review Questions
Chapter 12: Annotate, Save, Export and Print Packets
Annotate a Packet or an Entire Trace File Save Filtered, Marked and Ranges of Packets Export Packet Content for Use in Other Programs Export SSL Keys
Save Conversations, Endpoints, IO Graphs and Flow Graph Information Export Packet Bytes
Case Study: Saving Subsets of Traffic to Isolate Problems Summary
Practice What You’ve Learned Review Questions
Answers to Review Questions
Chapter 13: Use Wireshark’s Expert System
Let Wireshark’s Expert Information Guide You Understand TCP Expert Information
Case Study: Expert Info Catches Remote Access Headaches Summary
Practice What You’ve Learned Review Questions
Answers to Review Questions
Chapter 14: TCP/IP Analysis Overview
TCP/IP Functionality Overview Build the Packet
Practice What You’ve Learned Review Questions
Answers to Review Questions
Chapter 15: Analyze Domain Name System (DNS) Traffic
The Purpose of DNS
Analyze Normal DNS Queries/Responses Analyze DNS Problems
Dissect the DNS Packet Structure Filter on DNS/MDNS Traffic
Case Study: DNS Killed Web Browsing Performance Summary
Practice What You’ve Learned Review Questions
Answers to Review Questions
Chapter 16: Analyze Address Resolution Protocol (ARP) Traffic
Identify the Purpose of ARP
Analyze Normal ARP Requests/Responses Analyze Gratuitous ARPs
Analyze ARP Problems
Dissect the ARP Packet Structure Filter on ARP Traffic
Case Study: Death by ARP
Case Study: The Tale of the Missing ARP Summary
Practice What You’ve Learned Review Questions
Answers to Review Questions
Chapter 17: Analyze Internet Protocol (IPv4/IPv6) Traffic
Identify the Purpose of IP Analyze Normal IPv4 Traffic Analyze IPv4 Problems
Dissect the IPv4 Packet Structure An Introduction to IPv6 Traffic Dissect the IPv6 Packet Structure Basic IPv6 Addressing
Sanitize Your IP Addresses in Trace Files Set Your IPv4 Protocol Preferences Troubleshoot Encrypted Communications Filter on IPv4 Traffic
Filter on IPv6 Traffic
Case Study: Everyone Blamed the Router Case Study: It’s Not the Network’s Problem! Case Study: IPv6 Addressing Mayhem Summary
Practice What You’ve Learned Review Questions
Answers to Review Questions
Chapter 18: Analyze Internet Control Message Protocol (ICMPv4/ICMPV6)
Traffic
Analyze ICMP Problems
Dissect the ICMP Packet Structure Basic ICMPv6 Functionality Filter on ICMP and ICMPv6 Traffic Case Study: The Dead-End Router Summary
Practice What You’ve Learned Review Questions
Answers to Review Questions
Chapter 19: Analyze User Datagram Protocol (UDP) Traffic
The Purpose of UDP Analyze Normal UDP Traffic Analyze UDP Problems
Dissect the UDP Packet Structure Filter on UDP Traffic
Case Study: Troubleshooting Time Synchronization Summary
Practice What You’ve Learned Review Questions
Answers to Review Questions
Chapter 20: Analyze Transmission Control Protocol (TCP) Traffic
The Purpose of TCP
Analyze Normal TCP Communications Analyze TCP Problems
Dissect the TCP Packet Structure Filter on TCP Traffic
Set TCP Protocol Preferences
Case Study: Connections Require Four Attempts Summary
Practice What You’ve Learned Review Questions
Answers to Review Questions
Chapter 21: Graph IO Rates and TCP Trends
Use Graphs to View Trends Generate Basic IO Graphs Filter IO Graphs
Generate Advanced IO Graphs Compare Traffic Trends in IO Graphs Graph Round Trip Time
Graph Throughput Rates
Graph TCP Sequence Numbers over Time Case Study: Watching Performance Levels Drop Case Study: Graphing RTT to the Corporate Office Case Study: Testing QoS Policies
Summary
Practice What You’ve Learned Review Questions
Answers to Review Questions
Chapter 22: Analyze Dynamic Host Configuration Protocol
(DHCPv4/DHCPv6) Traffic
Analyze Normal DHCP Traffic Analyze DHCP Problems
Dissect the DHCP Packet Structure An Introduction to DHCPv6
Display BOOTP-DHCP Statistics Filter on DHCP/DHCPv6 Traffic Case Study: Declining Clients Summary
Practice What You’ve Learned Review Questions
Answers to Review Questions
Chapter 23: Analyze Hypertext Transfer Protocol (HTTP) Traffic
The Purpose of HTTP
Analyze Normal HTTP Communications Analyze HTTP Problems
Dissect HTTP Packet Structures Filter on HTTP or HTTPS Traffic Export HTTP Objects
Display HTTP Statistics Graph HTTP Traffic Flows Set HTTP Preferences
Analyze HTTPS Communications Case Study: HTTP Proxy Problems Summary
Practice What You’ve Learned Review Questions
Answers to Review Questions
Chapter 24: Analyze File Transfer Protocol (FTP) Traffic
The Purpose of FTP
Analyze Normal FTP Communications Analyze FTP Problems
Dissect the FTP Packet Structure Filter on FTP Traffic
Reassemble FTP Traffic
Case Study: Secret FTP Communications Summary
Practice What You’ve Learned Review Questions
Answers to Review Questions
Chapter 25: Analyze Email Traffic
The Purpose of POP
Analyze Normal POP Communications Analyze POP Problems
Dissect the POP Packet Structure Filter on POP Traffic
The Purpose of SMTP
Analyze Normal SMTP Communications Analyze SMTP Problems
Dissect the SMTP Packet Structure Filter on SMTP Traffic
Case Study: SMTP Problem—Scan2Email Job Summary
Review Questions
Answers to Review Questions
Chapter 26: Introduction to 802.11 (WLAN) Analysis
Analyze WLAN Traffic
Analyze Signal Strength and Interference Capture WLAN Traffic
Understand 802.11 Traffic Basics Analyze Normal 802.11 Communications Dissect the 802.11 Frame Structure Filter on All WLAN Traffic
Analyze Frame Control Types and Subtypes Customize Wireshark for WLAN Analysis Case Study: Cruddy Barcode Communications Case Study: Cooking the WLAN
Summary
Practice What You’ve Learned Review Questions
Answers to Review Questions
Chapter 27: Introduction to Voice over IP (VoIP) Analysis
Understand VoIP Traffic Flows
Session Bandwidth and RTP Port Definition Analyze VoIP Problems
Examine SIP Traffic Examine RTP Traffic
Play Back VoIP Conversations RTP Player Marker Definitions Create a VoIP Profile
Filter on VoIP Traffic
Case Study: Lost VoIP Tones Summary
Practice What You’ve Learned Review Questions
Answers to Review Questions
Chapter 28: Baseline "Normal" Traffic Patterns
Understand the Importance of Baselining Case Study: Login Log Jam
Case Study: Solving SAN Disconnects Summary
Practice What You’ve Learned Review Questions
Answers to Review Questions
Chapter 29: Find the Top Causes of Performance Problems
Troubleshoot Performance Problems Identify High Latency Times
Identify Application Faults
Note Any Name Resolution Faults
An Important Note about Analyzing Performance Problems Case Study: One-Way Problems
Case Study: The Perfect Storm of Network Problems Summary
Practice What You’ve Learned Review Questions
Answers to Review Questions
Chapter 30: Network Forensics Overview
Compare Host vs. Network Forensics Gather Evidence
Avoid Detection
Handle Evidence Properly
Recognize Unusual Traffic Patterns Color Unusual Traffic Patterns
Check Out Complementary Forensic Tools Case Study: SSL/TLS Vulnerability Studied Summary
Practice What You’ve Learned Review Questions
Answers to Review Questions
Chapter 31: Detect Network Scanning and Discovery Processes
The Purpose of Discovery and Reconnaissance Processes Detect ARP Scans (aka ARP Sweeps)
Detect ICMP Ping Sweeps
Detect Various Types of TCP Port Scans Detect UDP Port Scans
Detect IP Protocol Scans Understand Idle Scans
Know Your ICMP Types and Codes Try These Nmap Scan Commands Analyze Traceroute Path Discovery Detect Dynamic Router Discovery
Understand Application Mapping Processes Use Wireshark for Passive OS Fingerprinting Detect Active OS Fingerprinting
Identify Attack Tools
Identify Spoofed Addresses in Scans Case Study: Learning the Conficker Lesson Summary
Practice What You’ve Learned Review Questions
Answers to Review Questions
Chapter 32: Analyze Suspect Traffic
What is "Suspect" Traffic?
Identify Vulnerabilities in the TCP/IP Resolution Processes Identify Unacceptable Traffic
Build Filters and Coloring Rules from IDS Rules Case Study: The Flooding Host
Practice What You’ve Learned Review Questions
Answers to Review Questions
Chapter 33: Effective Use of Command Line Tools
Understand the Power of Command-Line Tools Use Wireshark.exe (Command-Line Launch) Capture Traffic with Tshark
List Trace File Details with Capinfos Edit Trace Files with Editcap Merge Trace Files with Mergecap Convert Text with Text2pcap Capture Traffic with Dumpcap Understand Rawshark
Case Study: Getting GETS and a Suspect Summary
Practice What You’ve Learned Review Questions
Answers to Review Questions
Appendix A: Resources on the Book Website
Video Starters
Chanalyzer Pro/Wi-Spy Recordings (.wsx Files) MaxMind GeoIP Database Files (.dat Files)
PhoneFactor SSL/TLS Vulnerabilities Documents/Trace Files Wireshark Customized Profiles
Practice Trace Files
List of Tips
Download the Supplements from www.wiresharkbook.com Wireshark is Constantly Changing
Avoid Prison Time
Get Notified of New Wireshark Releases Access the Wireshark Developer Guide No Interface? No Capture!
Avoid File | Merge Issues Frames vs. Packets
Overloading HTTP Object Export
Use Packet Marking to Identify Interesting Packets Use the Perfect Time Display Format for Troubleshooting Don’t Let Wireshark Flood a DNS Server
Editing Wireshark’s Services File is OK, but… Compare Packets with Side-by-Side Views
Practice Jumping Between Corresponding Packets See Packet Counts Without Capturing Anything Disabling a Protocol May Blind You
Reassemble Streams for Faster Interpretations When Wireshark Doesn’t Recognize RTP Traffic Learn Where Your Wireshark Components Reside The Packet Number Never Changes
Don’t Kill Wireshark Performance Easily Resolve a Single IP Address
Get Notified When New Wireshark Versions are Released Hubs are Only a Half-Duplex Option
Monitor Mode Blocks Other Connectivity
Toggle Capture Interface Information to IPv4 Addresses Experiment with Remote Capture Traffic
Select Multiple Criteria for Capture Stop
Easily Remove Duplicate Packets in Your Capture
Understand Why There are Checksum Errors on YOUR Traffic Only Wireshark Says "Where," but Not Always "Why"
Use Capture Filters Sparingly and Display Filters Generously Avoid host Capture Filters with Web Browsing Sessions
When to Use MAC Capture Filters Instead of IP Address Filters Make Wireshark More Efficient
Add a TCP Window Size Field Column to Spot Problems Be Careful when Hiding Interfaces
Network Name Resolution Can Slow Wireshark to a Crawl Warnings about Using a Special Wireshark hosts File Warnings about SNMP Object Dissection Support
Use New Filter Expression Buttons for Faster Troubleshooting Checksum Validation Settings
Checksum Errors and Coloring Rules
Coloring Rules are Processed in Order Top to Bottom Use Packet Marking to Save Non-Contiguous Packets Handshakes Provide a Nice Snapshot of Latency
Characterize All Protocols and Applications Used by a Host Database Communications are Weird Interesting!
ARP Packets Do Not Match IP Address Filters Use Flow Graphs to Spot Web Browsing Issues Use Your Display Filters in Command Line Capture How to Ensure Your Display Filter is Saved
Understand Wireshark Warnings on Using Add an Inclusion Field with Exclusion Field Filters Consider VLC Player to Play Back Exported Video Files Create from a Master Profile First
Be Careful Sharing Profiles Import Some Profiles
Avoid the "Needle in the Haystack Issue" by Saving Subsets Print Packet Summaries in Landscape Mode
Use Your Own Screen Capture Utility Check out Cascade Pilot™ for Graphing Check Expert Notes AND Warnings Always Double-Check Expert Findings
Use a tcp.analysis.flags Filter Expression Button
What Makes an Item a Warning vs. a Note? When to Consider Trashing a Trace File
Window Update Packets Were Colorized Incorrectly (prior to Wireshark 1.8) Disable Wireshark’s Expert Feature… with Caution
Use the Best TCP Setting for Analyzing HTTP Traffic Quickly Detect DNS Errors
ARP is Local Only
Watch Out for Proxy ARP
Use the IP ID Field to Spot Looping Packets
Microsoft Changed Their IPv6 SLAAC Default Setting IPv6 Address Sanitization
Measure Round Trip Time Using an ICMP Filter You Should Know About Jon Postel
Extending ICMP
FIN Doesn’t Mean "Shut Up" Follow Along with the Trace File
Send Buffers and Application Limitation Issues
The TCP Window Size > Zero Can Still Stop Data Transfer Watch for SYN/ACKs After a Full Handshake
Filter on the TCP Flags Summary Line Watch Out for Altered Options
Watch Out for Bytes in Flight Values During SACK Use Wireshark's TCP Timestamp for Troubleshooting Empty Graphs May Indicate You Selected the Wrong Packet Red is Bad, Green is Good—Using Color Assumptions Consider Using a Logarithmic Scale on Your IO Graph Use the IO Graph to Prioritize Your Troubleshooting Focus Understand and Plot TCP Packet Loss Recovery Processes Use Capinfos –S Setting to Time-Shift Trace Files
Screen Capture those TCP Time-Sequence Graphs The Time-Sequence Graph Reigns Supreme Using tcp.analysis.rtt vs. tcp.time_delta
Disable Stream Reassembly to See HTTP More Clearly Watch Out For Cache-Loaded Web Pages
Don’t Troubleshoot Large Delays before FIN or Reset Packets Don’t Use the http Filter to Analyze Web Browsing
Create a Flow Graph to Spot Web Site Dependencies Follow Along with an HTTPS Handshake Analysis Delays Before Encrypted Alerts May be OK Is There a Worm in the Trace File?
Rule Out the Wired Network to Point to the WLAN Get Help Setting Up WLAN Capture
The Missing Details Button
Let Wireshark Resolve WLAN Decryption Key Conflicts Put Most Often Used Decryption Keys on Top of the Key List Use a Radiotap or PPI Header to Filter on WLAN Channels Translate WLAN Type/Subtype Values to Hex for Easy Filtering Filter on a Conversation Before Sorting the Time Column Beware of frame.time_delta_displayed
Use Packet Marking to Speed Up Your Troubleshooting Use a tcp.len Column to Easily See Payload Size
4 NOPS Expert Warning
Use Nmap on Your Network (with Permission) Watch for Microsoft-Limited Connection Attempts Don’t Create a Black Hole
Generate Your HTTP UserAgent Value You Need to Order the Nmap Book… Now! Anyone Can Spoof a MAC Address!
Filter on Upper OR Lower Case Characters Filter on the Macof Signature
Catch the Traffic When You Run Malicious Tools Add Wireshark to Your Path
View Numerous Statistics with One Tshark Command Line Use Editcap to Split a Large Trace into File Sets
Merge Traces to Compare Them Side by Side in an IO Graph
Foreword by Gerald Combs, Creator of Wireshark
Wireshark was created to answer a question: "What's on my network?"
fundamental level. That's why it's important for you (yes, you!) to be well-versed in protocol analysis. Fortunately there's help.
Wireshark has a large ecosystem of users, developers, educators, and companies dedicated to finding out exactly what's happening on the network. Professionals in every branch of networking have contributed code and ideas to Wireshark to make it work better in their environment. I am continually amazed by their talent, wisdom, and skill.
Laura is a vital part of this ecosystem. She is the best instructor I've ever met. Each time I've had the
opportunity to see her teach I've been impressed with her ability to convey the most arcane technical details in an easy-going, down-to-earth way. She has a unique talent for making protocol analysis accessible and fun. This book reflects her knack for presenting packet analysis in an accessible way while at the same time inspiring the excitement and thrill of discovery from finding out how your network really works. It's also comprehensive, which is readily apparent if you try to lift a paper copy.
My heartfelt thanks go to Laura for her integral part in building Wireshark's user community and for being such a great friend.
Preface
Wireshark is a FIRST RESPONDER tool that should be employed immediately when the cries of "the network is slow" or "I think my computer is infected" echo through the company halls.
In the first case, you are using Wireshark to quickly identify the cause of performance issues. In the second case you are using network forensics to look for evidence of a security breach. In both cases you are looking for signatures in the traffic or packets—the ultimate purpose being isolation of unusual or unacceptable patterns.
I’ve used the phrase "the packets never lie" for years now. It is true.
Twenty years ago I presented a session on ARCnet communications to a group of peer instructors. I delved into the idea of packet structure and the mythical belief at that time that everyone cared. Somehow though, I related the ARCnet networking rules and limitations to Sister Gerald, the militant no-nonsense nun who was the head of discipline at my Catholic boarding school… and I got a few laughs. Imagine that… networking can be funny!
Now—before you think I’m going to mention any of the other nuns, my techno-challenged father, my WoW-addicted son (go Alliance!), my iPhone toting daughter (who I hope will grow up and make iTunes a less pathetic application) and my Pavlovian response to a trace file filled with hideous communications issues and delicious security flaws—this book is not a breezy stroll through the world of packets.
This book is packed with basic through advanced techniques, tips and tricks to analyze a variety of network types. It is designed to get you from point A to point Z (or perhaps I should say point 0x00 to point 0xFF) as fast as possible with a solid understanding of the processes, protocols, and putrid things that occur under our noses (or under our feet or over our heads).
If you don’t have Wireshark loaded on every computer within reach, stop now! Wireshark is the best
girlfriend/boyfriend, wife/husband, mother/father, sister/brother, dog/cat or lover your network will ever have. Who is always there to listen to you with a patient and understanding silence when you are crying in your latte because the users keep complaining about network performance?
Wireshark!
Who never threatens to fire you if you don’t get those file transfers to occur at ‘acceptable speeds’ before lunch today?
Wireshark!
Who smiles and sits around all day long just waiting for the moment you say "I need help"? Wireshark!
So… it’s time to elevate your copy of Wireshark from "network wallflower" to network powerhouse. It’s time to roll up your sleeves, get rid of the training wheels, put on your helmet and reflective gear, tell everyone to get the hell out of your way, get on that bike—and ride!
By the way—you have no idea how difficult it was to refrain from adding humor (or at least what I call humor) to this book. It crept in at various points—some I left in, most I simply moved aside for a later book that might focus on the humorous side of packet analysis. We will have to wait and see…
Laura Chappell
Founder, Chappell University Founder, Wireshark University
About This Book
Wireshark Network Analysis: the Official Wireshark Certified Network Analyst™ Study Guide—Second Edition offers you a solid foundation in the key skills of network analysis, troubleshooting, optimization and security. By purchasing this book, you have indicated your desire to learn packet-level communications and develop skills necessary to analyze, troubleshoot and secure networks more efficiently and achieve the Wireshark Certified Network Analyst certification.
Download the Supplements from www.wiresharkbook.com
.Each chapter concludes with a "Practice What You’ve Learned" section that references traffic files (trace files), configuration files and other files related to the current chapter. These files are available for download at www.wiresharkbook.com. Before delving into this book, it is recommended that you install the latest version of Wireshark www.wireshark.org[1] and download the trace files from www.wiresharkbook.com. Create a \traces directory on your local system and copy these trace files into that directory.
Who is This Book For?
This book offers an ideal reference for information technologists responsible for key network tasks including: identify poor network performance due to high path latency
locate internetwork devices that drop packets validate optimal configuration of network hosts analyze application functionality and dependencies optimize application behavior for best performance learn how TCP/IP networks function
analyze network capacity before application launch
verify application security during launch, log in and data transfer
identify unusual network traffic indicating potentially compromised hosts studying for the Wireshark Certified Network Analyst Exam
How is This Book Organized?
Chapter 1: The World of Network Analysis explains the key uses of network analysis and provides lists of tasks used for troubleshooting, securing and optimizing network traffic. This chapter also provides insight into the "needle in the haystack issue" that overwhelms many new network analysts.
Chapter 2: Introduction to Wireshark details Wireshark internals, the elements of the Wireshark graphical interface and functions of the Main Menu, Main Toolbar, Filter Toolbar, Wireless Toolbar, and Status Bar. In addition, this chapter offers a list of resources recommended for network analysts.
The next eleven chapters (Chapter 3 through Chapter 13) focus on Wireshark functionality with numerous examples of use and references to trace files available at www.wiresharkbook.com. If you are new to Wireshark, focus on these sections to obtain foundational skills used in later chapters.
Chapter 14 through Chapter 25 concentrate on the key protocols and applications of the TCP/IP suite including ARP, DNS, IPv4/IPv6, TCP, UDP, and ICMPv4/ICMPv6. Identifying or absolving TCP/IP as part of the
troubleshooting process helps isolate the cause of performance issues and locate security holes. In addition, these are the chapters you should focus on if you are troubleshooting DHCP-based configurations or
HTTP/HTTPS sessions.
chapter also provides tips on filtering on specific WLAN traffic. This is an introductory chapter and does not delve deeply into WLAN analysis techniques as such detail would likely require an additional 500 pages. Chapter 27: Introduction to Voice over IP (VoIP) Analysis offers an overview of call setup and voice traffic. In addition, this chapter explains the use of Wireshark’s key VoIP analysis features including RTP stream analysis and call playback. This is also an introductory chapter and does not offer an exhaustive resource on VoIP analysis—that also would require an additional 500 pages.
Chapter 28: Baseline "Normal" Traffic Patterns and Chapter 29: Find the Top Causes of Performance Problems offers details on baselines that should be created before network problems arise and examples of traffic patterns indicating delays along a path, faulty internetworking devices, misconfigured hosts and other issues affecting performance.
Chapter 30 through Chapter 32 focus on the security application of Wireshark including an overview of network forensics and analysis of network discovery processes that often preclude a security breach. In Chapter 31: Detect Network Scanning and Discovery Processes, we used Nmap[2] to generate a variety of scans against a target as we analyzed the signatures of this type of traffic. Chapter 32: Analyze Suspect Traffic examines evidence of compromised hosts and unsecure application traffic.
Chapter 33: Effective Use of Command Line Tools details the use of the command-line tools used to split trace files, alter trace file timestamps, automatically start the GUI version of Wireshark with specific parameters, capture traffic with minimal overhead and merge trace files.
Appendix A: Resources on the Book Website includes a list of all the files available at www.wiresharkbook.com at the time of publication (content may be added over time). This includes a comprehensive list of the trace files that you will use in the "Practice What You’ve Learned" section at the end of each chapter.
How Can I Find Something Fast in This Book?
We know this book is a monster. We don’t want you to wear your fingers to the bone flipping through pages to find the information you desperately need. Download the Second Edition Index/Table of Contents/List of Tips document (PDF) from www.wiresharkbook.com and use the search feature to look for specific terms in the book and quickly locate their page numbers.
What Do Those Icons Mean?
Icons used to denote special information included throughout this book.
Tip, Trick or Technique—examples of using a Wireshark feature for faster problem resolution, isolation of
security flaw or other communication feature—stop and try these tips out!
Case Study—example of how Wireshark was used in the real world (many case studies were submitted by
Wireshark users and developers)—do the problems sound familiar? How would you have attacked the problem? Can you implement some of the steps described?
Nmap Syntax—tips on launching the Nmap scans analyzed in Chapter 31: Detect Network Scanning and
Discovery Processes—the best way to know how an application really functions is to analyze it as it runs. We analyzed Nmap scans and also Aptimize Website Accelerator™ in this book.
Trace File Annotation—This icon is located in Appendix A and indicates that the trace file contains an
annotation. To view the trace file annotation click on the Trace File Annotation button (next to the Expert Info button on the Wireshark Status Bar) or select Statistics | Summary.
Packet Comments— This icon is located in Appendix A and indicates that there is a comment on one or
more packets in the trace file. To view all the packet comments at one time, click the Expert Info button (left side of the Wireshark Status Bar) and select the Packet Comments tab.
Trace Files Used in This Book (.pcapng Format)
You can follow along with trace files used in this book. Many of the figures contain the name of the trace file used in the caption. In addition, the trace files used in each chapter are listed on the chapter title page. All the trace files are defined in Appendix A and available online at www.wiresharkbook.com.
comments contained in those files.
What’s Online at www.wiresharkbook.com?
There are numerous references and resources referred to in this book at www.wiresharkbook.com. These files include:
Hundreds of trace files are referenced in images throughout the book. The entire set of trace files is listed with descriptions in Appendix A.
Chanalyzer recordings (.wsx files) to evaluate RF interference from a pocket jammer and an A/V
transmitter. The list of the Chanalyzer recordings is included in Appendix A. For more information on using Chanalyzer to identify RF interference, refer to Chapter 26: Introduction to 802.11 (WLAN) Analysis and visit www.metageek.net/wiresharkbook.
MaxMind® GeoIP® database files (.dat files) as well as an installation and use video (mp4 format). For more information on GeoIP, refer to Chapter 17: Analyze Internet Protocol (IPv4/IPv6) Traffic and visit www.maxmind.com.
PhoneFactor™ SSL/TLS vulnerabilities documents and trace files created by Steve Dispensa and Ray Marsh from PhoneFactor (see the case study written by Steve Dispensa in Chapter 30: Network Forensics
Overview) and visit www.phonefactor.com.
Wireshark customized profiles created for use on various network types. For more information on using Wireshark profiles, refer to Chapter 11: Customize Wireshark Profiles.
You can download individual sets of files or grab the entire set in ZIP or ISO image format. Please review the usage restrictions on the materials before you use them. Thanks.
Which Version of Wireshark Did You Use to Write This Book?
Wireshark is a moving target—constantly changing and evolving with new features, bug fixes and more dissectors. This book was written using several versions from the Wireshark 1.6 trunk (stable release at the time) and several versions from the Wireshark 1.7 trunk (the development releases leading to Wireshark 1.8). You can live on the bleeding edge and access the development versions at
www.wireshark.org/download/automated or grab the most recent stable release at www.wireshark.org/download.html.
Wireshark was created using the GIMP Toolkit (GTK+). GTK+ offers a toolset for creating graphical interfaces that are cross platform compatible. In most cases the steps shown throughout this book can be used if you are working on *nix or MAC OS X platforms. There are few differences between the Windows version and other Wireshark versions. Most of these differences are due to the GTK+ capabilities on those underlying operating systems.
Which WCNA Exam Version Does This Book Cover?
This book will help you prepare for the WCNA-Exam 100.x and WCNA-Exam 102.x versions. Both exam versions contain questions based on the 33 sections of this book. For more information on exam topics and requirements, visit www.wiresharktraining.com.
How Can I Submit Comments/Change Requests for This Book?
Wireshark is a "moving target" because it is updated often. The 1.6 version of Wireshark went through ten release versions from June 2011 to May 2012 (including the first two release candidate versions). You can view the list of Wireshark release versions at www.wireshark.org/download.html (select your OS version and view the all-versions directory). Periodically you may find information about major functionality changes at www.wiresharkbook.com. In addition, you can provide your comments or change requests for future book editions by sending email to [email protected].
Wireshark Certified Network Analyst™ Program Overview
The Wireshark Certified Network Analyst ("Wireshark CNA") Exam is a globally-available, proctored exam to meet the secure and widely available delivery requirements desired by candidates.[3]
Visit www.wiresharktraining.com for additional information on the Wireshark CNA Certification Program. Questions regarding your Wireshark CNA Certification status may be directed to [email protected]
Why Should I Pursue the Wireshark CNA Certification?
issues.
How Do I Earn the Wireshark CNA Certified Status?
To earn the Wireshark CNA status, you must pass a single exam—the WCNA-100.x Exam or WCNA-102.x Exam. For details on preparing for your exam or booking your exam to be taken at a testing center or online, visit www.wiresharktraining.com/certification.
Upon completion of the Wireshark CNA Certification Exam, an individual will receive a pass/fail score. Candidates who successfully pass the Wireshark CNA Certification Exam will receive their Wireshark CNA Certification Exam certificate and WCNA Portal access details via mail. The Wireshark CNA Certification Exam Confirmation contains the candidate’s certificate, additional information regarding analysis resources and details on maintaining Wireshark CNA status. For more information on the Wireshark CNA program, visit www.wiresharktraining.com/certification.
Questions regarding Wireshark CNA Certification status may be directed to [email protected].
Wireshark CNA Exam Objectives
Each chapter title page in this book provides a list of exam objectives for the Wireshark CNA program. For additional information regarding exam preparation, visit www.wiresharktraining.com.
Wireshark University™ and Wireshark University™
Training Partners
After numerous talks with Gerald Combs, Wireshark University was launched in March 2007.
The goal of Wireshark University is to provide education on how to analyze, troubleshoot, secure and optimize network communications using Wireshark.
Wireshark University is responsible for creating and maintaining the Wireshark Certified Network Analyst Exam and Wireshark Certified Network Analyst Members Program, Wireshark University Certified Training Partner Program, Wireshark University Certified Instructor Program, and the Wireshark University Certified Training Materials.
Currently, Wireshark University courses are offered in instructor-led format throughout the world and in self-paced format through Chappell University (www.chappellU.com).
For more information on Wireshark University, visit www.wiresharktraining.com or send email to [email protected].
Schedule Customized Onsite/Web-Based Training
If you are interested in training a team in a fast, effective, hands-on course environment, contact us directly. Customized courses can be developed and delivered by Laura Chappell. Customized courses are based on your network traffic. Course lengths can run from 2 days to 10 days and even include a web-based delivery option to meet the training needs of geographically dispersed students.
Contact us at [email protected] for more information on scheduling customized training for your organization or visit www.chappellU.com.
Online recorded courses are available (All Access Pass) from Chappell University (www.chappellU.com).
Chapter 1
The World of Network Analysis
Network analysis is the process of listening to and analyzing network traffic. Network analysis offers an insight into network communications to identify performance problems, locate security breaches, analyze application behavior, and perform capacity planning. Network analysis (aka "protocol analysis") is a process used by IT professionals who are responsible for network performance and security.
Whether you are completely new to network analysis or just returning after a hiatus of setting up servers, architecting your company’s security plan, deploying Voice over IP, or jumping through hoops to get WLAN issues fixed… Welcome and welcome back!
Network analysis is not brain surgery. Anyone can analyze network communications. You do, however, need to acquire three basic skills to be a top notch network analyst who can spot the cause of performance problems, evidence of breached hosts, misbehaving applications or the impending overload of the network.
1. A solid understanding of TCP/IP communications 2. Comfort using Wireshark
3. Familiarity with packet structures and typical packet flows
Many of you have probably installed and configured TCP/IP networks—in fact, I imagine many of you have set up hundreds if not thousands of TCP/IP clients and servers. Excellent! You already understand TCP/IP
addressing and realize the role that DNS and DHCP servers play on your network.
From a network analyst’s perspective, you need to understand the purpose of those devices and protocols and how they interact. For example, how exactly does a DHCP server offer an IP address and configuration
information to a DHCP client? What if there is a relay agent in use? What happens when the user’s address lease time expires? How does the user learn the destination IP address when the user wants to reach www.wireshark.org? What happens if the local name server does not have the answer? What happens if the name server is down?
Seeing these processes in action at packet level is a fast way to learn the inner workings of your network. You build your baseline of understanding—the baseline is your foundational knowledge of how the processes are supposed to work.
Network analyzer tools are often referred to as "sniffers" and may be sold or distributed as a hardware-plus-software solution or as a hardware-plus-software-only solution. Wireshark is distributed as an open source hardware-plus-software-only solution, but there are add-on adapters that can enhance Wireshark’s capabilities. The AirPcap adapter from Riverbed Technology[4] is an example of a hardware add-on. The AirPcap adapter is used on Windows hosts running Wireshark to listen in to wireless traffic in Monitor Mode.[5]
Follow an Analysis Example
The typical network analysis session includes several tasks: Capture packets at the appropriate location
Apply filters to focus on traffic of interest Review and identify anomalies in the traffic
You can follow along with the analysis of a web browsing session or watch your own traffic as you browse to www.wireshark.org/download.html to grab the latest copy of Wireshark. Alternately you can open http-wiresharkdownload-slow.pcapng to see how the process works.
This is what you might see in your traffic:
Your system requests the IP address of www.wireshark.org. If your system supports IPv4 and IPv6, you will see two DNS requests—one for the IPv4 (A record) and one for the IPv6 (AAAA record). Hopefully, the DNS server responds with the information you need and then you’re off!
Figure 1. The client requests the Wireshark default page [http-wiresharkdownload-slow.pcapng]
If all goes well up to this point, you will see the HTTP server respond with a 200 OK response and the page download begins. You will see various GET requests sent from your system—you are requesting the style sheets for the page and graphics and other elements required to build the page.
When you click on the Download Wireshark button, your system sends a request for /download.html. Again, you will see traffic related to building that page. Now you click the link to download one of the Wireshark versions listed. Your system may do a DNS query to find the IP address of the download server before making a new TCP connection to that IP address and finally sending a GET request for the Wireshark file as shown in Figure 2.
Figure 2. You request the Wireshark executable [http-wiresharkdownload-slow.pcapng]
You can watch the process as the file is transferred to your local system. It all makes perfect sense. It is all quite logical.
What might you feel like if there is a communications problem however?
You might sit patiently waiting for the download to finish—tapping your fingers ever so irritatingly on your desk. Your eyes may wander… looking for some distraction that will make the time pass more quickly. Waiting… waiting… waiting… until finally you just can’t stand it anymore.
You type a new URL and decide to come back to the www.wireshark.org site later to get the latest copy of Wireshark. The other site loads quickly (oh… yeah… speed is good). You find another open source software package that is on your ‘must have’ list. You begin the download process and are filled with excitement at the thrill of taking charge and grabbing software at blazing speed (after all, your company did pay big money to upgrade that Internet connection)… until…
Your heart sinks…
This is taking waaaaay too long. At this rate you will miss lunch, dinner and potentially your summer vacation! Maybe it’s not www.wireshark.org that’s having the problem. Maybe it’s your WAN link (heaven forbid!) or your network (shivers!) or your DNS server (unthinkable!) or your desktop system (impossible!).
Well? Which is it?
[image:25.612.208.403.325.467.2]Network analysis adds an indispensable tool to the network—just as an x-ray is an indispensable tool to the hospital emergency room.[6]
Network analysis allows us the opportunity to look inside the network communication system. We can pull back the curtains and watch the packets travel back and forth. We can SEE the DNS query being sent out and catch the timely DNS response providing an answer. We can watch our local system send a TCP connection request packet to www.wireshark.org. We can measure how long it takes www.wireshark.org to answer and get a general feel for the round trip time to that site. We proudly beam as our system sends the HTTP GET request for the file—just as a good system should. Then time begins to move slowly as the download appears to "stick" at a specific point. The clock is ticking… and your day just turned ugly.
Well… you’ll just have to look at the packets to know the cause of the problem. You can then point the finger! In the world of finger pointing, it’s only the network analyst’s finger that counts.
In this book we cover several reasons why file transfers slow to a crawl. Let’s get you started right away by looking at a troubleshooting and a security session using Wireshark.
Walk-Through of a Troubleshooting Session
This is based on an actual customer visit where the complaint dealt with poor performance when clients upload files to a server from a branch office to the corporate headquarters. When things were good the upload
process took about 3 minutes. Now the upload process takes from 10 to 15 minutes.
Three IT staffers were gathered to assist with the analysis process: the infrastructure IT manager, the client IT manager and the server IT manager.
Here are the steps involved in isolating the cause of the problem:
Step 1: Plan
We discussed the situation with the IT staff; focused on identifying the best place to start capturing the traffic. This is key to ensuring we would be able to witness the problem. The IT team pointed repeatedly to one user who complained on a regular basis—we’ll call him Mike. We planned to start capturing as close to Mike’s machine as possible. [Reference: Know Where to Tap Into the Network]
Next we had to figure out how best to set up Wireshark for capture. We could not install Wireshark on Mike’s machine and no full-duplex tap was available. Fortunately the customer did have switches that supported port spanning so we decided to connect Wireshark to Mike’s upstream switch and span Mike’s port so we could listen in to the traffic. We ran a test or two to ensure the span command worked properly and we could see Mike’s traffic. [Reference: Set up Port Spanning/Port Mirroring on a Switch]
Step 2: Capture
We began capturing all traffic without any filter in place. We asked Mike to begin performing a file upload to show us the performance issue.
Watching the traffic as we were capturing, we saw numerous packets marked with a black background and red foreground—Bad TCP packets. After Mike finished the painfully slow upload process we stopped capturing and began the analysis process. [Reference: Let Wireshark’s Expert Information Guide You]
Step 3: Analyze
In the trace file we isolated the file upload conversation by looking at the TCP conversations, sorting on the highest byte count and filtering on this conversation. We would focus on this communication first. [Reference: Identify the Most Active Conversations]
We looked at the TCP connection to get a feel for round trip wire latency time—all good here at 65ms. We also looked inside the TCP handshake packets to determine connection capabilities of Mike’s machine and the server. [References: Identify High Latency Times and The Establishment of TCP Connections]
Next we created an IO Graph to see if there were sudden drops in IO rate (we’d want to focus on those first) or if the IO rate was lousy all the way through. It certainly was lousy all the way through with an average around 2.5 Mbps. [Reference: Generate Basic IO Graphs]
Next we examined the Expert Infos window. Over 12% of the traffic was marked as bad for some reason. Out of the 20,000 packets we captured during the test, there were over 1,000 Retransmissions and Fast
Retransmissions. Hundreds of Duplicate ACKs indicate the receiver (the server) noticed much of the packet loss. This is what we would focus on first. [Reference: Understand TCP Expert Information]
original packet and the retransmission. Packet loss had not occurred yet (not surprising as data was being sent from Mike’s system right in front of us to the server and packet loss typically occurs at infrastructure devices— this traffic had only crossed a single switch so far).
When we looked at the retransmissions we noticed that Mike’s machine was resending every packet from the lost packet forward. What? Not an expected recovery if the hosts were using Selective Acknowledgments (SACK). [Reference: Improve Packet Loss Recovery with Selective Acknowledgments]
This is why I recommend looking at the TCP handshake process early in the analysis process—we noticed Mike’s machine indicated it supported this feature, but the server did not. Significant packet loss will have a severe impact on performance without SACK in place. [Reference: The Establishment of TCP Connections] It appears packet loss is the ultimate issue here, but the lousy recovery is making the situation unbearable. We needed to address two questions:
Where is packet loss occurring? Why didn’t the server support SACK?
The client was behaving properly by retransmitting data packets after the server asked for them (Duplicate ACKs). The client IT manager was off the hook.
Since 99.999999% of the time packet loss occurs at an interconnecting device we knew we had to start capturing closer to the server. [Reference: How TCP Recovers from Packet Loss]
Step 4: Repeat
We talked about our findings and decided to set up a Wireshark system just off the server to see what the data upload looked like from that perspective. [Reference: Capture at Two Locations (Dual Captures)]
We spanned the server’s port of that switch and again we began capturing, but this time we applied a capture filter for Mike’s IP address (host x.x.x.x). We asked Mike to repeat the upload process. [Reference: Create MAC/IP Address or Host Name Capture Filters]
We started by looking at the TCP handshake process—what? It appeared that Mike’s handshake packet did not indicate his system supported SACK. Instead we saw an illogical padding in the TCP header options area. This is a sign that a router likely stripped out some information and replaced the information with padding. Since the server believed that Mike couldn’t support SACK, the server would not talk about it. The server was behaving properly in this case.
We spent some time looking through the company’s infrastructure to see which device could have altered the TCP handshake Options field. We captured trace files at different points along the path and eventually found a security device along the path that was removing this option from the handshake. Working with the vendor who supplied the device, we eventually realized it was a feature (bug) that could be resolved with a software update and reconfiguration. [Reference: What Triggers 4 NOPs in a Row?]
We verified that the performance improved substantially after the update and reconfiguration process. We still had packet loss, but the recovery process using SACK made the packet loss almost imperceptible.
Wireshark is Constantly Changing
It was this particular case (presented at Sharkfest 2010) that prompted the Wireshark developers to add an Expert Info warning for "4 NOPS in a row" (the padding that replaced the SACK option). This means that identifying this problem with the current version of Wireshark is much faster.
Walk-Through of a Typical Security Scenario (aka
Network Forensics)
This is based on an actual customer issue prompted by a user who noticed their system was acting strangely— from slow performance to an inability to shut down the machine or place it into hibernate mode.
One IT staffer, Colton, was focused on capturing the traffic to determine the cause of this behavior. Here are the steps involved in isolating the cause of the problem:
Step 1: Plan
Colton decided to capture traffic close to the complaining host, SUSPECT1 to determine if there was any unusual traffic to or from that host. Colton had baselines of normal activity and knew the protocols SUSPECT1 typically used. [Reference: Baseline Protocols and Applications]
Colton did not want to install Wireshark on SUSPECT1 in case the machine was infected with something and the issue went to Court. It’s always best to be unobtrusive during this process. Colton connected a full-duplex tap to SUSPECT1 and connected Wireshark to the tap. Colton set up Wireshark in stealth mode. [References: Use a Test Access Port (TAP) on Full-Duplex Networks and Avoid Detection]
Step 2: Capture
Colton began capturing all traffic without any filter in place. He wanted to see every packet to or from SUSPECT1. [Reference: The Purpose of Capture Filters]
Watching the traffic during the capture process, Colton began to see a huge number of TCP SYN packets to TCP port 135 (NetBIOS Session Service) and port 445 (NetBIOS Directory Service). There also appeared to be some ICMP traffic. [References: Detect Various Types of TCP Port Scans and Know Your ICMP Types and Codes]
While letting Wireshark continue to capture traffic, Colton began the analysis process.
Step 3: Analyze
In the traffic Colton saw SUSPECT1 connect to an outside server on an unusual port (TCP port 18067). [Reference: Catch Unusual Protocols and Applications]
Following that TCP stream, Colton noticed some recognizable commands—USeR, NiCK and JOiN. These commands are used in Internet Relay Chat (IRC) communications although they were not using all caps likely to avoid case-sensitive IDS/firewall detection rules. The fact that the commands were altered
![Figure 1. The client requests the Wireshark default page [http-wiresharkdownload-slow.pcapng]](https://thumb-us.123doks.com/thumbv2/123dok_us/901710.602636/25.612.208.403.325.467/figure-client-requests-wireshark-default-page-wiresharkdownload-pcapng.webp)
![Figure 39. WLAN traffic information includes the SSID and active WLAN hosts[wlan-ipad-start-sleep.pcapng]](https://thumb-us.123doks.com/thumbv2/123dok_us/901710.602636/59.612.212.401.154.292/figure-wlan-traffic-information-includes-ssid-active-pcapng.webp)
![Figure 41. Wireshark graphs out VoIP traffic [voip-extension.pcapng]](https://thumb-us.123doks.com/thumbv2/123dok_us/901710.602636/60.612.208.402.109.247/figure-wireshark-graphs-voip-traffic-voip-extension-pcapng.webp)
![Figure 51. The new Filter Expression preference creates buttons based on display filters[http-download-good.pcapng]](https://thumb-us.123doks.com/thumbv2/123dok_us/901710.602636/64.612.214.404.268.417/figure-filter-expression-preference-creates-buttons-display-download.webp)
![Figure 54. Rightclick functionality offers a faster way to quickly perform certain operations[arp-poison.pcapng]](https://thumb-us.123doks.com/thumbv2/123dok_us/901710.602636/65.612.212.401.431.572/figure-rightclick-functionality-offers-quickly-perform-certain-operations.webp)
![Figure 56. Add columns to the Packet List pane using right click | Apply As Column [http-espn2011.pcapng]](https://thumb-us.123doks.com/thumbv2/123dok_us/901710.602636/66.612.207.401.439.588/figure-columns-packet-list-using-apply-column-pcapng.webp)
![Figure 57. Right click on a column heading to edit its properties [icmp-dest-unreachable.pcapng]](https://thumb-us.123doks.com/thumbv2/123dok_us/901710.602636/67.612.240.374.408.511/figure-right-click-column-heading-properties-unreachable-pcapng.webp)
