A Graph-based Semi-Supervised Learning for Question-Answering
Asli Celikyilmaz EECS Department University of California
at Berkeley Berkeley, CA, 94720
Marcus Thint
Intelligent Systems Research Centre British Telecom (BT Americas)
Jacksonville, FL 32256, USA [email protected]
Zhiheng Huang EECS Department University of California
at Berkeley Berkeley, CA, 94720 [email protected]
Abstract
We present a graph-based semi-supervised learning for the question-answering (QA) task for ranking candidate sentences. Us-ing textual entailment analysis, we obtain entailment scores between a natural lan-guage question posed by the user and the candidate sentences returned from search engine. The textual entailment between two sentences is assessed via features rep-resenting high-level attributes of the en-tailment problem such as sentence struc-ture matching, question-type named-entity matching based on a question-classifier, etc. We implement a semi-supervised learning (SSL) approach to demonstrate that utilization of more unlabeled data points can improve the answer-ranking task of QA. We create a graph for labeled and unlabeled data using match-scores of textual entailment features as similarity weights between data points. We apply a summarization method on the graph to make the computations feasible on large datasets. With a new representation of graph-based SSL on QA datasets using only a handful of features, and under lited amounts of labeled data, we show im-provement in generalization performance over state-of-the-art QA models.
1 Introduction
Open domain natural language question answer-ing (QA) is a process of automatically findanswer-ing an-swers to questions searching collections of text files. There are intensive research in this area fostered by evaluation-based conferences, such as the Text REtrieval Conference (TREC) (Voorhees, 2004), etc. One of the focus of these research, as well as our work, is on factoid questions in
En-glish, whereby the answer is a short string that in-dicates a fact, usually a named entity.
A typical QA system has a pipeline structure starting from extraction of candidate sentences to ranking true answers. In order to improve QA systems’ performance many research focus on different structures such as question process-ing (Huang et al., 2008), information retrieval (Clarke et al., 2006), information extraction (Sag-gion and Gaizauskas, 2006), textual entailment (TE) (Harabagiu and Hickl, 2006) for ranking, an-swer extraction, etc. Our QA system has a sim-ilar pipeline structure and implements a new TE module for information extraction phase of the QA task. TE is a task of determining if the truth of a text entails the truth of another text (hypothesis). Harabagui and Hickl (2006) has shown that using TE for filtering or ranking answers can enhance the accuracy of current QA systems, where the an-swer of a question must be entailed by the text that supports the correctness of this answer.
We derive information from pair of texts, i.e., question as hypothesis and candidate sentence as the text, potentially indicating containment of true answer, and cast the inference recognition as classification problem to determine if a ques-tion text follows candidate text. One of the chal-lenges we face with is that we have very lim-ited amount of labeled data, i.e., correctly labeled (true/false entailment) sentences. Recent research indicates that using labeled and unlabeled data in semi-supervised learning (SSL) environment, with an emphasis on graph-based methods, can im-prove the performance of information extraction from data for tasks such as question classifica-tion (Tri et al., 2006), web classificaclassifica-tion (Liu et al., 2006), relation extraction (Chen et al., 2006), passage-retrieval (Otterbacher et al., 2009), vari-ous natural language processing tasks such as part-of-speech tagging, and named-entity recognition (Suzuki and Isozaki, 2008), word-sense
biguation (Niu et al., 2005), etc.
We consider situations where there are much more unlabeled data,XU, than labeled data,XL, i.e., nL nU. We construct a textual
entail-ment (TE) module by extracting features from each paired question and answer sentence and de-signing a classifier with a novel yet feasible graph-based SSL method. The main contributions are:
−construction of a TE module to extract match-ing structures between question and answer sen-tences, i.e., q/a pairs. Our focus is on identifying good matching features from q/a pairs, concerning different sentence structures in section 2,
− representation of our linguistic system by a form of a special graph that uses TE scores in de-signing a novel affinity matrix in section 3,
−application of a graph-summarization method to enable learning from a very large unlabeled and rather small labeled data, which would not have been feasible for most sophisticated learning tools in section 4. Finally we demonstrate the results of experiments with real datasets in section 5.
2 Feature Extraction for Entailment
Implementation of different TE models has pre-viously shown to improve the QA task using su-pervised learning methods (Harabagiu and Hickl, 2006). We present our recent work on the task of QA, wherein systems aim at determining if a text returned by a search engine contains the correct answer to the question posed by the user. The ma-jor categories of information extraction produced by our QA system characterizes features for our TE model based on analysis of q/a pairs. Here we give brief descriptions of only the major modules of our QA due to space limitations.
2.1 Pre-Processing for Feature Extraction
We build the following pre-processing modules for feature extraction to be applied prior to our tex-tual entailment analysis.
Question-Type Classifier (QC):QC is the task of identifying the type of a given question among a predefined set of question types. The type of a question is used as a clue to narrow down the search space to extract the answer. We used our QC system presented in (Huang et al., 2008), which classifies each question into 6-coarse cat-egories (i.e., abbr., entity, human, location, num-ber, description) as well as 50-fine categories (i.e.,
color, food, sport, manner, etc.) with almost
90% accuracy. For instance, for question ”How many states are there in US?”, the question-type would be ’NUMBER’ as course category, and ’Count’ for the finer category, represented jointly as NUM:Count. The QC model is trained via sup-port vector machines (SVM) (Vapnik, 1995) con-sidering different features such as semantic head-word feature based on variation of Collins rules, hypernym extraction via Lesk word disambigua-tion (Lesk, 1988), regular expressions for wh-word indicators, n-grams, wh-word-shapes(capitals), etc. Extracted question-type is used in connection with our Named-Entity-Recognizer, to formulate question-type matching feature, explained next.
Named-Entity Recognizer (NER): This com-ponent identifies and classifies basic entities such as proper names of person, organization, prod-uct, location; time and numerical expressions such as year, day, month; various measurements such asweight, money, percentage; contact information likeaddress, web-page, phone-number, etc. This is one of the fundamental layers of information extraction of our QA system. The NER module is based on a combination of user defined rules based on Lesk word disambiguation (Lesk, 1988), WordNet (Miller, 1995) lookups, and many user-defined dictionary lookups, e.g. renown places, people, job types, organization names, etc. During the NER extraction, we also employ phrase analy-sis based on our phrase utility extraction method using Standford dependency parser ((Klein and Manning, 2003)). We can categorize entities up to 6 coarse and 50 fine categories to match them with the NER types from QC module.
Phrase Identification(PI):Our PI module un-dertakes basic syntactic analysis (shallow pars-ing) and establishes simple, un-embedded linguis-tic structures such as noun-phrases (NN), basic prepositional phrases (PP) or verb groups (VG). In particular PI module is based on 56 different semantic structures identified in Standford depen-dency parser in order to extract meaningful com-pound words from sentences, e.g., ”They heard high pitched cries.”. Each phrase is identified with a head-word (cries) and modifiers (high pitched).
”What is the capital of France?” is written in af-firmative form as ”[X]LOC:City is the capital of FranceLOC:Country.”. Here X is the answer text ofLOC:CityNER-type, that we seek.
Sentence Semantic Component Analysis: Us-ing shallow semantics, we decode the underlyUs-ing dependency trees that embody linguistic relation-ships such as head-subject (H-S), head-modifier (complement) (H-M), head-object (H-O), etc. For instance, the sentence”Bank of America acquired Merrill Lynch in 2008.”is partitioned as:
− Head (H):acquired
− Subject (S):Bank of America[Human:group]
− Object (O):Merrill Lynch[Human:group]
− Modifier (M):2008[N um:Date]
These are used as features to match components of questions like”Who purchased Merrill Lynch?”.
Sentence Structure Analysis: In our question analysis, we observed that 98% of affirmed ques-tions did not contain any object and they are also in copula (linking) sentence form that is, they are only formed by subject and information about the subject as: {subject + linking-verb + subject-info.}. Thus, we investigate such affirmed ques-tions different than the rest and call them copula
sentences and the rest asnon-copulasentences. 1 For instance our system recognizes affirmed ques-tion” Fred Durst’s group name is[X]DESC:Def”.
ascopula-sentence, which consists of subject (un-derlined) and some information about it.
2.2 Features from Paired Sentence Analysis
We extract the TE features based on the above lex-ical, syntactic and semantic analysis of q/a pairs and cast the QA task as a classification problem. Among many syntactic and semantic features we considered, here we present only the major ones:
(1) (QTCF) Question-Type-Candidate Sen-tence NER match feature: Takes on the value ’1’ when the candidate sentence contains the fine NER of the question-type, ’0.5’ if it contains the coarse NER or ’0’ if no NER match is found.
(2) (QComp) Question component match fea-tures:The sentence component analysis is applied on both the affirmed question and the candidate sentence pairs to characterize their semantic com-ponents including subject(S), object(O), head (H) and modifiers(M). We match each semantic ponent of a question to the best matching
com-1One option would have been to leave out the non-copula
questions and build the model for only copula questions.
ponent of a candidate sentence. For example for the given question,”When did Nixon die?”, when the following candidate sentence, i.e., ”Richard Nixon, 37th President of USA, passed away of stroke on April 22, 1994.” is considered, we ex-tract the following component match features: − Head-Match:die→pass away
− Subject-Match:Nixon→Richard Nixon
− Object-Match:−
− Modifier-Match:[X]→April 22, 1994
In our experiments we observed that converted questions have at most one subject, head, object and a few modifiers. Thus, we used one feature for each and up to three for M-Match features. The feature values vary based on matching type, i.e., exact match, containment, synonym match, etc. For example, the S-Match feature will be ”1.0” due to head-match of the noun-phrase.
(3) (LexSem) Lexico-Syntactic Alignment Features: They range from the ratio of consecu-tive word overlap between converted question (Q) and candidate sentence (S) including
–Unigram/Bigram, selecting individual/pair of ad-jacent tokens inQmatching with theS
–Noun and verb counts in common, separately. –When words don’t match we attempt matching synonyms in WordNet for most common senses. –Verb match statistics using WordNet’scauseand
entailmentrelations.
As a result, each q/a pair is represented as a fea-ture vectorxi ∈ <dcharacterizing the entailment
information between them.
3 Graph Based Semi-Supervised Learning for Entailment Ranking
We formulate semi-supervised entailment rank scores as follows. Let each data point in
X = {x1, ..., xn}, xi ∈ <d represents infor-mation about a question and candidate sentence pair and Y = {y1, ..., yn} be their output
la-bels. The labeled part of X is represented with
XL = {x1, ..., xl} with associated labels YL =
{y1, ..., yl}T. For ease of presentation we
concen-trate on binary classification, where yi can take on either of{−1,+1}representing entailment or non-entailment.X has also unlabeled part,XU =
{x1, ..., xu}, i.e., X = XL∪XU. The aim is to predict labels forXU. There are also other testing points,XT e, which has the same properties asX.
characteriz-ing their entailment relation information. When all components of a hypothesis (affirmative question) have high similarity with components of text (can-didate sentence), then entailment score between them would be high. Another pair of q/a sentences with similar structures would also have high en-tailment scores as well. So similarity between two q/a pairsxi, xj, is represented withwij ∈ <n×n,
i.e., edge weights, and is measured as:
wij = 1−
d
P
q=1
|xiq−xjq|
d (1)
As total entailment scores get closer, the larger their edge weights would be. Based on our sen-tence structure analysis in section 2, given dataset can be further separated into two, i.e., Xcp con-taining q/a pairs in which affirmed questions are copula-type, and Xncp containing q/a pairs with
non-copula-type affirmed questions. Since cop-ula and non-copcop-ula sentences have different struc-tures, e.g., copula sentences does not usually have objects, we used different sets of features for each type. Thus, we modify edge weights in (1) as fol-lows:
˜
wij =
0 xi ∈Xcp, xj ∈Xncp
1−
dcp
P
q=1
|xiq−xjq|
dcp xi, xj ∈Xcp
1−
dncp
P
q=1
|xiq−xjq|
dncp xi, xj ∈Xncp (2) The diagonal degree matrixDis defined for graph
g by D=P
jw˜ij. In general graph-based SSL, a
function over the graph is estimated such that it satisfies two conditions: 1) close to the observed labels , and 2) be smooth on the whole graph by:
argminf X i⊂L
(fi−yi)2+λ X i,j∈L∪U
˜
wij(fi−fj)2
(3) The second term is a regularizer to represent the label smoothness,fTLf, whereL=D−Wis the graph Laplacian. To satisfy the local and global consistency (Zhou et al., 2004), normalized com-binatorial Laplacian is used such that the second term in (3) is replaced with normalized Laplacian, L=D−1/2LD−1/2, as follows:
X
i,j∈L∪U
wij(√fdi
i −
fj √
dj
)2 =fTLf (4)
Setting gradient of loss function to zero, optimum
f∗, whereY ={YL∪YU},YU =
yln+1 = 0 ;
f∗ = (1+λ(1− L))−1Y (5)
Most graph-based SSLs are transductive, i.e., not easily expendable to new test points outsideL∪U. In (Delalleau et al., 2005) an induction scheme is proposed to classify a new pointxT eby
ˆ
f(xT e) =
P
i∈L∪Uwxifi
P
i∈L∪Uwxi
(6)
Thus, we use induction, where we can, to avoid re-construction of the graph for new test points.
4 Graph Summarization
Research on graph-based SSL algorithms point out their effectiveness on real applications, e.g., (Zhu et al., 2003), (Zhou and Scho¨lkopf, 2004), (Sindhwani et al., 2007). However, there is still a need for fast and efficient SSL methods to deal with vast amount of data to extract useful informa-tion. It was shown in (Delalleau et al., 2006) that the convergence rate of the propagation algorithms of SSL methods isO(kn2), which mainly depends on the form of eigenvectors of the graph Laplacian (k is the number of nearest neighbors). As the weight matrix gets denser, meaning there will be more data points with connected weighted edges, the more it takes to learn the classifier function via graph. Thus, the question is, how can one reduce the data points so that weight matrix is sparse, and it takes less time to learn?
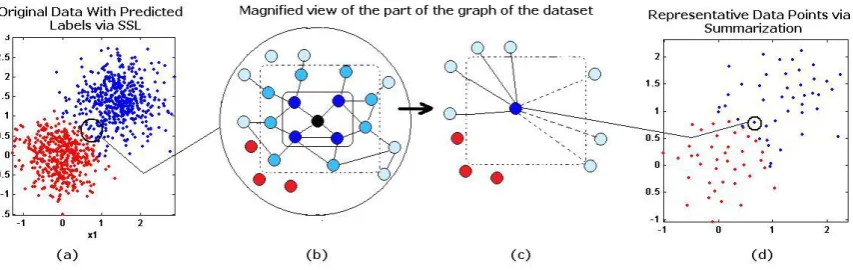
Our idea of summarization is to create repre-sentative verticesof data points that are very close to each other in terms of edge weights. Suffice to say that similar data points are likely to represent denser regions in the hyper-space and are likely to have same labels. If these points are close enough, we can characterize the boundaries of these group of similar data points with respect to graph and then capture their summary information by new
representative vertices. We replace each data point within the boundary with their representative ver-tex, to form a summary graph.
4.1 Graph Summarization Algorithm
Let each selected dataset be denoted as Xs = {xsi}, i = 1...m, s = 1, ..., q, where m is the number of data points in the sample dataset and
q is the number of sample datasets drawn from
X. The labeled data points, i.e., XL, are ap-pended to each of these selected Xs datasets,
Xs =
xs1, ...xsm−l ∪ XL. Using a separate
learner, e.g., SVM (Vapnik, 1995), we obtain pre-dicted outputs,Yˆs= ˆys
1, ...,yˆms−l
ofXsand ap-pend observed labelsYˆs= ˆYs∪Y
Figure 1: Graph Summarization. (a) Actual data point with predicted class labels, (b) magnified view of a single node (black) and its boundaries (c) calculated representative vertex, (d) summary dataset.
We define the weight Ws and degree Ds ma-trices of Xsusing (1). Diagonal elements of Ds
is converted into a column vector and is sorted to find the high degree vertices that are surrounded with large number of close neighbors.
The algorithm starts from the highest degree nodexsi ∈Xs, where initial neighbor nodes have assumably the same labels. This is shown in Fig-ure 1-(b) with the inner square around the mid-dle black node, corresponding high degree node. If its immediate k neighbors, dark blue colored nodes, have the same label, the algorithm contin-ues to search for the secondary k neighbors, the light blue colored nodes, i.e., the neighbors of the neighbors, to find out if there are any opposite la-beled nodes around. For instance, for the corre-sponding node (black) in Figure 1-(b) we can only go up to two neighbors, because in the third level, there are a few opposite labeled nodes, in red. This indicates boundary Bis for a corresponding node and unique nearest neighbors of same labels.
Bis=
n
xsi ∪
xsj nmj=1
o
(7)
In (7),nmdenotes the maximum number of nodes of aBsi and∀xsj, xsj0 ∈Bis, ysj =ysj0=yBs
i, where
yBs
i is the label of the selected boundaryB
s i.
We identify the edge weightswijs between each node in the boundaryBis via (1), thus the bound-ary is connected. We calculate the weighted av-erage of the vertices to obtain the representative summary node ofBisas shown in Figure 1-(c);
XsBi =
Pnm
i6=j=112w
s
ij(xsi +xsj)
Pnm
i6=j=1wijs
(8)
The boundaries of some nodes may only con-tain themselves because their immediate neigh-bors may have opposite class labels. Similarly
some may have only k+ 1nodes, meaning only immediate neighbor nodes have the same labels. For instance in Fig. 1 the boundary is drawn af-ter the secondary neighbors are identified (dashed outer boundary). This is an important indication that some representative data points are better indi-cators of class labels than the others due to the fact that they represent a denser region of same labeled points. We represent this information with the lo-cal density constraints. Each new vertex is asso-ciated with a local density constraint,0≤δj ≤1,
which is equal to the total number of neighbor-ing nodes used to construct it. We use the nor-malized density constraints for ease of calcula-tions. Thus, for a each sample summary dataset, a local density constraint vector is identified as
δs ={δ1s, ..., δnbs }T. The local density constraints become crucial for inference where summarized labeled data are used instead of overall dataset.
Algorithm 1 Graph Summary of Large Dataset 1: GivenX ={x1, ..., xn}, X=XL∪XU 2: Setq←max number of subsets
3: fors←1, ..., qdo
4: Choose a random subset with repetitions 5: Xs={xs1, ..., xms−l, xm−l+1, ..., xm} 6: SummarizeXsto obtainXsin (9) 7: end for
8: Obtain summary datasetX = Xs q
s=1=
Xi
p i=1and local density constrains,δ={δi}pi=1.
After all data points are evaluated, the sample datasetXscan now be represented with the sum-mary representative vertices as
Xs=
XsB1, ..., XsBnb . (9)
and corresponding local density constraints as,
The summarization algorithm is repeated for each random subset Xs, s = 1, ..., q of very large dataset X = XL ∪ XU, see Algorithm 1. As
a result q number of summary datasets Xs each of which with nb labeled data points are com-bined to form a representative sample ofX,X =
Xs qs=1 reducing the number of data fromnto a much smaller number of data,p =q∗nbn. So the new summary of theXcan be represented
with X =
Xi p
i=1. For example, an origi-nal dataset with 1M data points can be divided up to q = 50 random samples of m = 5000 data points each. Then using graph summariza-tion each summarized dataset may be represented with nb ∼= 500 data points. After merging sum-marized data, final sumsum-marized samples compile to500∗50∼= 25K1M data points, reduced to 1/40 of its original size. Each representative data point in the summarized dataset X is associated with alocal density constraints, ap = q∗nb
dimensional row vector asδ={δi}pi=1.
We can summarize a graph separately for dif-ferent sentence structures, i.e., copula and non-copula sentences. Then representative data points from each summary dataset are merged to form fi-nal summary dataset. The Hybrid graph summary models in the experiments follow such approach.
4.2 Prediction of New Testing Dataset
Instead of using large dataset, we now use sum-mary dataset with predicted labels, and local den-sity constraints to learn the class labels of nte
number of unseen data points, i.e., testing data points,XT e = {x1, ..., xnte}. Using graph-based SSL method on the new representative dataset,
X0 = X ∪ XT e, which is comprised of sum-marized dataset, X = Xi pi=1, as labeled data points, and the testing dataset, XT e as unlabeled
data points. Since we do not know estimated lo-cal density constraints of unlabeled data points, we use constants to construct local density constraint column vector forX0dataset as follows:
δ0 ={1 +δi}pi=1∪[1...1]T ∈ <nte (11)
0 < δi ≤ 1. To embed the local density con-straints, the second term in (3) is replaced with the constrained normalized Laplacian,Lc=δTLδ,
X
i,j∈L∪T wij(
fi
p
δi0∗di
−q fj
δ0j∗dj
)2=fTLcf
(12)
If any testing vector has an edge between a labeled vector, then with the usage of the local density constraints, the edge weights will not not only be affected by that labeled node, but also how dense that node is within that part of the graph.
5 Experiments
We demonstrate the results from three sets of ex-periments to explore how our graph representa-tion, which encodes textual entailment informa-tion, can be used to improve the performance of the QA systems. We show that as we increase the number of unlabeled data, with our graph-summarization, it is feasible to extract information that can improve the performance of QA models.
We performed experiments on a set of 1449 questions from TREC-99-03. Using the search en-gine 2, we retrieved around 5 top-ranked candi-date sentences from a large newswire corpus for each question to compile around 7200 q/a pairs. We manually labeled each candidate sentence as true or false entailment depending on the contain-ment of the true answer string and soundness of the entailment to compile quality training set. We also used a set of 340 QA-type sentence pairs from RTE02-03 and 195 pairs from RTE04 by convert-ing the hypothesis sentences into question form to create additional set of q/a pairs. In total, we cre-ated labeled training dataset XL of around 7600
q/a pairs . We evaluated the performance of graph-based QA system using a set of 202 questions from the TREC04 as testing dataset (Voorhees, 2003), (Prager et al., 2000). We retrieved around 20 can-didate sentences for each of the 202 test questions and manually labeled each q/a pair as true/false en-tailment to compile 4037 test data.
To obtain more unlabeled training data XU,
we extracted around 100,000 document headlines from a large newswire corpus. Instead of match-ing headline and first sentence of the document as in (Harabagiu and Hickl, 2006), we followed a dif-ferent approach. Using each headline as a query, we retrieved around 20 top-ranked sentences from search engine. For each headline, we picked the 1st and the 20th retrieved sentences. Our assump-tion is that the first retrieved sentence may have higher probability to entail the headline, whereas the last one may have lower probability. Each of these headline-candidate sentence pairs is used as additional unlabeled q/a pair. Since each
Features Model MRR Top1 Top5
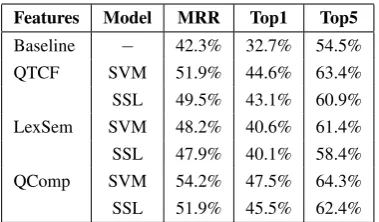
[image:7.595.87.277.61.172.2]Baseline − 42.3% 32.7% 54.5% QTCF SVM 51.9% 44.6% 63.4% SSL 49.5% 43.1% 60.9% LexSem SVM 48.2% 40.6% 61.4% SSL 47.9% 40.1% 58.4% QComp SVM 54.2% 47.5% 64.3% SSL 51.9% 45.5% 62.4%
Table 1: MRR for different features and methods.
line represents a converted question, in order to extract the question-type feature, we use a match-ing NER-type between the headline and candidate sentence to set question-type NER match feature.
We applied pre-processing and feature extrac-tion steps of secextrac-tion 2 to compile labeled and un-labeled training and un-labeled testing datasets. We use the rank scores obtained from the search en-gine as baseline of our system. We present the performance of the models using Mean Recipro-cal Rank (MRR), top 1 (Top1) and top 5 predic-tion accuracies (Top5) as they are the most com-monly used performance measures of QA systems (Voorhees, 2004). We performed manual iterative parameter optimization during training based on prediction accuracy to find the best k-nearest pa-rameter for SSL, i.e.,k = {3,5,10,20,50}, and best C =
10−2, ..,102 andγ =
2−2, ..,23 for RBF kernel SVM. Next we describe three dif-ferent experiments and present individual results.
Graph summarization makes it feasible to exe-cute SSL on very large unlabeled datasets, which was otherwise impossible. This paper has no as-sumptions on the performance of the method in comparison to other SSL methods.
Experiment 1. Here we test individual con-tribution of each set of features on our QA sys-tem. We applied SVM and our graph based SSL method with no summarization to learn models using labeled training and testing datasets. For SSL we used the training as labeled and testing as unlabeled dataset in transductive way to pre-dict the entailment scores. The results are shown in Table 1. From section 2.2, QTCF represents question-type NER match feature, LexSem is the bundle of lexico-semantic features and QComp is the matching features of subject, head, object, and three complements. In comparison to the baseline, QComp have a significant effect on the accuracy of the QA system. In addition, QTCF has shown
to improve the MRR performance by about 22%. Although the LexSem features have minimal se-mantic properties, they can improve MRR perfor-mance by 14%.
Experiment 2. To evaluate the performance of graph summarization we performed two separate experiments. In the first part, we randomly se-lected subsets of labeled training dataset XLi ⊂
XL with different sample sizes, niL ={1%∗nL,
5% ∗ nL, 10% ∗ nL, 25% ∗ nL, 50% ∗ nL,
100%∗nL}, wherenLrepresents the sample size
ofXL. At each random selection, the rest of the labeled dataset is hypothetically used as unlabeled data to verify the performance of our SSL using different sizes of labeled data. Table 2 reports the MRR performance of QA system on testing dataset using SVM and our graph-summary SSL (gSum SSL) method using the similarity function in (1). In the second part of the experiment, we applied graph summarization on copula and non-copula questions separately and merged obtained representative points to create labeled summary dataset. Then using similarity function in (2) we applied SSL on labeled summary and unlabeled testing via transduction. We call these models as Hybrid gSum SSL. To build SVM models in the same way, we separated the training dataset into two based on copula and non-copula questions,
Xcp, Xncpand re-run the SVM method separately.
The testing dataset is divided into two accordingly. Predicted models from copula sentence datasets are applied on copula sentences of testing dataset and vice versa for non- copula sentences. The pre-dicted scores are combined to measure overall per-formance of Hybrid SVM models. We repeated the experiments five times with different random samples and averaged the results.
Note from Table 2 that, when the number of labeled data is small (niL < 10% ∗ nL), graph
based SSL, gSum SSL, has a better performance compared to SVM. As the percentage of labeled points in training data increase, the SVM perfor-mance increases, however graph summary SSL is still comparable with SVM. On the other hand, when we build separate models for copula and non-copula questions with different features, the performance of the overall model significantly in-creases in both methods. Especially in Hybrid graph-Summary SSL, Hybrid gSum SSL, when the number of labeled data is small (niL <25%∗
% SVM gSum SSL Hybrid SVM Hybrid gSum SSL
#Labeled MRR Top1 Top5 MRR Top1 Top5 MRR Top1 Top5 MRR Top1 Top5
1% 45.2 33.2 65.8 56.1 44.6 72.8 51.6 40.1 70.8 59.7 47.0 75.2
5% 56.5 45.1 73.0 57.3 46.0 73.7 54.2 40.6 72.3 60.3 48.5 76.7
10% 59.3 47.5 76.7 57.9 46.5 74.2 57.7 47.0 74.2 60.4 48.5 77.2
25% 59.8 49.0 78.7 58.4 45.0 79.2 61.4 49.5 78.2 60.6 49.0 76.7
50% 60.9 48.0 80.7 58.9 45.5 79.2 62.2 51.0 79.7 61.3 50.0 77.2
[image:8.595.80.519.62.177.2]100% 63.5 55.4 77.7 59.7 47.5 79.7 67.6 58.0 82.2 61.9 51.5 78.2
Table 2: The MRR (%) results of graph-summary SSL (gSum SSL) and SVM as well as Hybrid gSum SSL and Hybrid SVM with different sizes of labeled data.
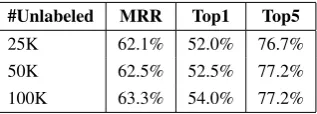
#Unlabeled MRR Top1 Top5
25K 62.1% 52.0% 76.7%
50K 62.5% 52.5% 77.2%
100K 63.3% 54.0% 77.2%
Table 3: The effect of number of unlabeled data on MRR from Hybrid graph Summarization SSL.
of the models. As more labeled data is introduced, Hybrid SVM models’ performance increase dras-tically, even outperforming the state-of-the art MRR performance on TREC04 datasets presented in (Shen and Klakow, 2006) i.e., MRR=67.0%, Top1=62.0%, Top5=74.0%. This is due to the fact that we establish two seperate entailment models for copula and non-copula q/a sentence pairs that enables extracting useful information and better representation of the specific data.
Experiment 3. Although SSL methods are ca-pable of exploiting information from unlabeled data, learning becomes infeasible as the number of data points gets very large. There are vari-ous research on SLL to overcome the usage of large number of unlabeled dataset challenge (De-lalleau et al., 2006). Our graph summarization method, Hybrid gsum SSL, has a different ap-proach. which can summarize very large datasets into representative data points and embed the orig-inal spatial information of data points, namely lo-cal density constraints, within the SSL summa-rization schema. We demonstrate that as more la-beled data is used, we would have a richer sum-mary dataset with additional spatial information that would help to improve the the performance of the graph summary models. We gradually in-crease the number of unlabeled data samples as shown in Table 3 to demonstrate the effects on the performance of testing dataset. The results show
that the number of unlabeled data has positive ef-fect on performance of graph summarization SSL.
6 Conclusions and Discussions
In this paper, we applied a graph-based SSL al-gorithm to improve the performance of QA task by exploiting unlabeled entailment relations be-tween affirmed question and candidate sentence pairs. Our semantic and syntactic features for tex-tual entailment analysis has individually shown to improve the performance of the QA compared to the baseline. We proposed a new graph repre-sentation for SSL that can represent textual en-tailment relations while embedding different ques-tion structures. We demonstrated that summariza-tion on graph-based SSL can improve the QA task performance when more unlabeled data is used to learn the classifier model.
[image:8.595.103.262.233.290.2]References
Jinxiu Chen, Donghong Ji, C. Lim Tan, and Zhengyu Niu. 2006. Relation extraction using label propaga-tion based semi-supervised learning. InProceedings of the ACL-2006.
Charles L.A. Clarke, Gordon V. Cormack, R. Thomas Lynam, and Egidio L. Terra. 2006. Question an-swering by passage selection. InIn: Advances in open domain question answering, Strzalkowski, and Harabagiu (Eds.), pages 259–283. Springer.
Oliver Delalleau, Yoshua Bengio, and Nicolas Le Roux. 2005. Efficient non-parametric function in-duction in semi-supervised learning. InProceedings of AISTAT-2005.
Oliver Delalleau, Yoshua Bengio, and Nicolas Le Roux. 2006. Large-scale algorithms. InIn: Semi-Supervised Learning, pages 333–341. MIT Press.
Sandra Harabagiu and Andrew Hickl. 2006. Methods for using textual entailment in open-domain ques-tion answering. In In Proc. of ACL-2006, pages 905–912.
Zhiheng Huang, Marcus Thint, and Zengchang Qin. 2008. Question classification using headwords and their hypernyms. InProceedings of the Conference on Empirical Methods in Natural Language Pro-cessing (EMNLP-08), pages 927–936.
Dan Klein and Christopher D. Manning. 2003. Ac-curate unlexicalized parsing. InProceedings of the 41st Meeting of the ACL-2003, pages 423–430.
Michael Lesk. 1988. They said true things, but called them by wrong names - vocabulary problems in re-trieval systems. InIn Proc. 4th Annual Conference of the University of Waterloo Centre for the New OED.
Rong Liu, Jianzhong Zhou, and Ming Liu. 2006. A graph-based semi-supervised learning algorithm for web page classification. InProc. Sixth Int. Conf. on Intelligent Systems Design and Applications.
George Miller. 1995. Wordnet: A lexical database for english. InCommunications of the ACL-1995.
Zheng-Yu Niu, Dong-Hong Ji, and Chew-Lim Tan. 2005. Word sense disambiguation using labeled propagation based semi-supervised learning. In Proceedings of the ACL-2005.
Jahna Otterbacher, Gunes Erkan, and R. Radev Dragomir. 2009. Biased lexrank:passage retrieval using random walks with question-based priors. In-formation Processing and Management, 45:42–54.
Eric W. Prager, John M.and Brown, Dragomir Radev, and Krzysztof Czuba. 2000. One search engine or two for question-answering. In Proc. 9th Text RE-trieval conference.
Horacio Saggion and Robert Gaizauskas. 2006. Ex-periments in passage selection and answer extrac-tion for quesextrac-tion answering. InAdvances in natural language processing, pages 291–302. Springer.
Dan Shen and Dietrich Klakow. 2006. Exploring cor-relation of dependency cor-relation paths for answer ex-traction. InProceedings of ACL-2006.
Vikas Sindhwani, Wei Chu, and S. Sathiya Keerthi. 2007. Semi-supervised gaussian process classifiers. InProceedings of the International Joint Conference on Artificial Intelligence (IJCAI-07), pages 1059– 1064.
Jun Suzuki and Hideki Isozaki. 2008. Semi-supervised sequential labeling and segmentation using giga-word scale unlabeled data. In Proceedings of the ACL-2008.
Nguyen Thanh Tri, Nguyen Minh Le, and Akira Shi-mazu. 2006. Using semi-supervised learning for question classification. In ICCPOL, pages 31–41. LNCS 4285.
Vilademir Vapnik. 1995. The nature of statistical learning theory. InSpringer-Verlag, New York.
Ellen M. Voorhees. 2003. Overview of the trec 2003 question answering track. In Proc. 12th Text RE-trieval conference.
Ellen M. Voorhees. 2004. Overview of trec2004 ques-tion answering track.
Dengyong Zhou and Bernhard Scho¨lkopf. 2004. Learning from labeled and unlabeled data using ran-dom walks. InProceedings of the 26th DAGM Sym-posium, (Eds.) Rasmussen, C.E., H.H. Blthoff, M.A. Giese and B. Schlkopf, pages 237–244, Berlin, Ger-many. Springer.
Dengyong Zhou, Olivier Bousquet, Thomas N. Lal, Ja-son Weston, and Bernhard Scho¨lkopf. 2004. Learn-ing with local and global consistency. Advances in Neural Information Processing Systems, 16:321– 328.