i
Determining the Accuracy and
Repeatability of Citizen-Derived
Imagery as a Source for
Structure-from-Motion Photogrammetry
Michael Lusty
This dissertation is submitted for the degree of
Master’s by Research
August 2019
ii
Dedication
I would like to dedicate this thesis to my Grandfather, David Grenville Lusty, whose
support, wisdom, energy and encouragement helped me achieve everything that I
have to this day and will continue doing so.
Acknowledgements
I would like to thank everyone who has supported me through my last year. I could
not have done it without the funding nor the huge support that The Rabbit Patch Ltd.
has provided me with over the last year: Jane Littlewood and Kevin Littlewood both
have provided the most caring support every step of the way. I would also like to thank
Wyre Borough Council for helping shape my project and providing data I have used to
develop my understanding of the Fylde coastline: Carl Green has had tremendous
input towards this project.
This thesis most certainly would not have been accomplished had it not been for the
care and attention provided to me by my supervisors, Suzana Ilic, Mike James and Ally
Gormally. Their support has not gone unnoticed and has helped me unlock a career
path I never thought I would be able to achieve. Vassil Karloukovski has been especially
helpful throughout this last year in survey training and help in the field.
Special thanks go to my close family whose words of advice and constant support have
helped me along the highs and lows this last year has brought. They have also provided
academic support in the writing and proof reading of this thesis. Lastly, but certainly
not least, I would like to thank Alexandra Geraghty for helping me through any issues
I came across and the encouragement I have received all the way through my higher
iii
Declaration
This thesis has not been submitted in support of an application for another degree at
this or any other university. It is the result of my own work and includes nothing that
is the outcome of work done in collaboration except where specifically indicated.
Many of the ideas in this thesis were the product of discussion with my supervisors Dr
iv
Abstract
Globally, sea levels are rising and continue to rise at an accelerating rate.
Developments built near the coast are vulnerable from coastal flooding due to a direct
rise in sea level and an increase in storm severity, persistence and frequency. As storm
events become more prevalent and powerful they will consequently exacerbate the
effects from rising sea levels and increase coastal flooding. It is therefore relevant for
coastal managers to build and maintain a comprehensive understanding of the coast
to predict what a future heightened sea level might bring. Building understanding at a
time when resources are limited due to budget cuts is often difficult requiring
cost-effective monitoring approaches. Citizen Science is a rapidly developing research
method whereby scientific projects utilise public input at one or more stages of the
research process. CS projects can tackle scientific research which often cannot be done
by scientists alone due to human, financial, time and spatial constraints. Alongside the
benefits afforded to scientific research, CS projects help in building scientific
understanding within the public domain. By increasing public understanding of the
coastal environment, citizens become more empowered to contribute towards coastal
decisions.
This project takes on the framework defined by CS by engaging a community group
with data collection methods for coastal monitoring. Focus is placed on the
Structure-from-Motion (SfM) photogrammetric workflow to build 3D models of the coastal
environment using citizens and their personal standalone cameras or inbuilt
smartphone cameras. This project aims to assess the accuracy of point clouds derived
from citizen-derived imagery of a coastal environment and thus determine its
v response from participating members of the public towards the SfM imaging
vi
Contents
Dedication ...ii
Acknowledgements ...ii
List of Figures ... ix
List of Tables ... xi
1. Introduction ... 1
2. Literature Review ... 6
2.1. Monitoring Coastal Morphologies ... 6
2.2. Existing Topographic Coastal Data ... 7
2.2.1. Satellite Imagery ... 8
2.2.2. Airborne LiDAR ... 10
2.2.3. Beach Profiles ... 12
2.3 Coastal Monitoring using Structure-from-Motion ... 14
2.4. The Coast in Context ... 21
2.4.1. Citizen Science ... 21
2.4.2. Contributory Citizen Science ... 22
2.4.3. The Contextual Model ... 24
2.4.4. Lay Expertise Model ... 26
2.5. Validation of Citizen-Derived Data ... 28
2.5.1. The Purpose of Coastal Photogrammetry ... 28
2.5.2. Measuring Accuracy of Reconstructed Topography ... 29
3. Methodology ... 34
3.1. The Volunteer Group and Study Site ... 34
3.1.1. The Study Site... 34
3.1.2. The Volunteer Group ... 36
3.2. The General SfM Workflow ... 37
3.2.1. Image Collection... 37
3.2.2. Reconstructing 3D Geometry ... 39
3.2.3. Georeferencing ... 40
3.3. Pilot Study: Hest Bank ... 41
3.4. Volunteer SfM Sessions... 44
3.4.1. Building an Understanding of the Project ... 44
3.4.2. Georeferencing: GCP Network Configuration ... 47
vii
3.4.4. Data Transfer ... 56
3.5. Assessing the Volunteer Session ... 56
3.5.1. Image and Ground Control Quality ... 56
3.5.2. Assessing the Accuracy of Image Alignment ... 58
3.5.3. Assessing the Accuracy of Dense Reconstructions ... 60
3.5.3.1. Cloud Preparations ... 61
3.5.3.2. Measuring the Effect of GCP Configurations ... 62
3.5.3.3. Measuring the Effect of Different Imaging Devices ... 63
4. Results ... 65
4.1. Evaluation of Session 1 ... 65
4.1.1. Summary of the Obtained Models ... 65
4.2. The Evaluation of Session 2: 3D Models ... 68
4.2.1. Image and Tie Point Analysis ... 68
4.2.2. Optimisation and Tie Point Error ... 73
4.2.3. The Effect of GCP Configuration on Model Accuracy ... 74
4.2.3.1. Evaluation of Dense Reconstructions ... 78
4.2.4. The Effect of Different Devices on Model Accuracy ... 84
4.2.4.1. Evaluating Tie Point Geometry ... 84
4.2.4.2. Comparison of Dense Reconstructions ... 91
4.3. Implementing Citizen-led Coastal Photogrammetry ... 94
4.3.1. Session 1 ... 94
4.3.2. Session 2 ... 97
5. Discussion ... 99
5.1. Comparison of Session Frameworks ... 99
5.2. The Optimum GCP Configuration... 100
5.3. Configuration Application Along the Fylde ... 101
5.4. Device Performance ... 103
5.5. Citizen Motivations ... 105
5.6. A Comparison to Other Topographical Methods ... 106
5.7. The Potential Framework for a Citizen Science Coastal Data Collection Programme . ... 107
6. Conclusions ... 109
6.1. Assessing the Accuracy of Citizen-derived Coastal Point Cloud Products ... 109
6.1.1. Suitability of Citizen-Derived Imagery ... 109
6.1.2. Point Clouds Prior to Georeferencing ... 110
viii
6.2. The Response from Participants ... 113
6.3. Contributions to Research and Coastal Management ... 114
6.4. Contributions to Public Engagement within Coastal Science ... 115
6.5. Future Work ... 115
7. References ... 117
Appendix 1A – GCP Configuration Linear Regressions (Sparse) – PL50 ... 120
Appendix 1B – GCP Configuration Linear Regressions (Sparse) – iPhone 6s ... 120
Appendix 1C – GCP Configuration Linear Regressions (Sparse) – iPhone X ... 122
Appendix 1D – GCP Configuration Linear Regressions (Sparse) – Galaxy S5 ... 123
Appendix 1E – GCP Configuration Linear Regressions (Sparse) – EOS 450D ... 124
Appendix 2A – DoDs for PL50 ... 125
Appendix 2B – DoDs for iPhone 6s ... 126
Appendix 2C – DoDs for iPhone X ... 128
Appendix 3 – DoDs Between Devices ... 131
Appendix 4A – GCP Configuration - Linear Regressions (Dense) – PL50 ... 134
Appendix 4B – GCP Configuration Linear Regressions (Dense) – iPhone 6s ... 135
Appendix 4C – GCP Configurations Linear Regressions (Dense) – iPhone X ... 136
Appendix 5 – Feedback Questionnaire 1 ... 137
Appendix 6 – Feedback Questionnaire 2 ... 141
Appendix 7 – SfM Instructions ... 144
Appendix 8 – Session 1 Feedback ... 145
ix
List of Figures
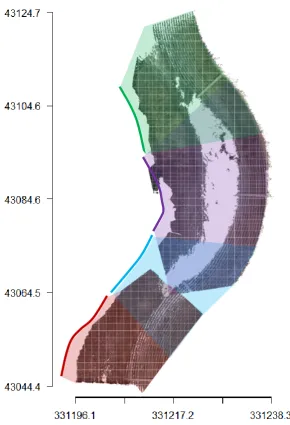
x image regions with smooth/waterlogged features. (b), (c), (d), (e) and (f) show systematic reprojection errors suggesting an incorrect camera model. (a), (b), (c), (d) and (e) are all taken by participants. (f) was taken by the researcher. (a) and (f) are standalone cameras. . 71 Figure 16 (a) An oblique image taken on an iPhone 6s showing the positions of 2 GCP targets. (b) and (c) GCP targets showing oblique pixelated centroids. ... 72 Figure 17 Sparse linear regressions of GCP configurations using the PL50 as an example. RMSE values are displayed for each respective plot. Red lines display a perfect positive 1:1 correlation between the configurations. Minor deviations are evident towards lower
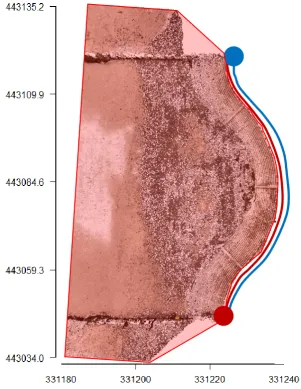
elevations. ... 77 Figure 18 (a) iPhone X DoD between the benchmark Full Distribution Model and the Seawall Mid model. (b) Shows the distance from the camera (red) to the GCP (yellow) (c) Shows an example of the oblique viewing angles for marker placement. ... 79 Figure 19 iPhone X DoD between the Full Distribution model and the Groyne Low model. .. 80 Figure 20 Dense linear regressions of GCP configurations using the PL50 as an example. RMSE values are displayed for each respective plot. Red lines display a perfect positive 1:1 correlation between the configurations. Minor deviations are evident towards lower
elevations. ... 82 Figure 21 ‘Full Distribution’ histograms displaying the spread of error in the x horizontal dimension for each device. The PL50 shows the highest concentration of error around 0m, whereas the iPhone 6s, iPhone X, Galaxy S5 and EOS 450D all show outliers greater than ±0.4 m. ... 85 Figure 22 ‘Full Distribution’ histograms displaying the spread of error in the y horizontal dimension for each device. The PL50 shows the highest concentration of error around 0m, whereas the iPhone 6s, iPhone X, Galaxy S5 and EOS 450D all show a wider spread of error. Error in this dimension is lower than that in the x dimension. ... 86 Figure 23 Histograms displaying the spread of error in the z vertical dimension for each device. All devices show a high concentration of error around 0 m with the EOS 450D
showing the most spread error... 87 Figure 24 GCP locations with a colour grading representing z error for the ‘Full Distribution’ for each device with respect to the GCP position... 89 Figure 25 Linear Regressions of elevations between device DEMs generated from sparse clouds. The red lines represent a perfect positive correlation. ... 90 Figure 26 Linear Regressions showing relationships between dense reconstructions
generated from each device. Red lines represent a perfect positive correlation. ... 91 Figure 27 DoD between PL50 and EOS 450D. The DoD displays deviations in elevation of the EOS 450D DEM with reference to the PL50 DEM. ... 93 Figure 28 DoD between PL50 and iPhone 6s. The DoD displays deviations in elevation of the iPhone 6s DEM with reference to the PL50 DEM. ... 93 Figure 29 Pie charts displaying views expressed by The Rossall Beach Residents and
Community Group. (a) Shows the proportion of participants who understand the benefits coastal monitoring has on developments. (b) The level of difficulty encountered for 3D model generation by participants. ... 95 Figure 30 Pie charts displaying views expressed by The Rossall Beach Residents and
xi
List of Tables
Table 1 The primary factors of each monitoring method. ... 14
Table 2 The number of participants for each session (indoor and outdoor) and the dates they were conducted. ... 37
Table 3 Specifications for the Canon EOS 450D used for the pilot survey at Hest Bank. ... 42
Table 4 Laptop specifications for 3D point cloud generation with the Rossall Beach Residents and Community Group... 45
Table 5 Computer processing specifications ... 59
Table 6 Device Processing Parameters ... 60
Table 7 Device Processing Parameters ... 60
Table 8 Successful dense reconstructions for each device and their respective GCP configurations. Successful reconstructions are indicated by an ‘x’. ... 62
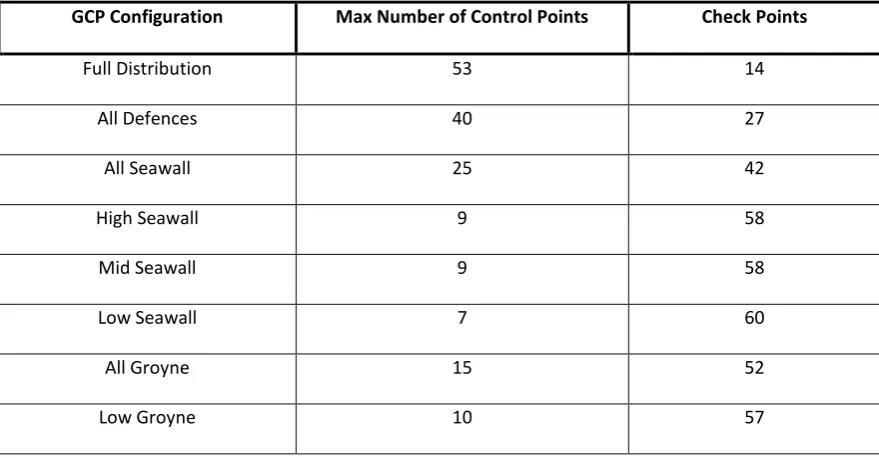
Table 9 GCP configurations and their respective control and check point counts. ... 63
Table 10 Camera details displaying the various internal setups for session 1 ... 64
Table 11 Camera details displaying the various internal setups for session 2 ... 64
Table 12 Device specifications from session 1, images aligned, and dense point clouds generated from aligned images. Clouds reconstructed in PhotoScan. ... 65
Table 13 Devices from session 2, the number of images aligned, and the dense point clouds generated from the aligned images. Clouds were reconstructed in PhotoScan. ... 68
Table 14 GCPs removed from geometry calculations due to RMSE values beyond the threshold ... 73
Table 15 All device configurations and their respective average RMSE for control and check points ... 74
Table 16 A table showing details on the dense reconstruction. ... 78
Table 17 A table displaying the difference in volumes between each GCP configuration. ... 81
1
1.
Introduction
In an age where climate change is having major influences on rates of sea level rise,
the need for comprehensive understanding and preventative action is paramount. It
is estimated that around 600 million people live in coastal areas that are less than 10
m above sea level globally (United Nations, 2017). This equates to approximately 8%
of the world’s population whom are most vulnerable to coastal flooding events. The
events are likely to become more frequent, persistent and severe as global
temperatures rise and the climate changes. As the climate changes and sea levels rise,
there is a necessity to understand the coastal processes that shape our coastline, as
these processes have direct and indirect impacts on developments near the sea.
Erosional effects are often unwanted where there is land which holds economic value,
and thus methods to mitigate them are usually sought after. Beaches act as energy
sinks for incoming waves and thus greatly reduce the erosional effects caused by them,
however, they themselves are subject to sediment loss through these
hydro-mechanical forces. It is therefore crucial to maintain and monitor beaches as they
evolve. Government organisations aim to develop an understanding of not only the
driving forces responsible, but the effects they have on coastal morphology. However,
resources are often limited due to budget constraints and the implementation of
research methods can be restricted by a lack of human resources. A newly re-emerged
scientific research method – Citizen Science (CS) – can greatly enhance the scope and
effectiveness of research where these restrictions are found.
Citizen Science is the practice of involving citizens within the scientific research process
2 between experts and non-experts to gather information about the natural world. The
degree of participation from citizens varies dramatically depending on the nature of
the objectives set out by the project. Passive engagement methods can utilise
resources owned by the public but not require the cognitive ability possessed by them,
where more active approaches can lead to project objectives being constructed or
shaped by the citizens themselves. A CS project can provide the ability to expand
sensing coverage over much larger areas when compared traditional methods
involving a few scientists -this is owed to the plentiful supply of human resources the
public offers. Additionally, sensing frequency can be increased for same reason and
data collection turnaround times greatly enhanced. CS projects do not just benefit the
scientific community; they also increase the public understanding of science by
engaging citizens directly with research and are crucial in developing confidence in
scientific practices.
In recent years, Citizen Science has experienced rapid growth; owed largely to
advancements in technology providing internet-capable portable sensing devices to
the public - smartphones. This thesis is purposed to provide insight into a potential
new monitoring method that will engage citizens in data collection. Not only will an
integrative method for public participation help support and fill knowledge gaps in
existing coastal data, but it can also serve as a tool for empowering the public within
coastal decision-making. It will identify the framework required to initialise a
citizen-led coastal monitoring solution using Structure-from-Motion (SfM) photogrammetry –
a method that generates 3D point clouds from image datasets without requiring
precise image locations and orientations - as a key tool in forming an enhanced
3 of the Fylde coast, northwest England whereby a segment of beach was selected as an
illustrative setting of the Fylde coastline. A groyne cell situated along a section of beach
in Cleveleys, Lancashire is used to analyse the feasibility of citizen-derived imagery as
a source of data for coastal photogrammetry. To justify and prove the potential for
citizen integration into coastal data collection, measures must first be taken to test the
accuracy and repeatability of such an observation method.
SfM has developed rapidly over recent years, with an accelerated uptake of the
surveying method across scientific domains. A particularly relevant discipline is that of
the geosciences, where SfM has become a well-established tool for the
geomorphological analysis of varied environments operating at multiple scales. This
makes it an especially useful tool, as coastal processes tend to operate across the
small-, medium- and large-scales. SfM has been well-tested at a range of scales (James
and Robson, 2012) however, there is not much insight into how the method performs
as a data collection method when carried out by citizens in a coastal setting. 3D models
produced from imagery collected by citizens require measures to be taken that ensure
their validity and usefulness as a scientific resource.
There have been numerous investigations into the accuracy and precision of SfM in
the sciences when performed by experts, however, there has not been much
application of the technique from non-experts. Traditionally, photogrammetry has
usually been conducted by expert photogrammetrists, but with the development of
new, robust algorithms that provide non-experts with a means to reconstruct 3D
geometry, photogrammetry has experienced a rapid proliferation in users. Although it
4 SfM process, this thesis addresses the potential for community involvement where
limited knowledge of the SfM pipeline is possessed. The community group involved
with this study are The Rossall Beach Residents and Community Group, whose
members proactively engage themselves with coastal-related issues. They were
contacted through a small to medium enterprise (SME) – The Rabbit Patch Ltd. - who
have strong links with coastal practitioners in both governmental and public bodies.
The Rabbit Patch were a project partner and aided with the programme design and
recruitment. This study will identify the motivations, if any, that the coastal community
group have towards the continued monitoring of the coast and their perceptions
towards the incorporation of SfM in coastal monitoring.
In this thesis 3D models produced from citizen-derived imagery were assessed for
‘noise’ in point cloud products, geometry trueness and erroneous model alignment
with real-world GPS coordinates. Data was collected during 2 field sessions taking
place in the same groyne cell location, in consecutive months. The field sessions took
place in September and October, when energetic sea conditions are known to
accelerate erosional processes. Analysis was performed using two key programmes:
Agisoft PhotoScan, (2018) for image matching, alignment, and dense reconstruction,
and CloudCompare (Girardeau-Montaut, 2003) for cloud manipulation and digital
elevation model (DEM) production. Measurements to test the accuracy of citizen-data
utilised a prior visual assessment of imagery, self-calibrating bundle adjustments for
intrinsic and extrinsic camera model solving, and ground control point (GCP) networks
to provide RSME values for 3D geometry reconstructions. 2D analysis is conducted on
imagery, prior to, and after image matching and alignments are made, and 3D analysis
5 dense clouds – a result from an algorithm built in a similar way to Multiview Stereo
(MVS). Data products derived from initial cloud generation and RMSEs derived from
GCPs not used in geometry reconstructions, are further analysed in CloudCompare and
the statistical computing environment, RStudio (2015).
The research objectives for this project are: (1) To assess the accuracy of point cloud
products of a coastal environment derived from imagery collected by citizens, and (2)
analyse the response from participating public members towards the SfM imaging
6
2.
Literature Review
2.1.Monitoring Coastal Morphologies
Coastal environments are areas highly dynamic if left without human intervention.
This is often not the case however, where human interests conflict with natural ocean
processes. Developments built near the sea and accompanying infrastructure are
usually immoveable structures of economic value and thus are usually protected if
economic value stored within assets outweighs the cost of defending them An
example of this is the £63 million Rossall Coastal Defence scheme along the Fylde coast
in the northwest of England, which has been designed to protect 7500 properties and
infrastructure (Visit Fylde Coast, 2018). Here, not only economic value was considered
but social as well. Protection from the sea can come in a variety of forms both
man-made and natural: hard defences, such as concrete structures such as seawalls, and
soft methods such as the managed retreat of land. These engineering projects are
often costly and subject to critical review from scheme developers (Nazia, 2018). For
hard-engineered projects this results in additional pressures being placed on ensuring
the successful performance of sea structures. A poorly performing seawall can have
negative effects on the safety of residences, commercial property and infrastructural
developments whilst also damaging social perceptions of government spending
(Garcia-Soto and van der Meeren, 2017). With current trends displaying an
accelerating increase in global sea levels, concerns over coastal protection will only
become worse if measures are not taken to dampen the unfavourable effects of
heightened water levels (Williams, 2013). For these reasons, it is paramount that the
7 In this section, these processes and the conflicts between the natural order of coastal
reshaping and human development are reviewed, and a variety of monitoring
methods are investigated. Consideration of existing coastal data such as large-scale
periodic imaging from satellites, medium-scale airborne LiDAR, photogrammetric
techniques and the labour-intensive beach profiling surveys are reviewed.
2.2. Existing Topographic Coastal Data
Topographic coastal data is sought after by governing authorities to provide evidence
and justify the development of new shoreline management plans (SMP). Collected
data needs to address a variety of issues across a range of temporal and spatial scales
(Miles, 2014). A multitude of methods are used to attempt to understand and tackle
problems posed by changing coastal environments; however, the data collected by
each method is often used to serve different purposes. In this section, existing
monitoring solutions are reviewed for their strengths and weaknesses as a
topographical surveying method. Since the first remote sensing technologies were
implemented, systems have been advanced and developed to produce high-accuracy,
topographical data. Satellite imagery, LiDAR and the more traditional methods such as
ground-based beach profiling are all technologically progressing with increasingly
accurate sensing abilities and either directly or indirectly provide a means to calculate
surface elevations. In recent years, this data has become increasingly available within
8
2.2.1. Satellite Imagery
The periodicity of satellite orbits allows for the consistent and regular monitoring of
the Earth’s surface which is beneficial to the consistent monitoring of areas. Satellites
can host a huge variety of sensors to collect information about the Earth’s atmosphere,
surface and subsurface. For topographic data collection satellites are widely used to
gather images in full-colour and false-colour to provide a perspective usually
unachievable. Due to the lack of atmospheric disturbance and little energy required
for the maintenance of orbit paths, satellites provide a predictable source of Earth
observation (EO) data – although weather effects such as clouds can often interfere,
limiting useful data acquisition. Satellites provide the ability for large spatial coverages
due to the speed of the spacecraft and the large distance to nadir and offer
observations of areas inaccessible on foot. Although these factors provide unequalled
coverage capabilities, they also limit the achievable spatial resolution which is much
lower than that offered by many ground-based or close-range aerial sensing systems
– ranging from 0.41m (commercially available) to 100s or 1000s of meters. Despite
this, satellite data is often freely accessible within the public domain resulting in the
increase of scientific research across fields and playing a fundamental role in a host of
new scientific discoveries (Wulder et al., 2012).
Coastal research has benefited from satellite imagery; however, local
processes cannot be monitored through satellite imagery alone as usually these
processes operate at scales below 10m—a resolution below that achievable by many
of the freely available imaging satellites such as the Sentinel 2 constellation and the
9 with pixel sizes down to 0.41 m using the panchromatic sensor (Satellite Imaging
Corporation, 2007). Resolutions of this precision can be used for fine-scaled changes
in coastal environments, but still limit spatial observations and usually lack the
frequency necessary for coastal research. A report produced by the Defence and Space
sector of Airbus showed the ability to reveal morphological changes along La Salie
beach on the French Atlantic coastline to an order of magnitude of 1m using the 0.5m
panchromatic/pansharpened imagery provided by the Pléiades 1 satellites (Airbus
Defence and Space, 2015). This demonstrates the capabilities of commercial imagery,
though is not representative of medium-scale, freely available satellite data.
As suggested by Cracknell (1999), it is fair to say that since the start of remote
sensing (satellite data) there has been more success in other areas - meteorology,
deep sea and land measurements—than there has been in the coastal zone. It has long
been an area that often requires resolutions that are currently unachievable for
space-borne data. Where satellite spatial ground sampling distances are sufficient for coastal
change detection, as exhibited in the La Salie Beach case study, the temporal scales
and volume of data required is often insufficient. Revisit times of satellites are
dependent on a few factors such as orbital radius, orbital inclination, the latitude of
the study area, and the size/direction of the spacecraft’s sensor. To fully understand
the coastal environment and the processes that shape them, systematic studies are
often required, posing challenges for satellite imagery to be used as a successful
monitoring solution for high frequency processes (Cracknell, 1999). This technology is
rapidly developing, with lower orbital launch costs and thus higher frequency launches
10 Stereo photogrammetry can be applied to space-borne imagery; however,
digital surface models (DSMs) are limited by the imaging capabilities of the satellite
and thus resolutions in the x, y and z dimensions are usually too low if derived from
freely available sources. Another method to generate height information of is the
‘waterline’ or ‘shoreline’ method. Surface topography can be calculated in the
intertidal zone by utilising a combination of satellite imagery and nearby tidal data.
This technique is used to build a series of contours by observing the shoreline position
at differing tidal elevations (Liu et al., 2013; Lipakis et al., 2018). However, this method
requires the assumption that the surface topography did not change between
observations and that the demarcation line of land and water is well-defined.
2.2.2. Airborne LiDAR
An advantage that airborne LiDAR possesses is the ability to directly gain 3D
information at a higher resolution than currently available by satellite systems without
the need for cumbersome techniques such as the waterline method (Liu et al., 2013).
Airborne LiDAR is a useful tool for monitoring volumetric changes along coastlines and
provides medium-large coverage of the environment (Miles, 2014). This method does
not share the same periodicity as satellite-derived data, and thus requires dedicated
flights which are costly and result in restricted data availability due to fewer airborne
surveys being flown. Nevertheless, in recent years costs have been declining (Miles,
2014), allowing for more frequent survey flights in some parts of the coast; airborne
LiDAR conducted by the Environment Agency (EA) is currently performed on an annual
11 weather than satellite data as they operate at lower altitudes and thus can avoid cloud
layers, however, surveys can be cancelled if weather conditions do not permit safe or
useful flight. Typically, airborne LiDAR data offered by the EA achieves resolutions of 2
m, 1 m, 0.5 m and 0.25 m ground sampling distance, although they do not state the
achieved vertical accuracy. Due to the inaccessibility of detailed reports on the quality
control, root-mean-square error values (RMSE) suggested by Miles (2013) are
identified to be 0.12 m when compared to permanent features such as a road, and
0.35 m when compared to spot heights afforded by Ordinance Survey (OS). These
accuracy values provide useful information for medium-large-scale processes;
however, they fail to identify finer spatial details.
To fulfil finer-scaled monitoring, ground-based approaches are required,
usually conducted by specialist surveyors. DEMs produced by Airborne LiDAR flown by
the EA is freely available, and typically higher in resolution than that of the freely
available satellite imagery. This therefore allows for finer coastal processes to be
analysed, but would still have difficulty identifying localised erosional features such as
toe scour. Earlie et al. (2015) utilise airborne LiDAR to assess rates of recession along
rocky coastlines, with focus on the Cornwall coast. In this investigation, LiDAR data
collection was carried out by the EA, who are responsible for the continuous airborne
LiDAR-monitoring and provided yearly data over a 3-year period for 10 study sites
within Cornwall. Although the EA conduct airborne LiDAR surveys annually, changes in
the Cornish coastline occur annually, or multi-annually and thus a complete evolution
is not understood. Here, it was possible to measure rates of coastal retreat to a
precision of <0.1m year-1 and provide greater detail than historic measurements in
ground-12 based monitoring. Surveys such as Terrestrial Laser Scanning (TLS) would have
provided greater detail in 3D structure, however, methods like these are restricted by
requiring access by foot. Despite this unrestricted access, airborne LiDAR does not
cover the shorter temporal intervals and is difficult to link the observed changes with
the driving conditions such as wave action.
2.2.3. Beach Profiles
Beach profile surveys have been performed since at least 1990 along the Fylde coast
(Miles, 2014), and therefore provide long-term information on coastal dynamics. The
surveys are typically conducted at approximately 500m intervals alongshore and occur
twice a year (Wyre Borough Council, 2004). Current manual beach profiling
measurements from Wyre Borough Council achieve an accuracy of ~±0.02 m in x/y/z
using differential GNSS (dGNSS) equipment and can be assumed to have lower
accuracies when grid surveys are carried out by mobile dGNSS or RTK GNSS surveys.
Along the Fylde coast, beach profiling provides insight into the large-scale, long-term
changes that shape the coastline. This data plays an important role in developing our
understanding of the coastline, and hence is a fundamental data source in coastal
strategy development needed for the continued protection of the coast. Although the
cross-shore accuracies provide high-detail resolutions of beach topography, longshore
resolutions are severely limited by human resources required to survey the many
kilometres of coastline along the Fylde. The surveys provide useful information;
13 profiling requires the beach to be accessed by foot which may not always be possible
and therefore requires monitoring by other means.
To provide topographical coverage in areas currently not monitored, a
combination of other monitoring methods is currently the common practice– such as
previously mentioned satellite and LiDAR data. Beach profiles are useful for observing
topographic cross-sections measuring hundreds of metres in length and can thus be
used in the monitoring of large portions of the intertidal zone. An example where they
are particularly useful is when analysing sand bar migrations (Miles, 2014). Along the
Fylde coastline, sand bars (or runnels and ridges) operate over hundreds of metres
with shallow inclines which shift over time as a result of tidal and wave-driven
processes (Wyre Borough Council, 2004). They effect on-shore wave action and have
long-term impacts on the morphology of the coastline. Although beach profiles work
well in the detection and monitoring of these crests and troughs, they often miss
nearshore local erosional features that occur around coastal structures due to their 2D
linear nature. This is especially prevalent when erosional features are perpendicular
to the shoreline—for example, rip currents caused by groyne-induced water
divergence (Bradbury et al., 2012). An approach to increase the longshore resolution
issue is required.
To summarise the strengths and weaknesses for each method in coastal
14 Table 1 The primary factors of each monitoring method.
Monitoring Method
Spatial Resolution (m)
Temporal
Resolution Cost
Weather Dependence
Satellite (Optical) 0.4 - 1000s Days Free High
Airborne LiDAR 0.1 - 10s Year/s High Medium
Beach Profiles
a) Cross-shore b) 0.1 - 10s
Months Medium Low c) Long-shore d) 10s - 100s
2.3 Coastal Monitoring using Structure-from-Motion
Structure-from-Motion (SfM) is a technique used to extract measurements from
images – it is a form of photogrammetry whereby 3D models are generated from
multiple images taken from different viewpoints. The 3D models are generated in the
form of point clouds – large collections of individual points, each of which represent a
specific point in space – and are easily manipulated in data processing software. This
ability to produce 3D models from images has become prevalent in the sciences due
to its practicality. Studies with focus on the geomorphology of environments have
experienced a new growth in photogrammetric surveys being incorporated into
method design in recent years. This is due to comparatively recent developments in
the workflow pipeline of SfM, opening low-cost, user-friendly photogrammetry to a
host of new disciplines (Micheletti et al., 2015b). SfM algorithms have been designed
to be robust enough to handle data from most non-metric cameras, and process
imagery that traditionally might not have been ideal. These new abilities allow for the
application of SfM in environments which would have once been expensive to survey
and would have required unwieldy equipment.
Although SfM algorithms are robust, there is an optimum data capture method
15 collect as many images as possible of the scene, but 3 is the minimum number for the
processing software to run. Ideally images should be taken in a converging manner
and each image should be captured within a few meters of the last and contain at least
60% overlap with previous images (Figure 1). The scene should be featureful,
non-reflective and be lit by diffuse lighting. The camera being operated should not use
distorted lenses such as fish eye lenses as these require complex correction algorithms
and can lead to error. The operator should also avoid using the zoom function which
changes the focal length, use a fast shutter speed to minimise image blur, and set the
sensitivity to a low ISO value to reduce image noise. Images that are collected in these
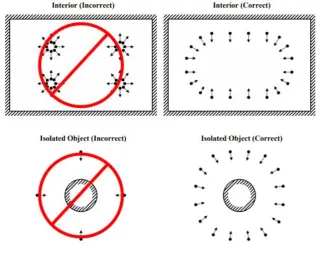
[image:26.595.157.479.373.632.2]conditions and in this fashion are more likely to undergo successful model generation.
Figure 1 Imaging diagram for SfM data capture. (Agisoft, 2018)
Essentially, SfM is a scale invariant monitoring method which can be applied to
many surveying scenarios to generate high-resolution topographical data, as
16 builds geometry from multiple images taken of a scene/object using numerous
software designed to perform the SfM procedure. The reconstruction process utilises
algorithms often using, or based around, the Scale Invariant Feature Transform (SIFT)
algorithm that detects features stable under light variation and changes in viewing
angle. Descriptors are generated based on their local neighbourhoods (Hassaballah et
al., 2016), and used to detect feature correspondences between images in order to
align imagery accordingly. Algorithms determine the intrinsic and extrinsic parameters
for the camera model per image and locates the camera’s position and orientation
(James and Robson, 2012). Further refinement can be carried out by bundle
adjustments using external points of known reference on which linear and non-linear
geometry adjustments are made.
The applicability of SfM to multiple scales renders it a useful tool generating
data that can support lower resolution satellite imagery, lower horizontal and vertical
resolution of many airborne LiDAR surveys and the large longshore distances between
beach profiles. It also provides a platform that facilitates a potential for high temporal
resolution due to the low-cost, low-bulk equipment required.
Cameras, like LiDAR systems, can operate from a variety of platforms; satellite,
plane, unmanned aerial vehicle (UAV) (Westoby et al., 2015; Clapuyt et al., 2015;
Brunier et al., 2016; James et al., 2017a) and ground-based systems (James and
Robson, 2012; Micheletti et al., 2015b; Prosdocimi et al., 2015). A prominent, newly
developing platform to enable photogrammetry is the drone. There are some
significant differences between UAV photogrammetry and LiDAR. UAV-based
17 by LiDAR systems, but instead can collect imagery from lightweight, consumer-grade
cameras mounted onboard UAVs. UAV photogrammetry has been demonstrated as a
low-cost monitoring technique for measuring canopy heights and found that results
showed a strong correlation to airborne LiDAR where tree density was low, however,
where a closed tree canopy was present UAV measurements differed to height
measurements collected in the field (Mlambo et al., 2017). The ability to perform these
surveys at low altitude means that resolutions are greatly increased when compared
to airborne or spaceborne imaging data. The resolutions obtained from SfM conducted
onboard UAVs is similar if not slightly lower than ground-based SfM. Although UAVs
are becoming increasingly public-owned, they have still not experienced the market
saturation that smartphones have and are often limited in capability by restricted
airspaces. They can also be affected by weather conditions such as high winds, and
rain which could result in defective data or termination of the survey all together.
Where wind speeds are strong enough to ground UAVs, research has been
conducted in Kite-mounted SfM techniques. One study attempted to utilise katabatic
wind flows in the Andes, which proved difficult for powered UAVs to maintain flight
in, as a mechanism to perform kite SfM (Wigmore and Mark, 2018). It found that the
accuracy of DEMs that were generated using this technique were similar to 1 m DEM
produced by aerial LiDAR in the area. However, the point cloud density was much
higher allowing for finer-scale features to be measured. The study shows the success
of unpowered kite systems in bad weather; however, the systems still face the same
limitations from restricted airspaces implemented by the International Civil Aviation
18 Images are processed to produce 3D point clouds, however, to enable a
real-world context georeferencing is needed which also serves as coordinate criteria for
image alignment (James et al., 2017b). This usually requires the use of ground control
points (GCPs) – identifiable features or targets that have a known position - to be used
within scenery. If ground control is not established, then inertial measurement units
(IMUs) attached to the camera can be used to measure camera orientation and
relative positioning of the sensing device. Information collected from the IMU is run in
parallel and combined with GNSS coordinate data for global positioning and
correction. For ground-based photogrammetry, GNSS connectivity is often a problem
if surveys are conducted in areas where obstructions to satellite connection are
present (vegetation, buildings etc.). In a coastal environment this is usually not an issue
due to the inherent nature of beach topography being free of restrictions from foliage
and large man-made structures. If models do not need to be geographically
referenced, then model scales can be determined by one or more known distance
measurements within the scene, whereby distances that stretch across a large portion
of the scene/object are best.
SfM has now been incorporated into many geoscience applications and tested
extensively in a variety of scenarios. A few studies to mention are those covering a
medium-scale environment, a scale that this study addresses. James and Robson
(2012), assessed a 3 m-high cliff face that spanned 50 m in length, located at
Sunderland Point, Morecambe Bay, U.K. The cliff face was poorly sorted glacial till that
was undergoing slumping and collapse causing it to retreat. Here 3D reconstructions
produced RMSE of 0.037 m on the control points when a GCP distribution that
19 typical LiDAR surveys conducted by the EA along this section of coastline. In this study,
an investigation was undertaken to determine the effects of GCP distribution on RMSE
throughout the scene. The study highlights the sensitivity of geo-referencing when
control is focused in one region – it displays the effect of extrapolated geometry away
from the region encompassed by the control.
Prosdocimi et al. (2015) utilise ground-based SfM in the post-event analysis of
agricultural drainage networks. Here, they detail the benefits of a low-cost method for
monitoring volumetric changes in the Veneto floodplain. The study involves imagery
derived from standalone cameras and built-in smartphone cameras and compares 3D
products against products derived from a benchmark TLS DEM in a medium-scale
environment. The scene of interest measured 30 m in length, and TLS reconstructed
geometry contained error values ~0.01 m in the x and y axes, and ~0.005 m in the z
axis when compared to GCP targets. The distance-from-bank was only about 7 m which
explains the low error values acquired in this study. Interestingly, in this study the
device that generated the lowest deviation in DEM topography when compared to the
TLS DEM was an iPhone 5, which produced an SDE value in the order of ~0.03 m in
relation to the TLS DEM.
These studies have shown SfM capabilities to perform beyond many of those
currently achieved by other remote sensing methods. However, the extent of coverage
which these studies have been tested on, do not achieve the same coverage as
airborne or satellite remote sensing techniques, nor do they span the same
cross-shore extent as beach profiles do. The nearcross-shore environment is an area most prone
20 Council, 2004), which causes large shifts in sediment volumes immediately in front of
sea structures (30–50 m offshore). It is at this scale that ground-based SfM has been
proven to work effectively.
SfM has proven itself as a capable and scientifically useful 3D modelling. Due to
the nature of the technique, low-bulk devices such as smartphones can be used to
collect imagery which in turn allows for greater access to areas that would be
inaccessible if using larger TLS instrumentation. The high-resolution imagery produced
by present-day smartphones is able to generate point clouds with point spacings of
<0.01 m. Additionally to this, data acquisition times are relatively quick when
compared to the same high-resolution laser scanning times of TLS. Furthermore,
because the SfM procedure enable the use of portable, consumer-grade devices such
as smartphones with inbuilt cameras for coastal monitoring it is an accessible
monitoring method to most people. It is here, that the domain of citizen science can
21 2.4. The Coast in Context
2.4.1. Citizen Science
The collaboration between citizens and professional scientists in the field of scientific
research is termed Citizen Science (CS). The extent to which citizens engage with the
research can vary depending on the project goals and the framework setup by
organisers. Government organisations are often symbiotic with scientific research and
thus rely on their insight for strategy development across a range of domains.
However, science is often limited by lack of human resources, and the failure to meet
the scope of research needed for optimum decision-making. Additionally, if scientific
research yields unfavourable outcomes, it often the scientific community who are
blamed for negative effects. This is only exacerbated by the chasm between the public
and governmental/scientific communities. Citizen science initiatives are beneficial to
society as they promote public understanding of science. The level of scientific
understanding has raised concerns from scholars and led to new incentives to
revitalise positive perceptions towards science. Many citizen science projects not only
benefit academic research and strategy developments, but also enhance society by
increasing awareness of the importance of scientific research.
It is here, that CS provides the potential to bridge the communication gap and
empower citizens to become an integral part of decision processes. CS projects have
become a prominent part of many areas of study including ecology, astronomy,
palaeontology, archaeology and zoology (Lin et al., 2014; Anderson et al., 2002;
22 emergent technology – computing. The recent propagation of internet-connected
smartphone technology has enabled a whole new domain of citizen-sensors (Haklay,
2013). This utilises the inbuilt sensors on smartphone devices: cameras, GNSS,
accelerometers as well as the ability to programme apps that enable a refined data
collection procedure. For this study, the inbuilt cameras are primarily of use along with
the internet-capability offered by them to transfer data wirelessly.
2.4.2. Contributory Citizen Science
There are numerous citizen science engagement models, each with a unique set of
skills and purposes. For this study, the CS project follows a ‘contributory citizen
science’ model. This model spans a myriad of levels of engagement within itself from
passive to more active approaches for citizen engagement. These style projects are
most often designed by scientists to achieve scientific goals, however, they require a
contribution from citizens. The model spans in breadth from passive engagement,
where the participants have little if any physical or cognitive involvement but instead
utilises crowdsourced computing power, and more active approaches usually involving
physical or cognitive activity. An active approach such as Volunteered Geographic
Information (VGI) can utilise current GPS capabilities to allow citizens to become
sensors to their local environment (Haklay, 2013). This approach by-passes any needs
for cognitive ability, which from a scientific viewpoint, is easier to collect results from.
Instead, only information about the instrument is needed (i.e. GPS accuracy etc.).
Alternatively, participants can upload geographic information of an area via dedicated
23 Map Insight and Flickr (Goodchild, 2007; Senaratne et al., 2016). This is a relatively
sparse method for data capture and usually encourages participation from anyone for
any location, with no need for prior knowledge. To allow for this style of information,
the users’ uploads are assessed by peers and against predetermined criteria to ensure
the validity of data (ref).
Another method utilising human cognitive ability is ‘distributed intelligence’
(Haklay, 2013) whereby the participants carry out relatively simple tasks which are
often difficult to replicate using machine intelligence. This is the model for
engagement that has provides the foundation of citizen-led coastal photogrammetry.
These citizen science projects usually require some basic training, then the participant
carries out simple data collection tasks. It is these tasks that require cognitive intellect
to achieve goals. Image collection as a source of data for coastal photogrammetry
requires the application of a predetermined technique, however, requires it to be
applied to a dynamic setting.
When coastal surveys are to be conducted by members of the public, there are
two key groups to which survey objectives should be designed towards; active
practitioner groups such as coastal community groups who regularly participate on
coast related matters, and the wider public, who are a more dispersed a mixed social
group. These groups can effectively address two scales in space and time;
high-resolution, medium coverage and semi-frequent monitoring, and the wider public low
resolution, high coverage and continuous monitoring. The two groups respond to
information very differently, and the method of communication with them needs to
24 possess a strong affiliation with the coast and therefore communication can be more
relatable to the coastal environment, however objective and outcomes must be
observable and understandable to maintain interest (see section 24). The wider public
requires a broader approach to research objectives with simpler tasks to fulfil, but
results do not have to be visible to the public. For this project, engagement with a
coastal community group is the focus, as it provides a more thorough understanding
of individual abilities and methods can be laterally translated for integration with the
wider public.
2.4.3. The Contextual Model
If CS techniques are to be used in coastal monitoring, then special consideration
towards social perceptions is needed to create an engaging framework for citizens to
participate in. This section evaluates the effects of a contextual meaning that
information has when being absorbed by the public and how it affects their
perceptions towards scientific research.
The contextual model refers to the understanding that individuals do not
simply respond to information as empty containers, retaining the whole volume of
data provided. Instead, it incorporates the idea that the efficiency at which
information is absorbed can be largely affected by individual current social and
psychological states (Lewenstein, 2003). These states are shaped by previous
experiences in a cultural context and from personal circumstances. When relating this
25
peoples’ lives; loss of infrastructure, property damage and, commercial impacts all
have effects on the residents’ lives. It is these experiences that have often shaped
public perceptions of coastal risk and develops their ability to absorb information. The
model also understands that the attitude towards science or information of any kind
can be amplified or dampened depending on modern social systems and media.
In a more general scenario, the 2016 Presidential Election was highly broadcast
and has since been found to have had a huge increase in fake news in the 3-month
prior run-up. These fake news stories are believed to have manipulated the public’s
view on current affairs, thereby changing the way information is recognized (Alcott et
al., 2018). This is argued to have enhanced/impaired contextual meaning of policies
and future plans put forward by democratic parties in citizens’ lives. Although the
extent to which misinformation affected the 2016 election in unknown (Alcott et al.,
2018), it highlights the importance of the psychology of individuals and how their
reactions can be shaped as a result of experiences they have with their environment.
The ability to influence society through contextual meaning can be used as a major
tool for the distribution of scientific knowledge.
A number of studies have identified how risk perception is greatly influenced
by the context it has in personal lives and society. Krimsky and Plough (1998) reviewed
a number of case studies whereby communities had been subject to water
contamination. Although levels of contamination were of similar proportions, the
reaction from the public differed between locations. Amongst other factors affecting
their perception of risk, it was found that if residents discovered the contamination
26 met with distrusting perceptions. If, at the discovery of risk, other concerning issues
are at play, then the response to risk can either be underestimated or overestimated,
varying in magnitude and direction between social states. This is can be related to
concerns over sea level rise, and government spending towards flood risk and disaster
management in coastal areas. From these examples, it is suggested that by
incorporating citizens within research, they would feel more empowered and
therefore become a more integral part of the decision-making process. This would
likely result in more confidence in scientific research from a more trusting public.
2.4.4. Lay Expertise Model
Citizens often contain large volumes of information that perhaps might have been
overlooked by researchers or require long-term experience to understand and
perceive. In areas of coastal development, citizens could hold information of their
coastal environment that may be more applicable to a local setting. In this section, the
lay expertise model is shown to have importance in the development of scientific
study.
The lay expertise model has often been a subset of the contextual
understanding model due to its similar ideology. However, it has been, on occasion,
reviewed as a separate model. The contextual model regards scientific knowledge as
a valuable asset but understands the complexities involved in delivering it, whereas
the lay expertise model assumes that local expertise can be as relevant as scientific
27 In one scenario the U.S. AIDS treatment activists – a diverse group of ‘lay
experts’ – were established, and carry on to this day, as a credible participant in
knowledge construction. This brought with it changes in biomedical research, and the
subsequent attributed practices. The lay knowledge was implemented by way of a
bottom-up approach. The lay expertise had always been present, though not
structured in a scientifically practical manner. To engage fully within the realms of
biomedical research, treatment activists had to learn the language and culture
possessed by medical science. By doing so, their credibility was constructed, and their
lay expertise fused into decision-making. Although this example was
reverse-engineered by the lay people themselves, it signifies the success of unifying scientific
and lay expertise into knowledge development. The same can applied in a coastal
community – communities who are immersed within the region of study, often have
knowledge that has just as much relevance as knowledge derived from the scientific
community. Integration of this understanding of the coast can benefit researchers by
enhancing project efficiency and providing unexpected insight into investigations.
The lay expertise model is far from perfect, with itself being subject to criticism.
Lewenstein (2003) identifies how the model favours local knowledge over the more
reliable knowledge derived from the interworking engrained in the modern scientific
system. For this reason, it can be described as “anti-science” (Lewenstein, 2003), and
has been subject to dispute. This ideology is driven by the commitment to empowering
local communities in decision-making. It is from this that participation within the data
collection process is fundamental in engaging communities and, this being so, their
local knowledge of the coastal environment can help frame an insightful and efficient
28 2.5. Validation of Citizen-Derived Data
2.5.1. The Purpose of Coastal Photogrammetry
The aim of citizen-led coastal photogrammetry is to have an additional source of data
to those collected by existing monitoring methods. It is therefore apparent that
accuracies of the 3D models obtained must be comparable with those obtained via
traditional techniques. Also, this citizen-led method must be capable of providing
useful information in regard to coastal processes in the small-, medium- and
large-scales. The method of ground-based photogrammetry offers capabilities in the small-
to medium-scale coastal environment; however, when paired with the concept of
citizen-led coastal photogrammetry, large-scale monitoring is possible, for example,
combining multiple monitoring groups over different stretches of coastline.
Along the Fylde coast, the primary losses of sediment are forced by longshore,
wave-driven and tidal currents. However, cross-shore processes are equally
important. As this an intertidal environment, shoaling, surf zone processes (e.g. wave
breaking and resulting currents) and swash processes can take place immediately in
front of sea structures and can extend out to 30–50 m offshore during storm events
(Wyre Borough Council, 2004). The scouring around coastal structures such as seawalls
and groynes take place at spatial scales of metres, however, smaller developing
features can exhibit characteristics below <1 m (Bradbury et al., 2012). Scouring
around groynes will take place along groynes at distances up to 100m. The artificial
29 removal rates, and therefore experience lower beach levels and toe scour in these
regions, again at several tenths of metres. This is a scale that is achievable from SfM
surveying and has been performed by numerous researchers (James and Robson,
2012; Westoby et al., 2012; Ružić et al., 2014; Prosdocimi et al., 2015; Pikelj et al.,
2018).
2.5.2. Measuring Accuracy of Reconstructed Topography
Accuracy is always important for any research project. However, the methods by which
data quality is assessed are scrutinised in CS projects. Usually the aims of the project
are to enable non-scientists to participate in at least one stage of the research process.
Typically, this involves utilising imprecise, inaccurate data necessitating strict
procedures to remove poor-quality data or implementing methods to prevent the
production, or inclusion, of such information. In all scientific domains, accuracy plays
a fundamental role in the validation of outcomes from a piece of research.
In the geosciences, topographical surveys rely substantially on the accuracy of
data and the precision yielded by the instrumentation used to acquire it. Image quality
can vary substantially when performing SfM photogrammetry. Although SfM
algorithms are robust to changes in light conditions, camera parameters and non-ideal
scene conditions, it is still useful to remove any defective imagery before processing
photosets within SfM-based software (Agisoft, 2016). Software such as Agisoft
PhotoScan (Agisoft, 2018) enables self-calibrating bundle adjustment to define camera
30 model for each photoset. James et al. (2017a) inspected imagery by first identifying
any outliers from the resultant sparse point cloud generated after image alignment
has been performed. Visual inspection was also performed on residual error post-lens
calibration to identify any particularly large vector errors, or if there were systematic
image residuals. The presence of systematic error would suggest a poorly matched
camera model and could require further parameter adjustments. From here dense
reconstructions and DEM generation can follow.
The robust SfM procedure, ensure that as many sources of inaccuracy are
removed. However, post validation of the 3D model is helpful to determine the
deviation of model topography from real-world topography. The multitude of LiDAR
applications and its longevity as a measuring tool has led to numerous studies being
conducted utilising data retrieved from it as a benchmark. In a geomorphological
context, some studies that empirically asses the accuracy of SfM photogrammetry
include James and Robson (2012); Westoby et al. (2012); Prosdocimi et al. (2015);
Clapuyt et al. (2015); Brunier et al. (2016).
Prosdocimi et al. (2015) compares DEMs from imagery taken by a range of
imaging devices: A Canon EOS 5D Mark III, Nikon D3000 and an iPhone 5 and compares
them to a DEM derived from TLS. The TLS equipment location was georeferenced using
dGNSS and from this, the point cloud data was automatically georeferenced. This style
of comparison - once validation through cross-checking known check point data with
targets on the TLS point cloud has been performed – allows for each point in the cloud
data to substitute as a check point (Prosdocimi et al., 2015), and thus allows for a fuller
31 make the models computationally wieldy and comparable with the TLS cloud. From
here, unwanted point cloud data was manually removed using the open-source cloud
manipulation programme CloudCompare (Girardeau-Montaut, 2003). These clouds
were later interpolated to a 0.1 m (in x and y) resolution grid DEM using the natural
neighbours method (Sibson, 1981). Here, 0.1m x 0.1m columns contain one value only,
therefore removing excess data and producing a single-layer comparable cloud
(Prosdocimi et al., 2015).
DEM comparison should be carried out in caution, however. James and Robson
(2012), highlight the complications induced by the point cloud interpolation process.
Although the resulting clouds produce a computationally more efficient and more
wholesome comparison, issues can arise when comparing areas of high obliquity or
vegetation cover. A coastal cliff located at Sunderland Point, Morecambe Bay, U.K.
provided focus of study for analysis in the reconstruction process of 3D surfaces using
a camera (James and Robson, 2012). Here, analysis was applied over different scales.
Raw point cloud data showed differences in density and distribution. TLS data yielded
a lower density but significantly more even distribution of points compared to those
derived from SfM. High densities were focused around the vertical faces for the SfM
clouds but lacked information around the crests of slumped material – areas with
vegetation and high surface obliquity. TLS data did, however, return a more consistent
spread of values within these SfM low-data regions. During the gridding process, large
estimations were made on steep and vegetated surfaces, giving differences of up to