ISSN Print: 2152-2294
DOI: 10.4236/wet.2018.93005 Jul. 13, 2018 49 Wireless Engineering and Technology
On Evaluating the Efficacy of Predictive Models
for Cognitive Radio Spectrum Availability in
Nigeria
Samuel Okegbile
*, Adeniran Oluwaranti, Segun Aina
Department of Computer Science and Engineering, Obafemi Awolowo University, Ile-Ife, Nigeria
Abstract
In order to avoid the undesired interference with the activities of the primary users in cognitive radio networks, the secondary users are required to be able to predict the behavior of the primary users so as to leave the channel before the arrival of such licensed owner of the spectrum. While a number of existing literatures on cognitive radio spectrum prediction employ the use of propaga-tion curves for predicting the spectrum holes otherwise known as TV white space, these models are built based on measurements conducted in regions that are different from Nigeria, suitability in terms of usage may therefore vary due to environmental factors and terrain profile. This work evaluates the efficacy of the developed model in predicting the cognitive spectrum availabil-ity in Nigeria. Models capable of predicting spectrum occupancy in the time domain using discrete-time two-state Markov chain with an appropriate Duty Cycle (DC) model and also a modified m-bell shaped exponential equation were formulated. The result obtained in all cases considered shows that the formulated models are appropriate to be used in any environment if the pa-rameters were carefully extracted from the data. This work has also demon-strated that the accuracy of Markov chain models depends on the level of usage of a spectrum under consideration and may therefore not give desirable results when employed in some other spectrum.
Keywords
Cognitive Device, Predictive Model, Spectrum Management, Spectrum Occupancy, TV White Space
1. Introduction
The continuous demand for wireless communication technologies and systems
How to cite this paper: Okegbile, S., Olu-waranti, A. and Aina, S. (2018) On Evaluat-ing the Efficacy of Predictive Models for Cognitive Radio Spectrum Availability in Nigeria. Wireless Engineering and Technol-ogy, 9, 49-65.
https://doi.org/10.4236/wet.2018.93005
Received: May 10, 2018 Accepted: July 10, 2018 Published: July 13, 2018
Copyright © 2018 by authors and Scientific Research Publishing Inc. This work is licensed under the Creative Commons Attribution International License (CC BY 4.0).
DOI: 10.4236/wet.2018.93005 50 Wireless Engineering and Technology
has reached a peak where existing capacity cannot meet increasing demand without means of improving the efficiency of spectrum utilization. The Owned spectrum allocation policy also known as the fixed spectrum allocation policy has led to Spectrum Scarcity [1] [2] [3]. However, research by Federal Com-munications Commission (FCC) Spectrum Policy Task Force showed that a large portion of the assigned spectrum was used sporadically, leading to un-der-utilization of a significant amount of spectrum. In order to overcome such artificial scarcity, the most promising solution is Dynamic Spectrum Access Cognitive Radio (DSA/CR) where some devices known as cognitive radios (oth-erwise called secondary users or unlicensed devices) skip the licensing process and instead opportunistically make use of the licensed spectrum currently un-used by licensed or primary users [1] based on the FCC ruling which permits unlicensed devices to transmit in white spaces (also known as spectrum holes) as long as they do not interfere with the licensed users of the spectrum [4]. If inter-ference with the activities of the Primary Users (PUs) is to be avoided, the Sec-ondary Users (SUs) must be able to predict the behavior of the primary users so as to leave the band before the arrival of such licensed owner of the spectrum. The need for digital switchover then becomes expedient to permit the unlicensed devices that make use of the licensed bands.
Pursuant to this, a lot of researches have been carried out in the area of Cog-nitive Radio Network for Opportunistic Access. This has facilitated digital switchover which has completely taken place in most developed countries while a similar switchover process is still underway or being planned in many other countries around the world. A treaty agreement which mandated the digitization of broadcasting in Europe, Africa, Middle East and the Islamic Republic of Iran by a target date of June 17, 2015 was signed on June 16, 2006 during the Regional Radio Communication Conference (RRC-06) of the International Telecommu-nication Union (ITU) in Geneva. Nigeria was however among other 52 countries in the continent of Africa that was unable to make the transition from analogue to digital terrestrial broadcasting [5].
Efforts are now being made to have a digital switchover in other countries such as Nigeria that were unable to meet the previous deadline. When this is eventually done, the quantity of the spectrum available will be needed in order to make effective and efficient use of it. However, models are needed in order to carry out spectrum availability measurements since the behavior and perfor-mance of a secondary network depend on the spectrum occupancy patterns of the primary system. A realistic and accurate modeling of such patterns becomes essential and extremely useful in the domain of cognitive radio research [6] [7].
mod-DOI: 10.4236/wet.2018.93005 51 Wireless Engineering and Technology
ified m-bell shaped exponential equation. The performance of the proposed models was evaluated using throughput as metric and by performing Kolmogo-rov Smirnov test. The details of the proposed models evaluation are also pre-sented in this paper.
The rest of this paper is arranged as follows; In Section 2, we present reviews of related works. We describe the methodology that was employed in formulat-ing our proposed model, in Section 3, we also give the details of the performance metric used in the same section. In Section 4, we present the results obtained using the models formulated and also present our evaluation results while Sec-tion 5 offers conclusions and discusses areas for future work.
2. Related Works
Cognitive radio spectrum management is very important as a key technology for future wireless communications and mobile computing, it is not surprising that a lot of literatures exists on Cognitive Radio Network (CRN). In this section, we review some of the literatures relevant to this work.
2.1. Channel Predictive Models
Predictive models can be classified into either deterministic or stochastic mod-els. Both of which are used in predicting the cognitive radio spectrum availabili-ty depending on the traffic pattern. A deterministic model defines an exact rela-tionship between variables, and the output is fully determined by the parameter values and the initial conditions. The system properties and the input are per-fectly known [8]. A Stochastic model on the other hand accounts for random error and includes both a deterministic component and a random error compo-nent. Stochastic models possess some inherent randomness in the sense that the same set of parameter values and initial conditions will lead to an ensemble of different outputs. They are considerably more complicated than the determinis-tic models [9].
2.2. Spectrum Occupancy Modeling
Spectrum occupancy modeling is widely known to be the process of extracting information about the state of a spectrum (busy or idle) at a particular time. Once the busy/idle information has been extracted from the captured measure-ment data, it can be used for the developmeasure-ment of spectrum occupancy models. Spectrum occupancy models are models that aids predicting the future state of a spectrum, such state can either be busy or idle. Determining the spectrum usage of the PUs however is by no means straightforward [10] [11].
infor-DOI: 10.4236/wet.2018.93005 52 Wireless Engineering and Technology
mation relevant to the parameter(s) to be modeled. An appropriate model can then be formed by comparing this information to various candidate models, as-sessing the accuracy of each option and selecting the most convenient modeling alternative”. The spectrum occupancy modeling can be either time, frequency or spatial based. In this work, a time based dimension modeling approach was con-sidered.
The authors in [13] evaluated the efficacy of the learning automata in model-ing the random behavior of the PUs by generatmodel-ing the pattern of the PUs activi-ty. Modeling of the behavior of PUs, training and updating were done using Markov model. The model was evaluated and compared under the same condi-tion with multilayer perceptron Artificial Neural Networks (ANNs) based model which has also been used in [14] with the result showing that the learning auto-mata technique with simple structure is more reliable than ANN. The authors in
[15] assessed the fitness of nine widely used empirical path loss models using five novel metrics to gauge their performance. The work focused on the efficacy of the selected models at predicting path loss values for safe operation of sec-ondary users in the chosen environment in Nigeria. The results show that no single model was able to predict the path loss consistently.
The work in [16] modeled primary system activity in Dynamic Spectrum Access (DSA) networks by aggregated ON/OFF-processes. The authors consi-dered and studied the stochastic properties of a simple primary system activity model constructed by aggregating the realizations of several semi Markov ON/OFF-models. Spectrum use in various spectrum bands at several locations in Germany and Netherlands was measured over a period of two weeks. The length of the ON- and OFF-periods of each measurement channel was evaluated. The authors could not differentiate between individual PUs and focused on the ag-gregated process meaning that if any of the PUs is in the ON-state at a given time instant, the whole spectrum is taken as being occupied, that is, to be in the ON-state. This way the overall spectrum occupancy was modeled as an ON/OFF-process obtained as a logical OR of the individual processes. The re-sults showed that by suitably selection of parameter, wide range of behaviors can be modeled, this makes the model of interest in performance evaluation of algo-rithms and protocols for DSA networks.
In [17], the work proposed a proactive spectrum access approach where SUs utilize past observations to build predictive models on spectrum availability, and intelligently plan channel usage to maximize utilization and minimize disrup-tions or interference to PUs. Based on the characteristics of TV-broadcast, a simple availability metric was developed and a usability filter was applied to eliminate unreliable channels with heavy and frequent appearance of primary users. The results showed that the proactive approach can significantly reduce the number of disruptions. It was also observed that there is a clear tradeoff be-tween the disruption rate and the throughput at SUs.
con-DOI: 10.4236/wet.2018.93005 53 Wireless Engineering and Technology
sidered [18]. The authors proposed a Markov based model to model the dura-tion of the unused spectrum on a cellular network with CDMA air interface. The proposed Markovian model was built on a simple model of the Channel Holding Time (CHT) in the primary network while the matrix-analytic techniques was also applied to derive and analyze the duration of the white spaces. The pro-posed approach was showed to be able to model very accurately situations where the CHT distribution is of a more complex type not amenable to mathematical analysis. The proposed model yields highly accurate results when the channel holding time distribution is of the lognormal type while the duration of the white spaces exhibits a low sensitivity to the distribution of the channel holding time beyond the mean.
3. Methodology
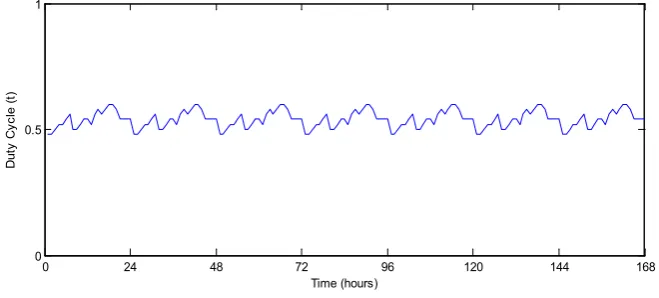
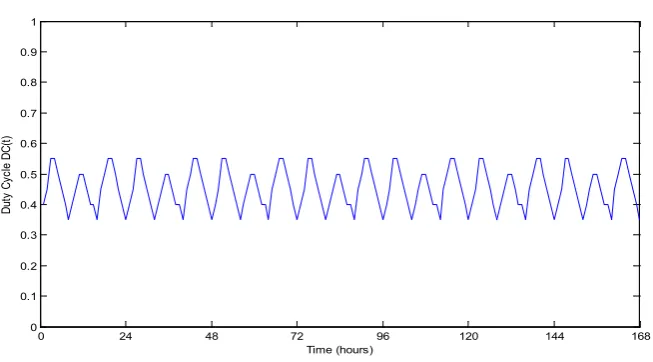
[image:5.595.208.538.561.710.2]This work assumed the spectrum usage ON/OFF (busy and idle) periods to be independently distributed from each other and the sampling interval to be greater than the Primary User’s (PU) ON/OFF times represented with “1” and “0” respectively which were formulated from the estimated duty cycle of each spectrum considered. Traffic patterns were obtained from the spectrum usage features exhibit by the PU of the spectrums considered. The traffic patterns ob-tained were simply represented as case 1, case 2, case 3 and case 4 in this paper. Case 1 shown in Figure 1 is an example of a spectrum that is constantly and consistently being used by the PUs. Case 2 presented in Figure 2 is classified as an example of channels that are constantly but not consistently being used. Both were found on spectrums that experience the same level of usage from weekdays to weekends. Other cases however experience different usages on weekdays and weekends, such instances are presented as case 3 and case 4 in this work. The data were formulated for a period of one week; twenty four hours (24 hours) a day based on the behavior of the PUs available in southwest Nigeria so as to un-derstand the shape of the patterns. Since the behavior of the TV transmitters (which in this case is the PUs) were considered, the whole channel will be de-fined as busy if the PU is currently transmitting, otherwise idle.
Figure 1. Traffic Pattern from Case 1.
0 24 48 72 96 120 144 168
0 0.5 1
Time (hours)
D
ut
y C
yc
le
(t
DOI: 10.4236/wet.2018.93005 54 Wireless Engineering and Technology
Figure 2. Traffic Pattern obtained from Case 2.
The experimental design approach adopted in this work involves using the present behavior of the primary users to predict their future behavior. This adopted approach has been used in several existing works as found in [7] [14] [19] [20] [21] [22] etc. The traffic patterns obtained from the behavior of the PUs were carefully studied and the prediction was done using the transition probabilities obtained from the spectrum usage. In the other case, future beha-viors of the primary users were also estimated using a bell shaped exponential equation.
3.1. Model Design
Secondary Users (unlicensed users) are not allowed to make use of a channel unless such a channel is idle. Our proposed model is a modification of the ap-proach in [21]. The proposed model is given in Figure 3. Each channel is sensed and data transmission commences for a particular given time. The outcome of sensing is a sequence of “0s” and “1s”. When the channel is busy, the output of the channel sensing is “1” otherwise “0”. Because the state of the channel can ei-ther be idle or busy, a discrete time two state Markov chain model was proposed as the suitable model for this system. The output of the channel sensing is then examined by the channel sensing flag. If the present state of the channel is idle, “0” is sent to the channel history otherwise the channel history is updated with “1”. In the latter case, the user must return to the sensing mode. The activities of the PUs recorded in the channel history are used to produce the traffic pattern which can either be deterministic or stochastic. Depending on the type of pat-tern generated, an appropriate prediction method will be selected. This system model accepts various models formulated for different forms of patterns and it is therefore expected that as different models are being formulated for different patterns, the model should be loaded to the system. This will make the system more robust as the robustness of such a prediction system will depend on the numbers of traffic pattern it can handle without incurring excessive errors.
Looking at the pattern, a model developed for such a pattern will be used for
0 24 48 72 96 120 144 168
0 0.1 0.2 0.3 0.4 0.5 0.6 0.7 0.8 0.9 1
Time (hours)
Du
ty
Cy
cle
DC(
DOI: 10.4236/wet.2018.93005 55 Wireless Engineering and Technology
Figure 3. The proposed model design [22].
the idle time prediction. The idle time prediction subsystem predicts the next idle period of the channel. Given the present state of the channel as idle with some set of constraints, the system is capable of predicting how long the channel will remain in an idle state. The time comparator flag compares the PU’s pre-dicted state holding time, say tp (which is the total time the PU is expected to be
absent) with the total time needed by the SU to transmit, say tc. If tc < tp, the SU
is expected to complete its transmission before the arrival of the PU and data transmission follows, else the SU is expected to switch channel and return to find another free channel.
This work focuses on the transition processes from channel history to idle time prediction. Channel sensing and channel switching were therefore not con-sidered. As discussed previously, the traffic patterns were derived from the channel history as a function of the duty cycle. The considered deterministic patterns were then used to predict the future states of the spectrum. The details of the discrete-time two-state Markov chain with appropriate Duty Cycle (DC) models adopted in this work has been presented in our previous work [22]. Here, we focused on the modified bell shaped exponential equation formulated and presented the evaluation results.
3.2. Bell Shaped Exponential Equation
DOI: 10.4236/wet.2018.93005 56 Wireless Engineering and Technology
shaped exponential equation [23] [24]. In this work, case 2 presented in Figure 2
possesses a bell curve characteristic making formulating of a bell shaped expo-nential equation necessary.
The bell shaped exponential equation is represented as [23];
( )
(
(
)
)
2 1
min 2
0
M m
m
m m
t T
t A e
σ
−=
− −
Ψ ≈ Ψ +
∑
(3.1)where;
( )
tΨ is the duty cycle at time t, Ψmin is the minimum duty cycle that can be
found on the traffic pattern, M is the total number of bells found on the traffic pattern, m is the bell index, Am is Amplitude at bell m, Tm is the period at bell m
and σm is the standard deviation at bell m.
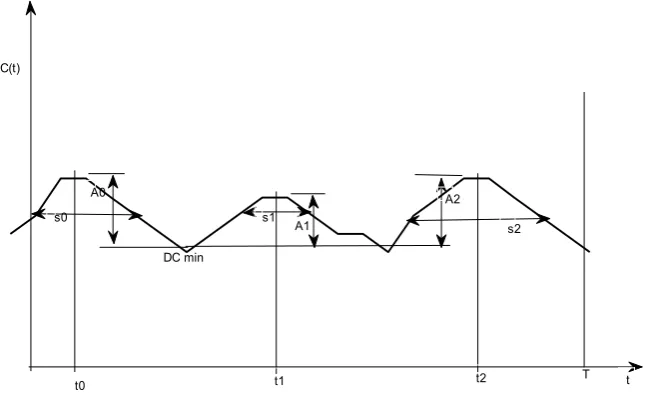
From Figure 4, it can be seen that t0≠ ≠t t1 2, σ0 ≠σ1≠σ2 and A0≠A1.
With this, a modified form of M-Bell shaped exponential equation presented in Equation (3.1) can then be derived as;
( )
(
0)
2(
1)
2(
2)
2min 0 2 1 2 2 2
0 1 2
t T t T t T
t A e A e A e
σ
σ
σ
− − − − − −
Ψ ≈ Ψ + + +
(3.2)
3.3. Performance Parameters Specification
The performances of the models were evaluated using throughput as a metric. Generated distributions were also evaluated by observing the disparities between each empirical distribution and the corresponding hypothesized distribution using Kolmogorov-Smirnov test.
3.3.1. Throughput
[image:8.595.214.537.512.712.2]Throughput is a good performance metric for the cognitive radio system and it is defined as the percentage of time during which a cognitive radio can success-fully transmit without colliding with the PU [21]. This is evaluated in this work
Figure 4. Parameters of the bell shaped exponential equation.
t0 t1 t2
s0 s1
s2 A0
A1 DC(t)
A2
T t
DOI: 10.4236/wet.2018.93005 57 Wireless Engineering and Technology
by comparing the predicted duty cycle with the empirical duty cycle. The evalua-tion was done by classifying the differences into three; False Positive, False Neg-ative and Accurate Prediction. An outcome is classified as false positive if the model predicted duty cycle (which is referred to as the probability that a channel is busy) is greater than the actual one, and false negative if otherwise. A predic-tion is said to be accurate if the predicted duty cycle is the same as the actual one. A prediction that is either false positive or accurate is classified as successful transmission since a collision with the PU in this case will be avoided. A false negative prediction is regarded as unsuccessful transmission since a collision is unavoidable in such cases. The throughput is thus calculated as:
No of successful transmission
Throughput 100
Total No of transmission
= ∗ (3.3)
Since the prediction accuracy is being tested and not how effective the channel was utilized, a modified Equation (3.3) can be written as;
No of Accurate prediction No of False Positive
Throughput 100
Total no of Prediction +
= ∗ (3.4)
3.3.2. Kolmogorov-Smirnov Test
Kolmogorov Smirnov test can be performed on any given two samples say A and
A0 with size s1 and s2 respectively if it is required to test whether such samples
come from the same distribution. If the Observed Cumulative Distribution Function (OCDF) of the sample A is A(x) and the OCDF of the sample A0 is
A0(x), then Kolmogorov-Smirnov test may be an appropriate test to determine
whether these two samples come from the same distribution. To, test the hypo-thesis that A is equal to a particular distribution A0, it is required to decide
be-tween these two hypotheses say H0 and H1[25] [26] [27] [28]:
0: 0; 1: 0
H A A H A A= ≠ (3.5)
Kolmogorov-Smirnov test statistics is given as
( )
( )
1 2, max 0
s s x
D = A x −A x (3.6) This according to the author in [25] can be used for testing the null hypothesis that the Cumulative Distribution Function (CDF) A(x) equals some hypothe-sized distribution function A0(x). Where Ds s1 2, is the least upper bound of all
point-wise differences A x
( )
−A x0( )
.Function KSDIST can be used to determine the p-value of the two-sample Kolmogorov-Smirnov test at x for samples of size say s1 and s2 and function
KSINV can also be used to determine the critical value for significance level p of the two-sample Kolmogorov-Smirnov test for samples of size s1 and s2 [25].
These two functions were evaluated using Real Statistics Functions. If Ds,∝ is
the critical value from the estimation, then P D
(
s≤Ds,∝)
= − ∝1 . Ds can be usedto test the hypothesis that a random sample came from a population with a spe-cific distribution function A(x). If
( )
0( )
,DOI: 10.4236/wet.2018.93005 58 Wireless Engineering and Technology
Then, the sample data is a good fit with A(x). Hypothesis test result on MATLAB simulation tool returns a logical value of either “0” or “1”. Value h = 1 indicates the rejection of the null hypothesis at the alpha significance level while value h = 0 indicates a failure to reject the null hypothesis at the alpha signific-ance level. Asymptotic p-value of the test is returned as a scalar value in the range (0, 1) which is interpreted as the probability of observing a test statistic as extreme as, or more extreme than, the observed value under the null hypothesis.
4. Results and Discussion
As an update on our previous work presented in [22], our major contributions in this paper are in comparing the efficacy of the two time based predictive models employed in this work in modeling the activity of the PUs in Nigeria. While the results obtained from the adoption of Markov chain model have been presented in our previous work, we focus on presenting the results obtained us-ing the proposed modified bell shaped exponential equation model and psented the details of the evaluation results. This we believe we aids future re-search in spectrum management especially in Nigeria where less rere-search have been carried out on cognitive radio networks. The simulations of four different cases were carried out. Each case represents different traffic patterns obtained from the empirical data. The empirical duty cycle was compared with the duty cycle obtained from Markov model prediction for each spectrum usage. The modified M-Bell Shaped Exponential Equation Model (MBSEM) was used as the appropriate model to predict bell curved traffic pattern observed in case 2 where M signifies the number of bell curves in the pattern. In case 2, there are three bell curves meaning case 2 is an example of a 3-bell shaped exponential curve. The parameters for each bell were extracted from the empirical duty cycles which were used as the input parameters in simulation.
The prediction output from the modified m-bell shaped exponential equation and Markov chain model were presented using duty cycle concept. The pro-posed modified m-bell shaped exponential equation used for case 2 showed a better agreement with the empirical duty cycle. Figure 5 and Figure 6 show some of the results obtained.
DOI: 10.4236/wet.2018.93005 59 Wireless Engineering and Technology
Figure 5. Prediction using Markov and duty cycle model concept for Case 1.
Figure 6. Prediction using modified m-bell shaped exponential equation.
The transition probabilities were computed from the behavior of the primary users in one period thus the transition probability remained constant for every period. For channels that are under consistent and constant usages, channels that are always busy or always idle and channels with primary users of such channels residing in one state for a long period of time before switching to another state, the changes in transition probabilities will be very negligible lead-ing to an accurate prediction from the model. Case 2 however shows few dispar-ities because some of the channels in it are not being consistently used. In such a case, the changes in transition probabilities per sweep time will be slightly dif-ferent from the transition probabilities per period leading to a less accurate pre-diction from the model. The results obtained in all cases shows a reasonable agreement with the observation in [23].
0 4 8 12 16 20 24
0 0.1 0.2 0.3 0.4 0.5 0.6 0.7 0.8 0.9 1
Time, t(hours)
Du
ty
Cy
cl
e,
DC(
t)
DOI: 10.4236/wet.2018.93005 60 Wireless Engineering and Technology
Case 3 and case 4 are special cases of spectrum usage in which the spectrum usage during the weekdays differ from the spectrum usage at weekends. This is inevitable because spectrum usage depends on the habits found in such an envi-ronment. For example, in Nigeria, TV and radio transmitter’s broadcasting pe-riod on weekdays differ from weekends. These differences can be observed on the traffic patterns of case 3 and case 4. Markov chain model was used to model the usage of the spectrum on weekdays and weekends.
Stochastic distribution models may be used to model spectrums with non-deterministic patterns. Modeling of these cases using stochastic distribution models were not considered in this work. This work however modified the ex-isting bell shaped exponential equation to model the spectrum usage presented in case 2. It was observed that, the bell shaped exponential equation model is accurate and appropriate if carefully modified for modeling any spectrum usage with bell curves characteristics regardless of the environment. In order to adopt such a model in any environment, the input parameters however must also be carefully estimated.
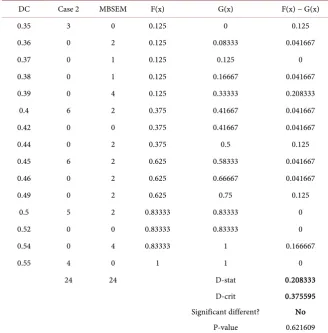
[image:12.595.210.538.583.736.2]The results obtained were evaluated using throughput and Kolmogorov Smirnov test. Table 1 shows the results of the evaluation using throughput as a metric. Since the main focus is to avoid interference with the PU activities, a transmission was termed successful if a collision with the PU was avoided else unsuccessful. Hence, a successful transmission is defined as the addition of the instance where the model makes an accurate prediction with the instance in which the model prediction is false positive (model predicted that a channel is busy while such a channel is idle). With this, Markov chain model shows the highest and lowest throughput of 95.83% and 66.67% respectively. The highest and lowest throughput drastically falls to 91.67% and 25% respectively when both successful transmission as well as effective utilization of the spectrum was considered. In this case, false positive prediction was classified as unsuccessful prediction (since an idle channel predicted to be busy leads to underutilization of the spectrum). The lowest throughputs in both cases were obtained from case 2 as expected. The modified bell shaped exponential equation model however shows a throughput of 95.83% in both circumstances for case 2.
Table 1. Performance evaluation using throughput.
Case Method False + (%) False − (%) Accurate (%) Throughput (%)
1 Markov 41.67 16.67 41.67 83.33
2 Markov 41.67 33.33 25.00 66.67
2 MBSEM 0.00 4.17 95.83 95.83
3 (Weekdays) Markov 4.16667 20.8333 75 79.17
3 (Weekends) Markov 25 8.33333 66.6667 91.67
4 (Weekdays) Markov 4.16667 4.16667 91.6667 95.83
DOI: 10.4236/wet.2018.93005 61 Wireless Engineering and Technology
Kolmogorov Smirnov test was also performed so as to determine whether there is significant difference between the empirical distributions and the pre-dicted distributions. The approach discussed in [25] [26] [27] [28] has been adopted for it ease of representation. The value of D-stat (which is the statistical difference between the two distributions) were obtained from the distributions,
D-crit (which is the critical value for significance level under which the result is valid) were also obtained. If the value for D-stat < D-crit, the hypothesis is ac-cepted else the hypothesis is rejected at the alpha significant level.
[image:13.595.208.541.322.510.2]For case 1, the D-stat obtained was 0.167, while the D-crit was 0.376. Since 0.167 < 0.376, the result is accepted at significance level of 0.05. This test was al-so used to evaluate the distributions obtained for case 2, case 3 and case 4. The test returned values for D-stat lesser than D-crit in all cases at significant level of 0.05 signifying a higher level of acceptability of this research outcome. These are depicted in Tables 2-4. Other results obtained using this test can be made avail-able on request.
Table 2. Kolmogorov Smirnov Test for Case 1.
DC Case 1 Markov F(x) G(x) |F(x) − G(x)|
0.48 2 0 0.08333 0 0.083333
0.5 3 1 0.20833 0.04167 0.166667
0.52 4 4 0.375 0.20833 0.166667
0.54 7 8 0.66667 0.54167 0.125
0.56 3 9 0.79167 0.91667 0.125
0.58 3 2 0.91667 1 0.083333
0.6 2 0 1 1 0
24 24 D-stat 0.166667
D-crit 0.375595 Significant different? No
P-value 0.860764
Table 3. Kolmogorov Smirnov Test for Case 2 distribution obtained using Markov chain model.
DC Case 2 Markov F(x) G(x) F(x) − G(x)
0.35 3 0 0.125 0 0.125
0.4 6 7 0.375 0.29167 0.083333
0.45 6 7 0.625 0.58333 0.041667
0.5 5 9 0.83333 0.95833 0.125
0.55 4 0 1 0.95833 0.041667
0.6 0 1 1 1 0
24 24 D-stat 0.125
D-crit 0.375595 Significant different? No
[image:13.595.209.539.554.730.2]DOI: 10.4236/wet.2018.93005 62 Wireless Engineering and Technology
Table 4. Kolmogorov Smirnov Test for Case 2 distribution obtained using MBSEM.
DC Case 2 MBSEM F(x) G(x) F(x) − G(x)
0.35 3 0 0.125 0 0.125
0.36 0 2 0.125 0.08333 0.041667
0.37 0 1 0.125 0.125 0
0.38 0 1 0.125 0.16667 0.041667
0.39 0 4 0.125 0.33333 0.208333
0.4 6 2 0.375 0.41667 0.041667
0.42 0 0 0.375 0.41667 0.041667
0.44 0 2 0.375 0.5 0.125
0.45 6 2 0.625 0.58333 0.041667
0.46 0 2 0.625 0.66667 0.041667
0.49 0 2 0.625 0.75 0.125
0.5 5 2 0.83333 0.83333 0
0.52 0 0 0.83333 0.83333 0
0.54 0 4 0.83333 1 0.166667
0.55 4 0 1 1 0
24 24 D-stat 0.208333
D-crit 0.375595 Significant different? No
P-value 0.621609 Note: DC means Duty Cycle. F(x) is the cumulative percentage of the empirical distribution; G(x) is the cumulative percentage of the distribution obtained using Markov chain model; D-stat is the maximum ab-solute difference between the two distributions; D-crit is the critical value.
It is hoped that, the results presented in this paper will provide useful infor-mation for Nigerian Communications Commission and any other bodies that may be interested in spectrum management in Nigeria and any other country. Furthermore, the models presented in this paper will facilitate spectrum usage with limited interference to the activities of the licensed users of the spectrum. We hope this paper will provide relevant information for future work towards enhancing spectrum usage.
The evaluation was repeated at the significance level of 0.01 with the results showing an agreement between the empirical distributions and the predicted distributions in all cases.
The higher values obtained for p-value signify the degree of validity of the re-sults. As the statistical difference between the empirical distributions and the predicted distributions increases, the p-value reduces.
DOI: 10.4236/wet.2018.93005 63 Wireless Engineering and Technology
5. Conclusion
This paper establishes a predictive model for cognitive radio spectrum availabil-ity. This research has produced a discrete time based model that is suitable for predicting the cognitive radio spectrum available in Southwest, Nigeria. The work demonstrated that, though traffic models are not appropriate to be used in the environment other than the ones, they were initially built for Markov chain based models as well as bell shaped exponential equation based models are ap-propriate to be used in any environment if the parameters were carefully ex-tracted from the data. This work has also demonstrated that, the accuracy of Markov chain models depends on the level of usage of a spectrum under consid-eration and may therefore not give desirable results when employed in some other spectrum. Bell shaped exponential equation model was also proposed as a more suitable model that will be useful in modeling spectrum that exhibits a bell shaped characteristic.
Future Research Areas
Nigeria is yet to fully make the digital switchover and it is expected that when the switchover is eventually complete, there will be a large number of spectrums that will be available for use by the unlicensed devices. Since this work expects the Nigerian Communications Commission (NCC) to adopt FCC regulations of avoiding interference with the activities of the licensed devices, it is important for the unlicensed devices to be able to accurately predict the arrival time of the licensed devices so as to leave the band before the arrival of the licensed devices. While this research has adopted the method of formulating the behavior of the licensed devices of the spectrum, this approach is not completely suitable as no system can be implemented in real life with a model that is built based on as-sumptions. Future research may therefore consider empirical data using a spec-trum analyzer to obtain more training data on the behavior of the licensed de-vices for more accuracy. In which case, the obtained threshold frequency can then be used to determine the presence of the licensed devices.
It is also important to consider patterns other than the deterministic ones considered in this work, while to avoid interference on any channel, an unli-censed device must be able to perform proactive channel switching. Channel switching was also not considered in this work and future research in this area may be a necessity.
Acknowledgements
This research did not receive any specific grant from funding agencies in the public, commercial, or not-for-profit sectors.
References
DOI: 10.4236/wet.2018.93005 64 Wireless Engineering and Technology https://doi.org/10.1016/j.phycom.2008.05.001
[2] Devanarayana, C. (2011) Predictive Channel Access in Cognitive Radio Networks Based on Variable Order Markov Models. MSc Thesis. Department of Electrical and Computer Engineering University of Manitoba Winnipeg, Manitoba R3T 5V6 Canada.
[3] Hassan, A. (2015) Brief Overview of the Cognitive Radio Technologies. Interna-tional Journal of Advanced Research in Computer Science and Software Engineer-ing, 5, 21-28.
[4] FCC (1996) Telecommunications Act of 1996. FCC Docket 96-325. Adopted on August 1, 1996 and Released on August 8, 1996.
[5] Omole, S. (2015) When Will Nigeria Sign off Digital TV Switchover? NewsNG, June 22, 2015.
https://guardian.ng/features/media/it-is-not-news-that-nigeria-failed-to-meet-up-w ith-the-digital-tv-transition-deadline-of-june-17-2015-but-the-question-of-when-ex
actly-the-countrys-digitization-process-which-officially-be/
[6] Lopez-Benitez, M. and Casadevall, F. (2013) Time-Dimension Models of Spectrum Usage for the Analysis, Design, and Simulation of Cognitive Radio Networks. IEEE Transactions on Vehicular Technology, 62, 2091-2104.
https://doi.org/10.1109/TVT.2013.2238960
[7] Geirhofer, S., Tong, L. and Sadler, B. (2006) A Measurement-Based Model for Dy-namic Spectrum Access in WLAN Channels. IEEE Military Communications Con-ference, Washington, DC, 23-25 October 2006,1-7.
[8] Ilango, V., Uma, I. and Nitya, R. (2015) Time Series Data Mining Research Prob-lem, Issues, Models, Trends and Tools. International Journal of Computer Engi-neering and Applications, 9, 3-8.
[9] Afrin, N., Zhang, Y. and Chen, J.K. (2015) Uncertainty Analysis of Melting and Re-solidification of Gold Film Irradiated by Nano-to Femtosecond Lasers Using Sto-chastic Method. arXivpreprint arXiv:1510.00256
[10] Cabric, D., Mishra, S. and Brodersen, R. (2004) Implementation Issues in Spectrum Sensing for Cognitive Radios. Conference Record of the 38th Asilomar Conference on Signals, Systems and Computers, Pacific Grove, CA, 7-10 November 2004, Vol. 1, 772-776. https://doi.org/10.1109/ACSSC.2004.1399240
[11] López-Benítez, M. and Casadevall, F. (2017) Space-Dimension Models of Spectrum Usage for Cognitive Radio Networks. IEEE Transactions on Vehicular Technology, 66, 306-320.
[12] Lopez-Benitez, M. and Casadevall, F. (2014) Spectrum Usage in Cognitive Radio Networks: From Field Measurements to Empirical Models. IEICE Transactions on Communications, 97, 242-250.
[13] Mehdi, G., Shahrzad, I., Reza, G. and Mohammadreza, A. (2014) A Learning Auto-mata-Based Spectrum Prediction Technique for Cognitive Radio Networks. Inter-national Transaction of Electrical and Computer Engineers System, 2, 93-97. [14] Najashi, B., Wenjiang, F. and Almustapha, M. (2014) Spectrum Hole Prediction
Based on Historical Data: A Neural Network Approach. arXiv Preprint Ar-xiv:1401.0886
[15] Faruk, N., Ayeni, A. and Adediran, Y. (2013) On the Study of Empirical Path Loss Models for Accurate Prediction of TV Signal for Secondary Users. Progress in Elec-tromagnetic Research (PIER) B, 49, 155-176.
DOI: 10.4236/wet.2018.93005 65 Wireless Engineering and Technology [16] Wellens, M., Riihijärvi, J. and Mähönen, P. (2009) Modelling Primary System Ac-tivity in Dynamic Spectrum Access Networks by Aggregated ON/OFF-Processes. 2009 6th IEEE Annual Communications Society Conference on Sensor, Mesh and Ad Hoc Communications and Networks Workshops, Rome, Italy, 22-26 June 2009, 1-6. https://doi.org/10.1109/SAHCNW.2009.5172946
[17] Kumar, P.A., Singh, S. and Zheng, H. (2006) Reliable Open Spectrum Communica-tions through Proactive Spectrum Access. Proceedings of the First International Workshop on Technology and Policy for Accessing Spectrum, Boston, Massachu-setts, USA, 5 August 2006, 5. https://doi.org/10.1145/1234388.1234393
[18] Pla, V., Vidal, J., Martinez-Bauset, J. and Guijarro, L. (2010) Modeling and Charac-terization of Spectrum White Spaces for Underlay Cognitive Radio Networks. 2010
IEEE International Conference on Communications, Cape Town, South Africa, 23-27 May 2010, 1-5.
[19] Clancy, T. and Walker, B. (2006) Predictive Dynamic Spectrum Access. Proceedings
of SDR Forum Technical Conference, Orlando, Florida, USA, November 2006. [20] Wellens, M. and Mähönen, P. (2010) Lessons Learned from an Extensive Spectrum
Occupancy Measurement Campaign and a Stochastic Duty Cycle Model. Mobile Networks and Applications, 15, 461-474. https://doi.org/10.1007/s11036-009-0199-9
[21] Höyhtyä, M., Pollin, S. and Mämmelä, A. (2011) Improving the Performance of Cognitive Radios through Classification, Learning, and Predictive Channel Selec-tion. Advances in Electronics and Telecommunications, 2, 28-38.
[22] Oluwaranti, A. and Okegbile, S. (2016) Two State Markov Chain Based Predictive Model for Cognitive Radio Spectrum Availability: A Conceptual Approach. 2016
Future Technologies Conference (FTC), San Francisco, CA, USA, 6-7 December 2016, 179-186. https://doi.org/10.1109/FTC.2016.7821608
[23] López-Benítez, M. and Casadevall, F. (2011) Discrete-Time Spectrum Occupancy model Based on Markov Chain and Duty Cycle Models. 2011 IEEE International Symposium on Dynamic Spectrum Access Networks (DySPAN), Aachen, Germany, 3-6 May 2011, 90-99. https://doi.org/10.1109/DYSPAN.2011.5936273
[24] Umebayashi, K., Kobayashi, M. and López-Benítez, M. (2018) Efficient Time Do-main Deterministic-Stochastic Model of Spectrum Usage. IEEE Transactions on Wireless Communications, 17, 1518-1527.
https://doi.org/10.1109/TWC.2017.2779511
[25] Real Statistics (2018) Two Sample Kolmogorov-Smirnov Test. Real Statistics Using Excel. http://www.real-statistics.com/non-parametric-tests
[26] Zaiontz, C. (2014) Two Sample Kolmogorov-Smirnov Test. A Publication of Real Statistics. http://www.real-statistics.com/non-parametric-tests
[27] Xiao, Y. (2017). A Fast Algorithm for Two-Dimensional Kolmogorov-Smirnov Two Sample Tests. Computational Statistics & Data Analysis, 105, 53-58.
https://doi.org/10.1016/j.csda.2016.07.014
![Figure 3. The proposed model design [22].](https://thumb-us.123doks.com/thumbv2/123dok_us/9281184.421417/7.595.58.539.73.381/figure-the-proposed-model-design.webp)