ISSN Online: 2162-2086 ISSN Print: 2162-2078
DOI: 10.4236/tel.2018.811145 Aug. 9, 2018 2220 Theoretical Economics Letters
Study on the Threshold Effect of Urbanization
on Energy Consumption
Xiaoyu Liu, Duyun Peng
*School of Statistics, Jiangxi University of Finance and Economics, Nanchang, China
Abstract
Energy is an important material impetus for urbanization, while urbanization is also key factors that stimulate the energy consumption increase. The rapid development of China’s urbanization in recent years has led to changes in the total energy consumption and structure, which will inevitably affect the reali-zation of China’s rapid and sustainable economic development goals. There-fore, this article was based on panel data from 2005 to 2016 of 30 provinces in China, used energy consumption as the explained variable, the urbanization rate as the core variable, GDP per capita as threshold variables, and selected GDP per capita, industrialization level, urban per capita disposable income, the density of urban population, the proportion of the tertiary industry as control variables. Meanwhile, the threshold model was used to study the threshold effect. We put focus on the nonlinear relationship between urbani-zation and energy consumption and the corresponding regional differences and hope to make reasonable suggestions for optimizing the industrial struc-ture and finally realizing the coordinated development of urbanization and energy consumption in China. The results show that in the accelerated stage of economic development, the main impact of urbanization is to accelerate the increase of energy consumption. When the level of economic develop-ment enters the post-industrialization stage, the stimulation of urbanization on energy consumption becomes smaller, which means that the urbanization transformation will face great pressure on energy consumption. Therefore, this paper considered China in three areas, eastern, middle and western areas to transversely compare and analyze, and put forward three rationalization proposals: To speed up the marketization of construction, promote economic development of the western and middle region, and narrow the gap of urba-nization development of areas; to coordinate urbaurba-nization development and energy consumption in the eastern and western regions, accelerate industrial restructure in the middle and western regions, and promote sound and rapid urbanization; to grasp the law of urbanization’s effect on energy consumption How to cite this paper: Liu, X.Y. and
Peng, D.Y. (2018) Study on the Threshold Effect of Urbanization on Energy Con-sumption. Theoretical Economics Letters, 8, 2220-2232.
https://doi.org/10.4236/tel.2018.811145
Received: June 29, 2018 Accepted: August 6, 2018 Published: August 9, 2018
Copyright © 2018 by authors and Scientific Research Publishing Inc. This work is licensed under the Creative Commons Attribution International License (CC BY 4.0).
http://creativecommons.org/licenses/by/4.0/
DOI: 10.4236/tel.2018.811145 2221 Theoretical Economics Letters and control the trend of energy consumption.
Keywords
Urbanization, Energy Consumption, Threshold Effect, Regional Difference
1. Introduction
DOI: 10.4236/tel.2018.811145 2222 Theoretical Economics Letters analyzes the relationship between urbanization and energy consumption, then investigates the changes of the per capita GDP in the eastern, middle and west-ern China based on the threshold value, and finally put forward policy sugges-tions giving consideration to economic development and energy conservation to reduce energy consumption, promote the coordinated development of energy and economic.
2. Theoretical Background
At present, our country is in the important stage of rapid economic develop-ment, upgrading industrial structure and accelerating the urbanization process, domestic and foreign scholars have made fruitful results about researches on re-lationship between urbanization and energy consumption. By collating the ex-isting literature, Wang Lei, etc. [1] and Ma Hailiang [2] both argue that the ur-banization development plays a positive role in promoting energy consumption, so as to facilitate the intensive development of the energy consumption. Mad-lener and Sunak [3] studied from another perspective, pointing out that the energy consumption growth of countries in the stage of rapid urbanization is more significant.
However, Liu Jianghua et al. [4] used scenario analysis to draw the conclusion that the two goals of domestic urbanization and total energy consumption can-not be achieved at the same time. In the Suffering from this paradox, Wang Chongmei [5], Li Bin, Cao Wanlin [6] respectively analyzed the decoupling rela-tionship between China’s economic growth and energy consumption, ecological stress, pollution. Li Posong, Zhu Tan [7] introduced the theory of energy de-coupling into urban planning, put forward corresponding technical ways of ur-ban industrial development energy-saving evaluation, and provided a reference for future urbanization development path.
DOI: 10.4236/tel.2018.811145 2223 Theoretical Economics Letters above, the existing researches have provided the certain theoretical basis for un-derstanding the relationship between urbanization and energy consumption, but there are still some deficiencies: most scholars failed to consider that urbaniza-tion has both positive and negative effects, that is to say, the threshold effect, on energy consumption in different stages of economic development. About Re-search carrier, some of the literatures use cross-section data to compare energy consumption statically and transversely between areas and are lack of time se-quence analysis of the evolution of phased energy consumption, ignoring the nature of dynamic change of urbanization.
Therefore, this paper attempts to further expand from the following two as-pects: 1) Based on the provincial panel data from 2005 to 2016, this paper chooses China’s 30 provinces, cities and autonomous regions as the research ob-ject, uses the per capita as a threshold variable to construct threshold model, se-lects per capita GDP, Level of Industrialization, Urban Population Density, the proportion of the tertiary industry, Educational Level, Per Capita Budgetary Ex-penditure as control variables, and conducts empirical researches on the urbani-zation impact on energy consumption; 2) In order to provide theoretical guid-ance for the linkage development of various provinces in China, this paper in-vestigates the changes of the per capita GDP in the eastern, middle and western China.
3. Data Selection and Description
3.1. Selection of the Variables
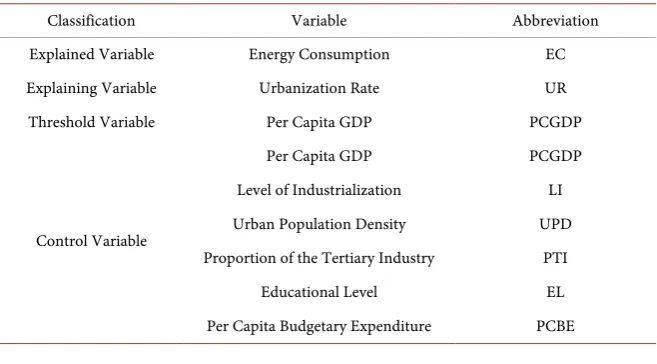
[image:4.595.210.539.553.735.2]Based on the previous research and current situation, this paper chooses data from 2005 to 2016 of China’s 30 provinces, cities and autonomous regions, se-lects the following variables: Energy Consumption, Urbanization Rate, per capita GDP, Level of Industrialization, Urban Population Density, the proportion of the tertiary industry, Educational Level, Per Capita Budgetary Expenditure. De-tails are presented in Table 1.
Table 1. Reports the evaluation index of self-organization ability of regional innovation system.
Classification Variable Abbreviation
Explained Variable Energy Consumption EC
Explaining Variable Urbanization Rate UR
Threshold Variable Per Capita GDP PCGDP
Control Variable
Per Capita GDP PCGDP
Level of Industrialization LI Urban Population Density UPD Proportion of the Tertiary Industry PTI
Educational Level EL
DOI: 10.4236/tel.2018.811145 2224 Theoretical Economics Letters 1) Energy Consumption: On the one hand, energy, as an important material basis for economic development and people’s livelihood, plays an important role in promoting the development of urbanization. On the other hand, the problems of carbon emission and haze pollution caused by energy consumption have fur-ther increased the construction cost of urbanization. Therefore, energy con-sumption should put more emphasis on green and sustainability. In this paper, the total energy consumption is used to represent the energy consumption indi-cators. The unit is 100 million tons of standard coal.
2) Urbanization Rate: The differences in the urbanization process are closely related to the unbalanced distribution of energy consumption. The urbanization rate plays an indirect but important role in the energy consumption of a region. In this paper, it is calculated by the proportion of urban population to total pop-ulation.
3) PCGDP: PCGDP can be used to measure the level of economic develop-ment in a region, while the lower level of economic developdevelop-ment has less impact on the scale of energy consumption. With the gradual development of the economy, the impact on the scale of energy consumption will also increase. In this paper, PCGDP is used as the threshold variable to explain the impact of ur-banization on energy consumption under different economic scales.
4) Level of Industrialization: The level of industrialization is expressed by the proportion of industrial added value to GDP.
5) Urban Population Density: The most prominent feature of urbanization is the change of urban population density caused by urbanization of agricultural population. It is expressed by the proportion of the number of urban population to urban areas.
6) The Proportion of the Tertiary Industry: With the continuous transforma-tion and upgrading of populatransforma-tion, lifestyle and consumptransforma-tion habits, the optimi-zation of industrial structure can improve the level of urbanioptimi-zation. In this pa-per, it is expressed by the proportion of tertiary industry to GDP.
7) Educational Level: It is expressed by the number of undergraduate students. 8)Per Capita Budgetary Expenditure: Urbanization development brings up people’s income level, accordingly, their demand for welfare of the people’s live-lihood and social security level will also be increased, so the government should also correspondingly increase in fiscal expenditure to realize effective supply of public products and services.
Control variables: According to the previous researches of scholars, control variables should include per capita GDP, Level of Industrialization, Urban Per Capita Disposable Income, Urban Population Density, the proportion of the ter-tiary industry, Educational Level, Per Capita Budgetary Expenditure.
DOI: 10.4236/tel.2018.811145 2225 Theoretical Economics Letters Capita Budgetary Expenditure.
3.2. Data Resource
The data are mainly from the “China Energy Statistics Yearbook”, “China Statis-tical Yearbook”, “China Urban Statistics Yearbook” from 2005 to 2016. The study object is China’s 30 provinces and autonomous regions and municipalities, because the data are from the yearbook statistics, are single-handed information, the reliability and validity of the data have been tested. The method adopted in it is using SPSS20.0 to replace the partial missing data by average, then making the logarithm of the data. Moreover, it needs to be noted that the sample includes panel data from 30 provinces in China, in which data on energy consumption in Tibet are missing and removed. In addition, the research range of this paper was selected from 2005 to 2016, mainly for the following reasons: 1) The availability of data. Some of the key variables used in the study do not have complete annual data until 2005, and the data for 2017 has not yet been released. 2) It is related to the research topic. This paper mainly studies the how urbanization influences energy consumption, due to the recent ten years of rapid development of re-gional economy, energy consumption problems caused by urbanization are much more serious than the past, so many scholars’ similar researches are mainly during this time, so this paper also studies the problem of this period. In conclusion, considering the availability of variables’ data and the research theme, this paper selects data from 30 provinces in China from 2005 to 2016 for re-search on the basis of referring to previous studies.
4. Empirical Analysis
4.1. Descriptive Statistics
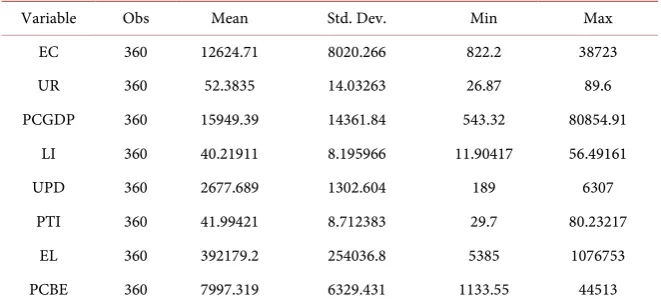
First, descriptive statistics of each variable are carried out. Import the specific data of the above variables into Stata 14 and run the corresponding program to get the basic conditions of the mean, maximum, minimum, standard deviation and etc. of each variable, and Table 2 displays the descriptive statistics on all va-riables over 2005 to 2016. All vava-riables have 360 observations respectively. UR is 52.38% on average, PCBE is 7997.319, UPD is 2677.69 people/km2. The gap
between extreme value of PCGDP is the largest. All these show objective reali-ties that China’s large population and large UPD, low urbanization level and so on.
4.2. Unit Root Test
DOI: 10.4236/tel.2018.811145 2226 Theoretical Economics Letters
Table 2. Results of data descriptive statistics.
Variable Obs Mean Std. Dev. Min Max
EC 360 12624.71 8020.266 822.2 38723
UR 360 52.3835 14.03263 26.87 89.6
PCGDP 360 15949.39 14361.84 543.32 80854.91
LI 360 40.21911 8.195966 11.90417 56.49161
UPD 360 2677.689 1302.604 189 6307
PTI 360 41.99421 8.712383 29.7 80.23217
EL 360 392179.2 254036.8 5385 1076753
PCBE 360 7997.319 6329.431 1133.55 44513
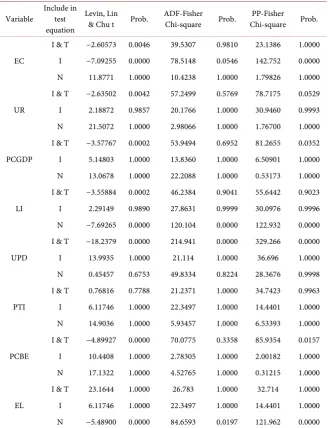
6.0, applies Levin, Lin & Chu t, ADF-Fisher Chi-square, PP-Fisher Chi-square to determine whether each variable has a unit root. Test results are shown in Table 3.
As can be seen from Table 3, all variables are stable sequences and meet the threshold regression modeling conditions.
4.3. Hausman Test
Panel data model can be divided into fixed effect model and random effect mod-el. Usually, Hausman Test is used to select the modmod-el. Hausman Test hypothesis.
The null hypothesis H0: The model is a random effect model;
The alternative hypothesis H1: The model is a fixed effect model.
In this paper, Stata 14.0 is used for Hausman Test. When the significance level is 5%, the p value is 0.0000. Therefore, the null hypothesis H0 is strongly rejected
and the fixed effect threshold regression model should be adopted.
4.4. Estimated Results of Threshold Effect
Logarithmic processing of data can reduce the large fluctuation of data without changing the estimation trend of the model. In this paper, the data of PCGDP and UPCDI are processed by logarithm in the model, which makes the model more convincing.
As shown in Table 4, Taking PCGDP as the threshold variable, the number of “self-sampling” was 360 times, and the p values of single threshold and double threshold were 0.0000 and 0.0057 respectively, both with significant test results. However, the test results for the triple threshold were not signifi-cant. Therefore, the double threshold model is selected to analyze the rela-tionship between urbanization and energy consumption. Through the inspec-tion result showed in Table 5, it can be concluded that there are two threshold values, 6188.8999 and 9266.3896.The corresponding 95% confidence interval is respectively [6169.7500, 6268.0098] and [9251.1504, 9273.4600].
DOI: 10.4236/tel.2018.811145 2227 Theoretical Economics Letters
Table 3. Unit root test of variables.
Variable Include in test equation
Levin, Lin
& Chu t Prob. ADF-Fisher Chi-square Prob. Chi-square PP-Fisher Prob.
EC
I & T −2.60573 0.0046 39.5307 0.9810 23.1386 1.0000 I −7.09255 0.0000 78.5148 0.0546 142.752 0.0000 N 11.8771 1.0000 10.4238 1.0000 1.79826 1.0000
UR
I & T −2.63502 0.0042 57.2499 0.5769 78.7175 0.0529 I 2.18872 0.9857 20.1766 1.0000 30.9460 0.9993 N 21.5072 1.0000 2.98066 1.0000 1.76700 1.0000
PCGDP
I & T −3.57767 0.0002 53.9494 0.6952 81.2655 0.0352 I 5.14803 1.0000 13.8360 1.0000 6.50901 1.0000 N 13.0678 1.0000 22.2088 1.0000 0.53173 1.0000
LI
I & T −3.55884 0.0002 46.2384 0.9041 55.6442 0.9023 I 2.29149 0.9890 27.8631 0.9999 30.0976 0.9996 N −7.69265 0.0000 120.104 0.0000 122.932 0.0000
UPD
I & T −18.2379 0.0000 214.941 0.0000 329.266 0.0000 I 13.9935 1.0000 21.114 1.0000 36.696 1.0000 N 0.45457 0.6753 49.8334 0.8224 28.3676 0.9998
PTI
I & T 0.76816 0.7788 21.2371 1.0000 34.7423 0.9963 I 6.11746 1.0000 22.3497 1.0000 14.4401 1.0000 N 14.9036 1.0000 5.93457 1.0000 6.53393 1.0000
PCBE
I & T −4.89927 0.0000 70.0775 0.3358 85.9354 0.0157 I 10.4408 1.0000 2.78305 1.0000 2.00182 1.0000 N 17.1322 1.0000 4.52765 1.0000 0.31215 1.0000 I & T 23.1644 1.0000 26.783 1.0000 32.714 1.0000 EL I 6.11746 1.0000 22.3497 1.0000 14.4401 1.0000 N −5.48900 0.0000 84.6593 0.0197 121.962 0.0000
[image:8.595.208.541.566.634.2]I & T represents Individual Intercept and Trend, I represents Individual Intercept, N represents None.
Table 4. Threshold effect test.
Threshold F-stat Prob Crit10 Crit5 Crit1
Single 10.72 0.0000 5.4375 9.9649 16.3829
Double 27.29 0.0057 9.2289 12.7753 23.3909
Triple 8.65 0.5433 14.2749 20.2289 53.7285
Table 5. Threshold estimator (level = 95).
Mode 1 Threshold 95% Conf. Interval
Th1 6188.8999 [6169.7500, 6268.0098]
[image:8.595.210.538.667.716.2]DOI: 10.4236/tel.2018.811145 2228 Theoretical Economics Letters
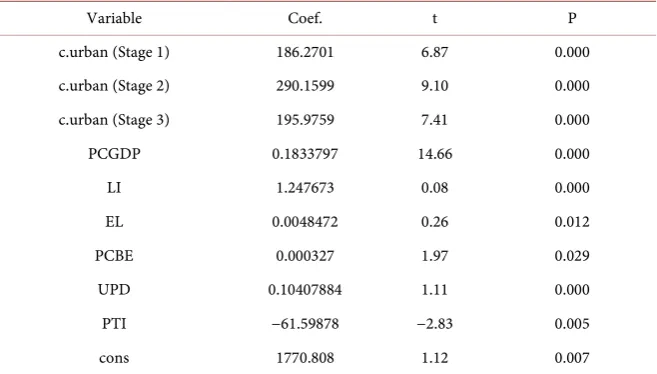
Table 6. Model estimation results.
Variable Coef. t P
c.urban (Stage 1) 186.2701 6.87 0.000
c.urban (Stage 2) 290.1599 9.10 0.000
c.urban (Stage 3) 195.9759 7.41 0.000
PCGDP 0.1833797 14.66 0.000
LI 1.247673 0.08 0.000
EL 0.0048472 0.26 0.012
PCBE 0.000327 1.97 0.029
UPD 0.10407884 1.11 0.000
PTI −61.59878 −2.83 0.005
cons 1770.808 1.12 0.007
and coefficient estimators of three stages are significant at the 0.01 level, and all are positive. But the coefficient estimators reduce with the increase of phase, which means that the increase of the urbanization rate can promote energy con-sumption, but the effect gradually decreased. That is to say, when using PCGDP as the threshold variable to divide the stage, the relationship curve between ur-banization level and energy consumption is increasing but decreasing with the increase of stage.
By observing other control variables, we can find that: 1) LI is significant at the level of 0.01 and has a positive correlation with energy consumption. As mentioned above, China’s current national conditions, urbanization is built on the basis of high energy consumption, and industry is the main force of energy consumption. 2) PCBE is positively related with energy consumption, but the results are not significant, on the one hand may be because the control index se-lection is not reasonable, on the other hand, maybe we have chosen PCGDP so lead to the PCBE variable influence; 3) PTI is negatively correlated with energy consumption, which is significant at the level of 0.01. The Increase of PTI means that the structure optimization of economic development, energy consumption reduction and efficiency enhancement, which may have inhibitory effect on energy consumption.
DOI: 10.4236/tel.2018.811145 2229 Theoretical Economics Letters
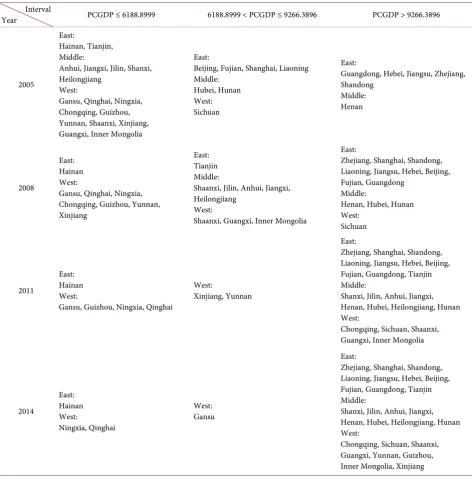
Table 7. Eastern, middle and western provinces across the threshold value. Interval
Year PCGDP ≤ 6188.8999 6188.8999 < PCGDP ≤ 9266.3896 PCGDP > 9266.3896
2005
East:
Hainan, Tianjin, Middle:
Anhui, Jiangxi, Jilin, Shanxi, Heilongjiang
West:
Gansu, Qinghai, Ningxia, Chongqing, Guizhou, Yunnan, Shaanxi, Xinjiang, Guangxi, Inner Mongolia
East:
Beijing, Fujian, Shanghai, Liaoning Middle:
Hubei, Hunan West: Sichuan
East:
Guangdong, Hebei, Jiangsu, Zhejiang, Shandong Middle: Henan 2008 East: Hainan West:
Gansu, Qinghai, Ningxia, Chongqing, Guizhou, Yunnan, Xinjiang
East: Tianjin Middle:
Shaanxi, Jilin, Anhui, Jiangxi, Heilongjiang
West:
Shaanxi, Guangxi, Inner Mongolia
East:
Zhejiang, Shanghai, Shandong, Liaoning, Jiangsu, Hebei, Beijing, Fujian, Guangdong
Middle:
Henan, Hubei, Hunan West: Sichuan 2011 East: Hainan West:
Gansu, Guizhou, Ningxia, Qinghai
West:
Xinjiang, Yunnan
East:
Zhejiang, Shanghai, Shandong, Liaoning, Jiangsu, Hebei, Beijing, Fujian, Guangdong, Tianjin Middle:
Shanxi, Jilin, Anhui, Jiangxi, Henan, Hubei, Heilongjiang, Hunan West:
Chongqing, Sichuan, Shaanxi, Guangxi, Inner Mongolia
2014 East: Hainan West: Ningxia, Qinghai West: Gansu East:
Zhejiang, Shanghai, Shandong, Liaoning, Jiangsu, Hebei, Beijing, Fujian, Guangdong, Tianjin Middle:
Shanxi, Jilin, Anhui, Jiangxi, Henan, Hubei, Heilongjiang, Hunan West:
Chongqing, Sichuan, Shaanxi, Guangxi, Yunnan, Guizhou, Inner Mongolia, Xinjiang
second, the western least, and the number of provinces across the third stage is smaller.
DOI: 10.4236/tel.2018.811145 2230 Theoretical Economics Letters development in different areas. China should allocate regional resources rea-sonably so that three regions can develop in a coordinated manner.
Combined with results of Table 6, it also can be seen that many provinces achieved a phase-crossing in 2008, so 2008 is the point of a structural change. Moreover, the relationships among economic growth, urbanization and energy consumption are: 1) Before 2008, the urbanization and economic growth are complementary to each other, and with the rise of energy-intensive industries, energy consumption is increasing; 2) After 2008, the urbanization and economic growth still have a positive effect on each other. Although there is still an inten-sive degree of energy consumption, it does slow, which shows that China’s in-dustrial structure has been adjusted, and proves that the country’s ma-cro-policies such as energy conservation and emission reduction industrial structure optimization have certain effects.
5. Conclusions and Implications
In this paper, the provincial panel data from 2005 to 2014 of 30 provinces were analyzed, PCGDP was used as threshold variable, using the method of fixed point for threshold. The relations between urbanization rate and the energy consumption were discussed. Hope the result can provide some supporting ma-terials and advices for further studies.
This paper examines the threshold effect of urbanization on energy consump-tion; however, due to the limitation of data resource and conditions, the research is still insufficient and needs to be further explored. The research object of this paper is mainly the total energy consumption, and not related to energy effi-ciency, energy consumption elasticity coefficient index, which need to be strengthened in the future study. In addition, the research of this paper is just based on a macro level to get a national economic threshold value. Given that the regional economic development and energy consumption of large differenc-es, it still should study the actual threshold value according to local actual condi-tion. And it is of more practical value for the development through researches of how to determine the actual economic growth rate and energy consumption growth rate by the actual threshold value of each region.
5.1. Conclusions
The country was divided into the eastern and western regions according to PCGDP, and the conclusions were as follows.
1) At different stages of economic development, urbanization promotes ener-gy consumption.
2) Combined with the specific parameter estimation results, the double thre-shold effect is significant. When PCGDP is used as the threthre-shold variable, the two threshold values are 6188.8999 yuan and 9266.3896 yuan respectively.
DOI: 10.4236/tel.2018.811145 2231 Theoretical Economics Letters that of the middle and western regions. The urbanization level in the middle re-gion is different from that in the east, but it is also better than that in the west. The urbanization development in western China is relatively slow and the level is relatively low. The urbanization level between regions performs in a form of echelon.
5.2. Policy Advice
To sum up, the following suggestions are proposed.
1) Accelerate the coordinated development of all provinces and narrow the differences in urbanization development. In the allocation of resources, the market plays a decisive role in automatically adjusting the coordinated develop-ment of economy, population and energy. To coordinate eastern, middle and western urbanization and energy consumption, all provinces should pay atten-tion to complementary resources and industrial advantages, the western region should introduce advanced technology and equipment, and the eastern takes the best of its natural resources and labor advantages, etc.
2) Promote the upgrading of industrial structure and the development of ur-banization with low energy consumption. Optimize the industrial structure, ac-celerate the development of high-tech industries and services, appropriately in-crease the share of the tertiary industry, improve energy utilization efficiency, advocate the enterprise introduces the high efficiency and energy saving equip-ment, reduce the traditional high energy consumption industries such as coal, and promote development of new and high technology industries such as soft-ware and information services.
3) Grasp the law of urbanization’s effect on energy consumption and control the energy consumption trend. When the urbanization rate has not passed the first threshold value, on the premise of controlling the total energy consumption, we should pay attention to the speed of urbanization development and give full play to the positive role of urbanization in the economy. When urbanization rate breaks through the second threshold value, we should pay attention to the de-velopment of the urbanization rate quality, improve the efficiency of energy use, as far as possible to prevent the development of urbanization have serious nega-tive effect on energy consumption.
Conflicts of Interest
The authors declare no conflicts of interest regarding the publication of this pa-per.
References
[1] Wang, L. and Wei, H.K. (2014) An Empirical Study on the Impact of Urbanization on Energy Consumption in China. Resource Science, No. 36, 1235-1243.
DOI: 10.4236/tel.2018.811145 2232 Theoretical Economics Letters [3] Madlener, R. and Sunak, Y. (2011) Impacts of Urbanization on Urban Structures
and Energy Demand: What Can We Learn for Urban Energy Planning and Urbani-zation Management? Sustainable Cities and Society, No. 11, 45-53.
[4] Liu, J.H., Shao, S. and Jiang, X. (2015) Effect of Urbanization on Energy Consump-tion: How Far Are We from the World Level? Comparative Analysis Based on In-ternational and Domestic Data. Journal of Finance and Economics, No. 2, 111-122. [5] Wang, C.M. (2012) Study on the “Decoupling” Relationship between Regional
Eco-Environmental Pressure and Economic Development—Take Jiaodong Penin-sula as An Example. Journal of Natural Science of Hunan Normal University, No. 1, 95-98.
[6] Li, B. and Cao, W.L. (2014) Decoupling Analysis of Economic Development from Environmental Pollution. Economics Information, No. 7, 48-56.
[7] Li, P.S. and Zhu, T. (2014) Study on Strategic Environmental Assessment of Urban Plan Based on Energy Decoupling Theory. Ecological Economy, No. 30, 16-19. [8] Guan, X.L. and Zhou, M. (2015) Decoupling Analysis of Economic Growth and
Energy Consumption in the Course of Urbanization. Exploration of Economic Problems, No. 4, 88-93.
[9] Ma, H.L., Wang, R.M., Ding, Y.Q. and Zhang, H.Y. (2017) A Study on the Thre-shold Effect of Urbanization on Industrial Energy Consumption—A Case Study of the Yangtze River Economic Belt. China’s Population Resources and Environment, No. 27, 56-62.