research communications
Acta Cryst.(2017). E73, 1001–1008 https://doi.org/10.1107/S2056989017008064
1001
Received 24 May 2017Accepted 31 May 2017
Edited by W. T. A. Harrison, University of Aberdeen, Scotland
‡ Additional correspondence author, e-mail: [email protected].
Keywords:crystal structure; zinc; hydrogen bonding; thiosemicarbazone; Hirshfeld surface analysis.
CCDC reference:1553218
Supporting information:this article has supporting information at journals.iucr.org/e
Bis(
N
000-{(
E
)-[(2
E
)-1,3-diphenylprop-2-en-1-ylidene]-amino}-
N
-ethylcarbamimidothioato-
j
2N
000,
S
)zinc(II):
crystal structure and Hirshfeld surface analysis
Ming Yueh Tan,a,bKaren A. Crouse,cThahira B. S. A. Ravoof,a‡ Mukesh M. Jotanid and Edward R. T. Tiekinke*
aDepartment of Chemistry, Faculty of Science, Universiti Putra Malaysia, 43400 UPM Serdang, Selangor Darul Ehsan,
Malaysia,bDepartment of Physical Sciences, Faculty of Applied Sciences and Computing, Tunku Abdul Rahman, University College, 50932 Setapak, Kuala Lumpur, Malaysia,cDepartment of Chemistry, Faculty of Science, Universiti Putra Malaysia, 43400 UPM Serdang, Selangor Darul Ehsan, Malaysia, Department of Chemistry, St Francis Xavier University, PO Box 5000, Antigonish, NS, Canada, B2G 2W5,dDepartment of Physics, Bhavan’s Sheth R. A. College of Science, Ahmedabad, Gujarat 380 001, India, andeResearch Centre for Crystalline Materials, School of Science and Technology, Sunway University, 47500 Bandar Sunway, Selangor Darul Ehsan, Malaysia. *Correspondence e-mail: [email protected]
The title ZnII complex, [Zn(C18H18N3S)2], (I), features two independent but
chemically equivalent molecules in the asymmetric unit. In each, the thiosemicarbazonate monoanion coordinates the ZnIIatom viathe thiolate-S and imine-N atoms, with the resulting N2S2 donor set defining a distorted
tetrahedral geometry. The five-membered ZnSCN2chelate rings adopt distinct
conformations in each independent molecule,i.e.one ring is almost planar while the other is twisted about the Zn—S bond. In the crystal, the two molecules comprising the asymmetric unit are linked by amine-N—H N(imine) and amine-N—H S(thiolate) hydrogen bondsviaan eight-membered heterosyn-thon, { HNCN HNCS}. The dimeric aggregates are further consolidated by benzene-C—H S(thiolate) interactions and are linked into a zigzag supra-molecular chain along thecaxisviaamine-N—H S(thiolate) hydrogen bonds. The chains are connected into a three-dimensional architectureviaphenyl-C— H (phenyl) and–interactions, the latter occurring between chelate and phenyl rings [inter-centroid separation = 3.6873 (11) A˚ ]. The analysis of the Hirshfeld surfaces calculated for (I) emphasizes the different interactions formed by the independent molecules in the crystal and the impact of the–
interactions between chelate and phenyl rings.
1. Chemical context
Thiosemicarbazone molecules, derived from thiosemi-carbazide, H2N—NH—C( S)—NH2, constitute an important
class of mixed hard–soft, nitrogen–sulfur donor ligands which have been extensively investigated in their coordination chemistry towards both transition metals (Lobanaet al., 2009) and main group elements (Casas et al., 2000). Complexes of thiosemicarbazones, including ZnIIcomplexes (Da Silvaet al., 2013), have been evaluated variously as potential anti-cancer (Afrasiabi et al., 2003), anti-viral (Garoufis et al., 2009) and anti-bacterial (Quiroga & Ranninger, 2004) therapeutics for over 50 years (Dilworth & Hueting, 2012). The interesting properties of their metal complexes, such as structural diver-sity, accessible redox activities, the ability to fine-tune ligand substitution, access to radical species, catalytic properties, distinct spectroscopic properties, etc. afford them many potential advantages over organic-based drugs (van Rijt &
Sadler, 2009; Meggers, 2009). Recent studies have focused upon their suitability as single-source precursors for ZnS nanomaterials (Pawar et al., 2017). Thiosemicarbazones can exist as thione–thiol tautomers and can bind to a metal centre in neutral or anionic forms as monodentate, bidentate or bridging ligands (Vin˜uelas-Zahı´noset al., 2011). The presence of additional, suitably positioned donor atoms can increase their coordination ability/denticity, giving rise to different coordination geometries, such as tetrahedral, octahedral and pentagonal-bipyramidal. (Umamatheswari et al., 2011). As part of a programme investigating thiosemicarbazones and their metal complexes (Tanet al., 2015), the crystal and mol-ecular structures of the title compound (I) are described, complemented by an analysis of the Hirshfeld surface.
2. Structural commentary
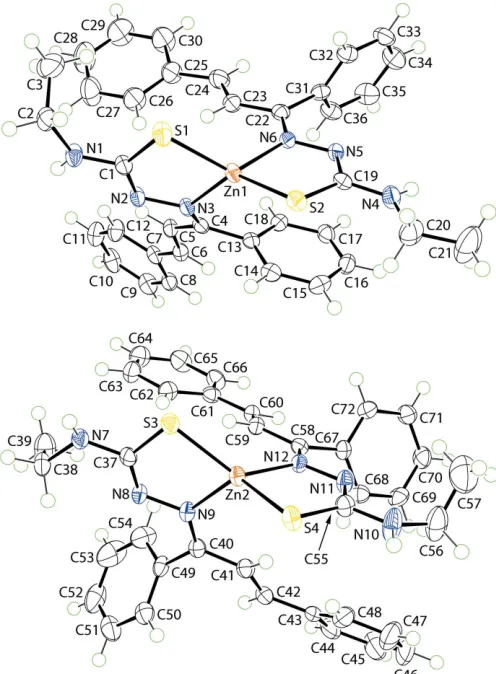
Two independent molecules comprise the asymmetric unit of (I), and these are illustrated in Fig. 1. The mono-anion derived from the thiosemicarbazone ligand is chelating, coordinating the ZnIIatomviathe thiolate-S and imine-N atoms. Referring to Table 1, the Zn—S bond lengths in the molecules span a narrow range of just over 0.01 A˚ ,i.e. 2.2688 (5) A˚ for Zn1— S2, to 2.2827 (6) A˚ for Zn1—S1, whereas the Zn—N bonds show more variability, spanning a range of over 0.02 A˚ , i.e. 2.0496 (15) A˚ for Zn2—N12, to 2.0727 (16) A˚ for Zn2—N9. The similarity in bond lengths extends to the angles subtended at the ZnII atoms which, for the Zn1-containing molecule range from 87.00 (5) for S2—Zn1—N6, to 134.00 (5) for S2—Zn1—N3,i.e. a range of 47; the acute angle is associated with the chelate angle. A slightly narrower range is noted for the Zn2-containing molecule,i.e. 85.99 (5)for S3—Zn2—N9, to 131.29 (5) for S3—Zn2—N12,i.e. about 45. The assign-ment of four-coordinate geometries can be quantified by the values of4, which range from 1.00 for an ideal tetrahedron to
0.00 for perfect square-planar geometry (Yang et al., 2007). The values of4in (I) compute to 0.70 and 0.74 for the
Zn1-and Zn2-containing molecules, respectively, indicating signif-icant distortions from the ideal tetrahedral angles. The
conformation about each of the imine C N bonds isE, as are the conformations about the ethylene bonds, Table 1.
The thiosemicarbazone ligands chelate the ZnII atoms to form five-membered ZnSCN2rings. The chelate rings adopt
different conformations in each independent molecule. For the Zn1-containing molecule, the Zn1/S1/C1/N2/N3 ring is almost planar (r.m.s. deviation = 0.005 A˚ ) but the Zn1/S2/C19/
1002
Tanet al. [Zn(C36H36N6S2)] Acta Cryst.(2017). E73, 1001–1008
[image:2.610.312.565.82.250.2]research communications
Figure 1
[image:2.610.63.275.244.450.2] [image:2.610.315.563.372.709.2]The molecular structures of the two molecules comprising the asymmetric unit of (I) showing the atom-labelling scheme and displacement ellipsoids at the 70% probability level.
Table 1
Selected geometric parameters (A˚ ,).
Zn1—N6 2.0522 (16) Zn2—N12 2.0496 (15)
Zn1—N3 2.0528 (16) Zn2—N9 2.0727 (16)
Zn1—S2 2.2688 (5) Zn2—S3 2.2707 (6)
Zn1—S1 2.2827 (6) Zn2—S4 2.2823 (5)
N2—C1 1.323 (2) N8—C37 1.311 (3)
N3—C4 1.315 (2) N9—C40 1.307 (3)
N5—C19 1.321 (2) N11—C55 1.309 (2)
N6—C22 1.311 (2) N12—C58 1.308 (2)
C5—C6 1.342 (3) C41—C42 1.339 (3)
C23—C24 1.336 (3) C59—C60 1.344 (3)
S1—Zn1—S2 118.67 (2) S3—Zn2—S4 124.97 (2)
S1—Zn1—N3 87.25 (5) S3—Zn2—N9 85.99 (5)
S1—Zn1—N6 126.78 (5) S3—Zn2—N12 131.29 (5)
S2—Zn1—N3 134.00 (5) S4—Zn2—N9 124.42 (5)
S2—Zn1—N6 87.00 (5) S4—Zn2—N12 87.23 (5)
N5/N6 ring is twisted about the Zn1—S2 bond. A similar situation pertains to the Zn2-containing molecule where there is a small twist about the Zn2—S3 bond in the Zn2/S3/C37/N8/ N9 ring and the Zn2/S4/C55/N11/N12 ring is planar to within an r.m.s. deviation of 0.008 A˚ . To a first approximation, for each thiosemicarbazone ligand, all atoms but the terminal ethyl and central phenyl rings lie in a plane. This is quantified in the dihedral angle between each five-membered chelate ring and the central and terminal rings of the prop-2-en-1-ylidene substituent, as summarized in Table 2. The different conformations of the peripheral groups are highlighted in the overlay diagram, Fig. 2.
Some physical properties for the two independent mol-ecules in (I), calculated inCrystal Explorer(Wolffet al., 2012) and PLATON(Spek, 2009), are included in Table 3. These data indicate small but significant differences between the independent molecules, most notably, the Zn1-containing molecule is less spherical than the Zn2-containing molecule.
3. Supramolecular features
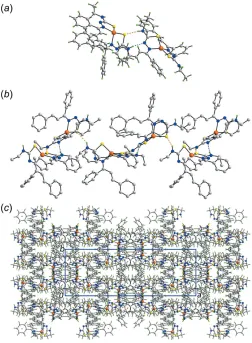
The most prominent feature of the molecular packing is the formation of an eight-membered heterosynthon, { HNCN HNCS}, mediated by amine-N—H N(imine)
research communications
Acta Cryst.(2017). E73, 1001–1008 Tanet al. [Zn(C
[image:3.610.46.566.93.143.2]36H36N6S2)]
1003
Table 2
Selected dihedral angles () for (I).
Dihedral angle Zn1,S1-ring Zn1,S2-ring Zn2,S3-ring Zn2,S4-ring
Zn,S,C,N2/central phenyl 74.54 (8) 71.88 (8) 64.79 (9) 64.53 (8)
Zn,S,C,N2/terminal phenyl 28.13 (8) 20.17 (10) 33.66 (11) 7.89 (9)
[image:3.610.43.571.177.219.2]Central phenyl/terminal phenyl 62.67 (10) 82.41 (11) 84.36 (13) 66.04 (10)
Table 3
A comparison of some physical properties of the independent molecules comprising the asymmetric unit of (I).
Molecule volume,V(A˚3) area,A(A˚2) A:V globularity,G asphericity,
Zn1-molecule 847.78 646.01 0.762 0.671 0.062
[image:3.610.314.566.314.657.2]Zn2-molecule 853.45 615.74 0.722 0.707 0.065
Figure 2
Structural overlay diagram of the two independent molecules of (I): Zn1-containing molecule (red image) and Zn2-Zn1-containing molecule (blue). The molecules have been overlapped so that the two planar chelate rings are coincident.
Figure 3
[image:3.610.47.294.491.692.2]and amine-N—H S(thiolate) hydrogen-bonds which occur between the two molecules comprising the asymmetric unit, Fig. 3a and Table 4. Additional benzene-C—H S(thiolate) interactions stabilize the dimeric aggregate, Table 4. The dimeric aggregates thus formed are connected into a zigzag supramolecular chain along the c axis via additional amine-N—H S(thiolate) hydrogen-bonds, Fig. 3b. Chains are connected via – interactions occurring between Zn2-containing molecules, involving chelate rings, comprising the Zn2/S4/C55/N11/N12 atoms and phenyl (C61–C66) rings. Precedents for chelate/arene ring interactions have been established in the literature (Tomic´et al., 2006; Tiekink, 2017). In the present case, the inter-centroid separation between rings is 3.6873 (11) A˚ and the angle between rings is 7.89 (9); symmetry operation:x, 1y, 1z. Additional interactions between chains are of the type phenyl-C—H (phenyl) involving residues of the Zn1-containing molecule exclusively, Table 4. The result of the identified intermolecular inter-actions is the formation of a three-dimensional architecture, Fig. 3c.
4. Analysis of the Hirshfeld surfaces
The Hirshfeld surface calculations of (I), and for each of the Zn1- and Zn2-molecules, were performed according to a
recent publication on related dithiocarbamate ligands (Jotani
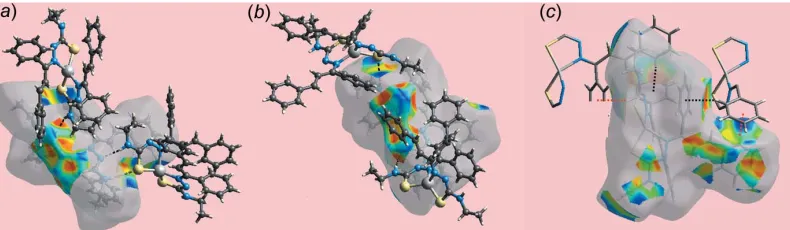
et al., 2016). From the views of the Hirshfeld surfaces mapped overdnormin Fig. 4aande, the bright-red spots near the amine-H1N, H7N, H10N, imime-N2 and thiolate-S2 and S3 atoms indicate their participation in N—H N and N—H S bonds between the two independent molecules. In the views of the Hirshfeld surfaces mapped over electrostatic potential for the Zn1-molecule in Fig. 4bandc, and for the Zn2-molecule in Fig. 4f and g, the hydrogen-bond donors and acceptors are represented by blue and red regions, respectively. Greater insight into intermolecular interactions in the crystal can be obtained by modifying the mapping range fordnorm, as shown in Fig. 4dandh, which reveals additional characteristic spots on the surface. A pair of red spots near amine-HN4 and near phenyl-C7 and C8 in Fig. 4d indicate the presence of short inter-atomic C H/H C contacts in the crystal, see Table 5 for data. The tiny, faint-red spots present near the amine-N1 and N7, phenyl-C32, C66 and C77, thiolate-S3, ethene-C5 and H6 atoms reflect the short inter-atomic C N, C S and C H contacts, Table 5. The comparatively weak C—H S interaction influential between the atoms of the independent molecules is represented by faint-red spots near atoms H11 and S3 in Fig. 4a ande, respectively. The immediate envir-onments about the Zn1- and Zn2-molecules within shape-index-mapped Hirshfeld surfaces highlighting hydrogen-bonding and C—H interactions are illustrated in Fig. 5. The N—H S and N—H N hydrogen bonds linking the independent molecules are shown in Fig. 5aand 5bwhile the C—H and their reciprocal,i.e. H—C, contacts invol-ving phenyl-C8 and C32 atoms as donors and phenyl (C31– C36 and C13–C18) rings as acceptors are shown in Fig. 5c.
1004
Tanet al. [Zn(C36H36N6S2)] Acta Cryst.(2017). E73, 1001–1008
[image:4.610.44.298.70.197.2]research communications
Figure 5
[image:4.610.314.565.119.194.2]Views of Hirshfeld surface mapped over the shape-index property about a reference (a) Zn1-molecule and (b) Zn2-molecule, showing hydrogen bonds as black dashed lines and (c) Zn2-molecule showing C—H and its reciprocal H—C interactions as red and black dotted lines, respectively.
Figure 4
Hirshfeld surface plots for the (a)–(d) Zn1-containing molecule and (e)– (h) Zn2-containing molecule, plotted overdnormin the ranges (a)0.210 to +1.800 au, (d)0.055 to +1.800 au, (e)0.112 to +1.800 au and (h)
0.210 to +1.800 au and plotted over the electrostatic potential in the ranges (b) and (c)0.118 to +0.058 au and (f) and (g)0.046 to +0.088 au. In (b), (c), (f) and (g), the donors and acceptors are represented with blue and red regions, respectively.
Table 4
Hydrogen-bond geometry (A˚ ,).
Cg1 and Cg2 are the centroids of the C31–C36 and C13—C18 rings, respectively.
D—H A D—H H A D A D—H A
N1—H1N S3 0.87 (2) 2.65 (2) 3.5077 (19) 170 (2)
N7—H7N N2 0.87 (2) 2.10 (2) 2.941 (2) 164 (2)
N10—H10N S2i 0.87 (1) 2.59 (2) 3.318 (2) 142 (2)
C11—H11 S4 0.95 2.86 3.715 (2) 151
C8—H8 Cg1ii 0.95 2.73 3.608 (2) 154
C32—H32 Cg2iii 0.95 2.64 3.532 (2) 157
Symmetry codes: (i)xþ1 2;yþ
3 2;zþ
1
2; (ii)x;y;z 1
[image:4.610.110.505.609.724.2]research communications
Acta Cryst.(2017). E73, 1001–1008 Tanet al. [Zn(C
[image:5.610.160.452.69.724.2]36H36N6S2)]
1005
Figure 6
The overall two-dimensional fingerprint plots for each of the Zn1- and Zn2-molecules, and for the overall system, i.e. (I), are shown in Fig. 6a. In addition, the fingerprint plots delineated into H H, S H/H S, N H/H N, C H/ H C,C N/N C and C C contacts (McKinnon et al., 2007) are illustrated in Fig. 6b–g, respectively; their relative contributions are summarized quantitatively in Table 6. Owing
to their significance upon the molecular packing, the finger-print plots delineated into C S/S C, Zn C/C Zn and Zn H/H Zn contacts for (I) are also illustrated in Fig. 7.
The short inter-atomic H H contacts for Zn1- and Zn2-molecules, Table 5, results in the peak at de + di 2.2 A˚ , appearing broader for the former and narrower for the latter molecule in Fig. 6b. In the fingerprint plot delineated into S H/H S contacts, Fig. 6c, the distinct distribution of the points such as the well separated donor–acceptor regions for the Zn1-molecule and the adjoining regions for the Zn2-molecule are entirely consistent with the different patterns of contacts formed by these. A pair of thin spikes at de + di
2.7 A˚ in the respective fingerprint plots in the donor and acceptor regions for the Zn1- and Zn2-molecules represents the N—H S hydrogen bond linking the two independent molecules. This pair of spikes disappears in the plot for the overall system. Another N—H S hydrogen bond is recog-nized in the plots as differently shaped donor–acceptor regions of the Zn1- and Zn2-molecules with their tips atde+di
2.6 A˚ . As the contribution from S H/H S contacts to the Hirshfeld surfaces of the Zn1- and Zn2-molecules involves N—H S hydrogen bonds and comparatively weak C—H S interactions, the percentage contribution from these contacts to the Hirshfeld surface of the overall system is reduced to 8.5% due to disappearance of points corresponding to inter-linking N—H S hydrogen bond. In Fig. 6d, a pair of spikes at
de+di2.1 A˚ in the acceptor and donor regions of the Zn1-and Zn2-molecules, respectively, results from the linking N— H N hydrogen bond between the independent molecules; the spikes disappear in the plot for the overall system.
The greater contribution, i.e. 24.1%, from C H/H C contacts to the Hirshfeld surface for the Zn1-molecule cf. 17.3% for the Zn2-molecule is due to the greater involvement of atoms of the Zn1-molecule in C—H interactions and short inter-atomic C H/H C contacts, Table 5. In the fingerprint plot delineated into C H/H C contacts for the Zn1 molecule, Fig. 6e, a pair of forceps-like tips at de + di
2.6 A˚ represent a short inter-atomic C H contact formed between the phenyl-C7 and amino-H7Natoms, Table 5. The other short inter-atomic C H contacts involving the Zn1-molecule are merged within the plot. Similarly, a pair of forceps-like tips in the respective plot for Zn2-molecule at
1006
Tanet al. [Zn(C36H36N6S2)] Acta Cryst.(2017). E73, 1001–1008
[image:6.610.45.296.91.331.2]research communications
Table 6
Percentage contributions of inter-atomic contacts to the Hirshfeld surfaces for the Zn1-molecule, Zn2-molecule and (I).
Contact distance symmetry operation
Zn1-molecule Zn2-molecule (I)
H H 55.4 63.6 64.5
S H/H S 12.1 11.2 8.5
N H/H N 5.3 2.5 3.0
C H/H C 24.1 17.3 20.5
C N/N C 0.8 2.5 1.2
C C 1.5 1.0 1.1
C S/S C 0.0 0.6 0.3
Zn H/H Zn 0.8 0.6 0.5
[image:6.610.314.565.103.213.2]Zn C/C Zn 0.0 0.7 0.4
Figure 7
Fingerprint plots for (I) delineated into (a) S C/C 2, (b) Zn H/ H Zn and (c) Zn C/C Zn contacts.
Table 5
Summary of short inter-atomic contacts (A˚ ) in (I).
Contact distance symmetry operation
Zn1 H17 3.44 1
2x,12+y,12z
Zn2 H12 3.41 x,y,z
Zn2 C11 3.942 (2) x,y,z
Zn2 C12 3.906 (2) x,y,z
Zn2 C65 3.735 (2) x, 1y, 1z
Zn2 C66 3.938 (2) x, 1y, 1z
H3A H30 2.27 1
2x, 1
2y, 1z
H53 H53 2.23 x,y,1
2z
H45 H54 2.37 x, 2y, 1z
C5 N7 3.214 (2) x,y,z
C71 N1 3.223 (3) x, 1y, 1z
C66 S3 3.415 (2) x, 1y, 1z
C3 H30 2.87 1
2x, 1
2y, 1z
C6 H4N 2.816 (15) 1
2x,12+y,12z
C7 H4N 2.570 (12) 1
2x, 1 2+y,
1 2z
C8 H4N 2.652 (15) 1
2x, 1 2+y,
1 2z
C19 H18 2.85 1
2x, 1 2+y,
1 2z
C32 H6 2.74 1
2x, 1 2+y,
1 2z
C33 H6 2.87 1
2x, 1 2+y,
1 2z
C43 H3B 2.85 x, 1 +y,z
C44 H2B 2.87 x, 1 +y,z
C48 H3B 2.82 x, 1 +y,z
C51 H70 2.80 x, 2y, 1z
[image:6.610.44.298.465.714.2]de + di 2.8 A˚ reflect the short inter-atomic C H contact between the phenyl-C51 and -H70 atoms, with the other short contacts merged within the plot. In Fig. 6f, the short inter-atomic C N contacts between atoms of the Zn1- and Zn2-molecules, Table 5, appear as a pair of short spikes with their tips at de + di 3.2 A˚ . The small contributions from C C contacts for the Zn1- and Zn2-molecules and for the overall system, Fig. 6g, suggests little impact on the molecular packing.
The presence of a short inter-atomic C S contact between the thiolate-S3 and phenyl-C66 atoms is evident from the typical H-shaped plot in Fig. 7aand makes a contribution of 0.6% to the Hirshfeld surface of the Zn2-molecule. In the fingerprint plot delineated into Zn H/H Zn contacts, Fig. 7b, the tips atde+di< 3.45 A˚ with the shape of a folded sheet with a low density of points indicate the short contacts between these atoms. The presence of–stacking between chelate ring Zn2/S4/C55/N11/N12 and phenyl (C61–C66) rings of Zn2-molecules is evident from the presence of short inter-atomic Zn C/C Zn contacts, Table 5. In the fingerprint plot delineated into Zn C/C Zn contacts, Fig. 7c, these contacts are reflected by a pair of points with an S-shaped distribution at aroundde+di1.9 to 2.1 A˚ . This–stacking is also apparent from the small but effective contributions from Zn C/C Zn and C N/N C contacts to the Hirshfeld surface of the Zn2-molecule, Table 6.
5. Database survey
An analysis of the Cambridge Crystallographic Database (Groom et al., 2016) indicates there are nine literature precedents for the structure of (I), i.e. of general formula Zn[SC(NHR) NN CR0R00]
2 reflecting the interest in this
class of compound. All of the structures resemble the mol-ecular geometry described above for (I). The substituents at the hydrazone-C atom can be equivalent and alkyl,i.e. R0=R00
= Me for theR= Ph compound (Tanet al., 2009), or aryl,i.e. R0
=R00= Ph for theR= 3-FPh compound (Ferrazet al., 2012) or mixed alkyl/aryl, i.e. R0 = Me and R00 = Ph for the R = Ph compound (Wang et al., 2009); the latter structure has two molecules in the asymmetric unit. TheR0andR00groups can be part of a ring, e.g. cyclohexyl in the structure with R= Me (Vikneswaran et al., 2016). In most examples, the N-bound group is aryl with the exceptions being the aforementioned structure and the cyclopentyl analogue (Vikneswaran et al., 2016). Clearly, there is immense scope for derivatization of these species which may assist in the optimization of their biological properties.
6. Synthesis and crystallization
Analytical grade reagents were used as procured without further purification. Equimolar quantities of 4-ethyl-3-thio-semicarbazide (1.1919 g, 0.01 mol) and 1,3-diphenylprop-2-en-1-one (2.0826 g, 0.01 mol) were dissolved in heated absolute ethanol (30 ml) separately and the mixtures were mixed with stirring. About five drops of concentrated hydrochloric acid
were added to the mixture to catalyse the reaction. The reaction mixture was kept under heating and stirring for about 10 mins, followed by stirring for 1 h at room temperature. The resulting yellow precipitate was filtered off, washed with chilled absolute ethanol and dried in vacuo. The resulting precipitate, N-ethyl-N -(1,3-diphenyl-2-propen-1-one)thio-semicarbazide (0.3090, 0.01 mol), was used without further purification and was dissolved in heated absolute ethanol (50 ml). Zn(CH3COO)22H2O (0.1098 g, 0.50 mmol) was
dissolved separately in heated absolute ethanol (30 ml) and then added into an ethanolic N-ethyl-N -(1,3-diphenyl-2-propen-1-one)thiosemicarbazide solution. The mixture was heated and stirred for about 10 mins, followed by stirring for 1 h at room temperature. The obtained yellow precipitate was filtered, washed with cold ethanol and driedin vacuo. Single crystals were grown at room temperature from the slow evaporation of a solution of dimethylformamide and aceto-nitrile (1:1v/v20 ml).
7. Refinement
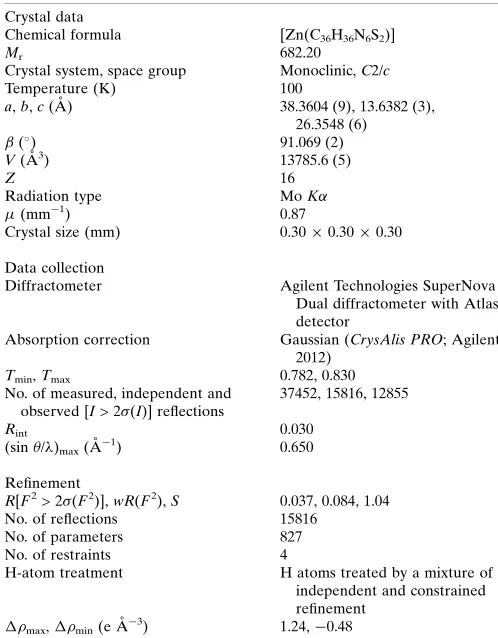
Crystal data, data collection and structure refinement details are summarized in Table 7. The carbon-bound H atoms were placed in calculated positions (C—H = 0.95–0.99 A˚ ) and were
research communications
Acta Cryst.(2017). E73, 1001–1008 Tanet al. [Zn(C
[image:7.610.312.561.92.411.2]36H36N6S2)]
1007
Table 7
Experimental details.
Crystal data
Chemical formula [Zn(C36H36N6S2)]
Mr 682.20
Crystal system, space group Monoclinic,C2/c
Temperature (K) 100
a,b,c(A˚ ) 38.3604 (9), 13.6382 (3),
26.3548 (6) (
) 91.069 (2)
V(A˚3) 13785.6 (5)
Z 16
Radiation type MoK
(mm1) 0.87
Crystal size (mm) 0.300.300.30
Data collection
Diffractometer Agilent Technologies SuperNova
Dual diffractometer with Atlas detector
Absorption correction Gaussian (CrysAlis PRO; Agilent,
2012)
Tmin,Tmax 0.782, 0.830
No. of measured, independent and observed [I> 2(I)] reflections
37452, 15816, 12855
Rint 0.030
(sin/ )max(A˚ 1
) 0.650
Refinement
R[F2> 2(F2)],wR(F2),S 0.037, 0.084, 1.04
No. of reflections 15816
No. of parameters 827
No. of restraints 4
H-atom treatment H atoms treated by a mixture of
independent and constrained refinement
max,min(e A˚
3) 1.24,0.48
included in the refinement in the riding-model approximation, with Uiso(H) set to 1.2–1.5Ueq(C). The nitrogen-bound H atoms were located in a difference-Fourier map but were refined with a distance restraint of N—H = 0.880.01 A˚ , and withUiso(H) set to 1.2Ueq(N).
Acknowledgements
We thank the staff of the University of Malaya’s X-ray diffraction laboratory for the data collection. The authors are also grateful to Sunway University (INT-RRO-2017-096) for supporting this research.
References
Afrasiabi, Z., Sinn, E., Padhye, S., Dutta, S., Padhye, S., Newton, C.,
Anson, C. E. & Powell, A. K. (2003).J. Inorg. Biochem.94306–314.
Agilent (2012). CrysAlis PRO. Agilent Technologies, Yarnton,
England.
Brandenburg, K. (2006).DIAMOND. Crystal Impact GbR, Bonn,
Germany.
Casas, J. S., Garc\?ı´a-Tasende, M. S. & Sordo, J. (2000).Coord. Chem.
Rev.209, 197–261.
Da Silva, J. G., PerdigA˜ o, C. C. H., Speziali, N. L. & Beraldo, H.
(2013).J. Coord. Chem.66, 385–401.
Dilworth, J. R. & Hueting, R. (2012).Inorg. Chim. Acta,389, 3–15.
Farrugia, L. J. (2012).J. Appl. Cryst.45, 849–854.
Ferraz, K. S. O., Silva, N. F., Da Silva, J. G., Speziali, N. L., Mendes,
I. C. & Beraldo, H. (2012).J. Mol. Struct.1008, 102–107.
Gans, J. & Shalloway, D. (2001). J. Mol. Graphics Modell.19, 557–
559.
Garoufis, A., Hadjikakou, S. K. & Hadjiliadis, N. (2009). Coord.
Chem. Rev.253, 1384–1397.
Groom, C. R., Bruno, I. J., Lightfoot, M. P. & Ward, S. C. (2016).Acta
Cryst.B72, 171–179.
Jotani, M. M., Poplaukhin, P., Arman, H. D. & Tiekink, E. R. T.
(2016).Acta Cryst.E72, 1085–1092.
Lobana, T. S., Sharma, R., Bawa, G. & Khanna, S. (2009).Coord.
Chem. Rev.253, 977–1055.
McKinnon, J. J., Jayatilaka, D. & Spackman, M. A. (2007).Chem.
Commun.pp. 3814–3816.
Meggers, E. (2009).Chem. Commun.pp. 1001–1010.
Pawar, A. S., Mlowe, S., Garje, S. S., Akerman, M. P. & Revaprasadu,
N. (2017).Inorg. Chim. Acta,463, 7–13.
Quiroga, A. G. & Ranninger, C. N. (2004).Coord. Chem. Rev.248
119–133.
Rijt, S. H. van & Sadler, P. J. (2009).Drug Discovery Today,14, 1089–
1097.
Sheldrick, G. M. (2008).Acta Cryst.A64, 112–122.
Sheldrick, G. M. (2015).Acta Cryst.C71, 3–8.
Spek, A. L. (2009).Acta Cryst.D65, 148–155.
Tan, M. Y., Crouse, K. A., Ravoof, T. B. S. A. & Tiekink, E. R. T.
(2015).Acta Cryst.E71, o1047–o1048.
Tan, K. W., Ng, C. H., Maah, M. J. & Ng, S. W. (2009).Acta Cryst.E65,
m969.
Tiekink, E. R. T. (2017).Coord. Chem. Rev.http://dx.doi.org/10.1016/
j.ccr.2017.01.009.
Tomic´, Z. D., Sredojevic´, D. & Zaric´, S. D. (2006).Cryst. Growth Des.
6, 29–31.
Umamatheswari, S., Pratha, J. J. & Kabilan, S. (2011).J. Mol. Struct.
989, 1–9.
Vikneswaran, R., Eltayeb, N. E., Ramesh, S. & Yahya, R. (2016).
Polyhedron,105, 89–95.
Vin˜uelas-Zahı´nos, E., Luna-Giles, F., Torres-Garcı´a, P. &
Ferna´ndez-Caldero´n, M. C. (2011).Eur. J. Med. Chem.46, 150–159.
Wang, H., Zhao, P., Shao, D., Zhang, J. & Zhu, Y. (2009). Struct.
Chem.20, 995–1003.
Westrip, S. P. (2010).J. Appl. Cryst.43, 920–925.
Wolff, S. K., Grimwood, D. J., McKinnon, J. J., Turner, M. J., Jayatilaka, D. & Spackman, M. A. (2012). University of Western Australia.
Yang, L., Powell, D. R. & Houser, R. P. (2007).Dalton Trans.pp. 955–
964.
1008
Tanet al. [Zn(C36H36N6S2)] Acta Cryst.(2017). E73, 1001–1008
supporting information
sup-1
Acta Cryst. (2017). E73, 1001-1008
supporting information
Acta Cryst. (2017). E73, 1001-1008 [https://doi.org/10.1107/S2056989017008064]
Bis(
N
′
-{(
E
)-[(2
E
)-1,3-diphenylprop-2-en-1-ylidene]amino}-
N
-ethylcarbamimido-thioato-
κ
2N
′
,
S
)zinc(II): crystal structure and Hirshfeld surface analysis
Ming Yueh Tan, Karen A. Crouse, Thahira B. S. A. Ravoof, Mukesh M. Jotani and Edward R. T.
Tiekink
Computing details
Data collection: CrysAlis PRO (Agilent, 2012); cell refinement: CrysAlis PRO (Agilent, 2012); data reduction: CrysAlis
PRO (Agilent, 2012); program(s) used to solve structure: SHELXS97 (Sheldrick, 2008); program(s) used to refine
structure: SHELXL2014/7 (Sheldrick, 2015); molecular graphics: ORTEP-3 for Windows (Farrugia, 2012), QMol (Gans &
Shalloway, 2001) and DIAMOND (Brandenburg, 2006); software used to prepare material for publication: publCIF
(Westrip, 2010).
Bis(N′-{(E)-[(2E)-1,3-diphenylprop-2-en-1-ylidene]amino}-N-ethylcarbamimidothioato-κ2N′,S)zinc(II)
Crystal data
[Zn(C36H36N6S2)] Mr = 682.20
Monoclinic, C2/c a = 38.3604 (9) Å b = 13.6382 (3) Å c = 26.3548 (6) Å β = 91.069 (2)° V = 13785.6 (5) Å3 Z = 16
F(000) = 5696 Dx = 1.315 Mg m−3
Mo Kα radiation, λ = 0.71073 Å Cell parameters from 15819 reflections θ = 3.1–27.5°
µ = 0.87 mm−1 T = 100 K Cube, yellow
0.30 × 0.30 × 0.30 mm
Data collection
Agilent Technologies SuperNova Dual diffractometer with Atlas detector Radiation source: SuperNova (Mo) X-ray
Source
Mirror monochromator
Detector resolution: 10.4041 pixels mm-1 ω scan
Absorption correction: gaussian (CrysAlis PRO; Agilent, 2012)
Tmin = 0.782, Tmax = 0.830 37452 measured reflections 15816 independent reflections 12855 reflections with I > 2σ(I) Rint = 0.030
θmax = 27.5°, θmin = 3.1° h = −49→48
k = −17→14 l = −34→22
Refinement
Refinement on F2 Least-squares matrix: full R[F2 > 2σ(F2)] = 0.037 wR(F2) = 0.084 S = 1.04
15816 reflections
827 parameters 4 restraints
H atoms treated by a mixture of independent and constrained refinement
w = 1/[σ2(F
supporting information
sup-2
Acta Cryst. (2017). E73, 1001-1008
(Δ/σ)max = 0.002 Δρmax = 1.24 e Å−3
Δρmin = −0.48 e Å−3
Special details
Geometry. All esds (except the esd in the dihedral angle between two l.s. planes) are estimated using the full covariance matrix. The cell esds are taken into account individually in the estimation of esds in distances, angles and torsion angles; correlations between esds in cell parameters are only used when they are defined by crystal symmetry. An approximate (isotropic) treatment of cell esds is used for estimating esds involving l.s. planes.
Fractional atomic coordinates and isotropic or equivalent isotropic displacement parameters (Å2)
x y z Uiso*/Ueq
supporting information
sup-3
Acta Cryst. (2017). E73, 1001-1008
supporting information
sup-4
Acta Cryst. (2017). E73, 1001-1008
supporting information
sup-5
Acta Cryst. (2017). E73, 1001-1008
H57B 0.0581 0.7530 0.7418 0.080* H57C 0.0923 0.6861 0.7380 0.080* C58 0.02184 (5) 0.67592 (15) 0.54521 (7) 0.0150 (4) C59 0.00695 (5) 0.63366 (15) 0.49947 (7) 0.0163 (4) H59 0.0216 0.5953 0.4787 0.020* C60 −0.02650 (5) 0.64535 (15) 0.48458 (7) 0.0163 (4) H60 −0.0408 0.6829 0.5063 0.020* C61 −0.04328 (5) 0.60656 (15) 0.43862 (7) 0.0173 (4) C62 −0.02457 (5) 0.56030 (15) 0.40025 (7) 0.0202 (4) H62 0.0001 0.5554 0.4031 0.024* C63 −0.04178 (6) 0.52170 (17) 0.35816 (8) 0.0253 (5) H63 −0.0289 0.4901 0.3324 0.030* C64 −0.07776 (6) 0.52884 (18) 0.35333 (8) 0.0283 (5) H64 −0.0895 0.5013 0.3246 0.034* C65 −0.09651 (6) 0.57606 (18) 0.39027 (8) 0.0266 (5) H65 −0.1211 0.5818 0.3868 0.032* C66 −0.07939 (5) 0.61493 (16) 0.43230 (8) 0.0221 (5) H66 −0.0924 0.6480 0.4574 0.027* C67 −0.00047 (5) 0.72828 (15) 0.58235 (7) 0.0152 (4) C68 0.00366 (5) 0.82902 (16) 0.58950 (8) 0.0201 (4) H68 0.0202 0.8639 0.5701 0.024* C69 −0.01618 (6) 0.87864 (16) 0.62458 (8) 0.0227 (5) H69 −0.0136 0.9475 0.6288 0.027* C70 −0.03976 (6) 0.82737 (16) 0.65346 (8) 0.0236 (5) H70 −0.0530 0.8609 0.6781 0.028* C71 −0.04412 (5) 0.72761 (16) 0.64660 (8) 0.0222 (5) H71 −0.0604 0.6928 0.6665 0.027* C72 −0.02476 (5) 0.67807 (15) 0.61072 (8) 0.0192 (4) H72 −0.0281 0.6098 0.6056 0.023*
Atomic displacement parameters (Å2)
U11 U22 U33 U12 U13 U23
supporting information
sup-6
Acta Cryst. (2017). E73, 1001-1008
supporting information
sup-7
Acta Cryst. (2017). E73, 1001-1008
C46 0.158 (4) 0.0300 (16) 0.0247 (14) −0.023 (2) 0.0151 (19) −0.0127 (13) C47 0.116 (3) 0.0389 (18) 0.0225 (13) −0.0262 (19) −0.0109 (15) −0.0036 (13) C48 0.0559 (17) 0.0258 (13) 0.0224 (11) −0.0146 (12) −0.0042 (11) −0.0001 (10) C49 0.0235 (10) 0.0158 (10) 0.0140 (9) 0.0056 (8) −0.0017 (8) −0.0019 (8) C50 0.0258 (11) 0.0193 (11) 0.0213 (10) 0.0063 (9) 0.0030 (9) −0.0003 (9) C51 0.0472 (15) 0.0202 (12) 0.0250 (11) 0.0106 (11) 0.0119 (11) 0.0057 (10) C52 0.0688 (19) 0.0274 (13) 0.0181 (11) 0.0112 (13) −0.0101 (12) 0.0009 (10) C53 0.0571 (18) 0.0342 (15) 0.0349 (14) −0.0029 (13) −0.0286 (13) 0.0050 (12) C54 0.0344 (13) 0.0257 (12) 0.0292 (12) −0.0015 (10) −0.0114 (10) 0.0051 (10) C55 0.0170 (10) 0.0225 (11) 0.0171 (9) 0.0009 (8) −0.0008 (8) 0.0000 (9) C56 0.0274 (13) 0.0653 (19) 0.0252 (12) −0.0023 (13) −0.0055 (10) −0.0137 (13) C57 0.066 (2) 0.055 (2) 0.0391 (16) 0.0093 (16) 0.0059 (14) −0.0032 (15) C58 0.0140 (9) 0.0160 (10) 0.0151 (9) −0.0012 (8) 0.0009 (7) 0.0016 (8) C59 0.0173 (10) 0.0168 (10) 0.0149 (9) −0.0005 (8) 0.0013 (8) −0.0017 (8) C60 0.0181 (10) 0.0160 (10) 0.0148 (9) −0.0003 (8) 0.0017 (8) −0.0010 (8) C61 0.0178 (10) 0.0163 (10) 0.0177 (10) −0.0015 (8) −0.0020 (8) 0.0032 (8) C62 0.0195 (10) 0.0215 (11) 0.0194 (10) −0.0002 (9) −0.0029 (8) 0.0003 (9) C63 0.0326 (12) 0.0253 (12) 0.0179 (10) −0.0010 (10) −0.0009 (9) −0.0035 (9) C64 0.0332 (13) 0.0322 (13) 0.0193 (10) −0.0073 (10) −0.0105 (9) 0.0005 (10) C65 0.0205 (11) 0.0367 (14) 0.0223 (11) −0.0051 (10) −0.0070 (9) 0.0061 (10) C66 0.0202 (10) 0.0274 (12) 0.0187 (10) 0.0000 (9) 0.0001 (8) 0.0038 (9) C67 0.0127 (9) 0.0197 (10) 0.0131 (9) 0.0017 (8) −0.0026 (7) −0.0006 (8) C68 0.0177 (10) 0.0203 (11) 0.0222 (10) −0.0014 (8) 0.0012 (8) 0.0005 (9) C69 0.0278 (11) 0.0148 (10) 0.0254 (11) 0.0024 (9) −0.0008 (9) −0.0028 (9) C70 0.0255 (11) 0.0242 (12) 0.0214 (10) 0.0047 (9) 0.0060 (9) −0.0045 (9) C71 0.0212 (11) 0.0227 (11) 0.0228 (10) −0.0010 (9) 0.0070 (8) −0.0017 (9) C72 0.0195 (10) 0.0159 (10) 0.0222 (10) −0.0004 (8) 0.0004 (8) −0.0018 (9)
Geometric parameters (Å, º)
supporting information
sup-8
Acta Cryst. (2017). E73, 1001-1008
supporting information
sup-9
Acta Cryst. (2017). E73, 1001-1008
C26—C27 1.380 (3) C62—C63 1.384 (3) C26—H26 0.9500 C62—H62 0.9500 C27—C28 1.389 (3) C63—C64 1.387 (3) C27—H27 0.9500 C63—H63 0.9500 C28—C29 1.382 (4) C64—C65 1.380 (3) C28—H28 0.9500 C64—H64 0.9500 C29—C30 1.386 (3) C65—C66 1.383 (3) C29—H29 0.9500 C65—H65 0.9500 C30—H30 0.9500 C66—H66 0.9500 C31—C32 1.391 (3) C67—C72 1.386 (3) C31—C36 1.393 (3) C67—C68 1.395 (3) C32—C33 1.391 (3) C68—C69 1.385 (3) C32—H32 0.9500 C68—H68 0.9500 C33—C34 1.383 (3) C69—C70 1.383 (3) C33—H33 0.9500 C69—H69 0.9500 C34—C35 1.389 (3) C70—C71 1.382 (3) C34—H34 0.9500 C70—H70 0.9500 C35—C36 1.388 (3) C71—C72 1.389 (3) C35—H35 0.9500 C71—H71 0.9500 C36—H36 0.9500 C72—H72 0.9500
supporting information
sup-10
Acta Cryst. (2017). E73, 1001-1008
supporting information
sup-11
Acta Cryst. (2017). E73, 1001-1008
supporting information
sup-12
Acta Cryst. (2017). E73, 1001-1008
C25—C30—H30 119.5 C61—C66—H66 119.4 C32—C31—C36 119.14 (19) C72—C67—C68 119.29 (18) C32—C31—C22 119.82 (18) C72—C67—C58 121.08 (18) C36—C31—C22 121.04 (18) C68—C67—C58 119.61 (18) C33—C32—C31 120.2 (2) C69—C68—C67 120.59 (19) C33—C32—H32 119.9 C69—C68—H68 119.7 C31—C32—H32 119.9 C67—C68—H68 119.7 C34—C33—C32 120.4 (2) C70—C69—C68 119.6 (2) C34—C33—H33 119.8 C70—C69—H69 120.2 C32—C33—H33 119.8 C68—C69—H69 120.2 C33—C34—C35 119.6 (2) C71—C70—C69 120.3 (2) C33—C34—H34 120.2 C71—C70—H70 119.8 C35—C34—H34 120.2 C69—C70—H70 119.8 C36—C35—C34 120.2 (2) C70—C71—C72 120.2 (2) C36—C35—H35 119.9 C70—C71—H71 119.9 C34—C35—H35 119.9 C72—C71—H71 119.9 C35—C36—C31 120.4 (2) C67—C72—C71 120.02 (19) C35—C36—H36 119.8 C67—C72—H72 120.0 C31—C36—H36 119.8 C71—C72—H72 120.0
supporting information
sup-13
Acta Cryst. (2017). E73, 1001-1008
supporting information
sup-14
Acta Cryst. (2017). E73, 1001-1008
Hydrogen-bond geometry (Å, º)
Cg1 and Cg2 are the centroids of the C31–C36 and C13—C18 rings, respectively.
D—H···A D—H H···A D···A D—H···A
N1—H1N···S3 0.87 (2) 2.65 (2) 3.5077 (19) 170 (2) N7—H7N···N2 0.87 (2) 2.10 (2) 2.941 (2) 164 (2) N10—H10N···S2i 0.87 (1) 2.59 (2) 3.318 (2) 142 (2) C11—H11···S4 0.95 2.86 3.715 (2) 151 C8—H8···Cg1ii 0.95 2.73 3.608 (2) 154 C32—H32···Cg2iii 0.95 2.64 3.532 (2) 157