warwick.ac.uk/lib-publications
Manuscript version: Author’s Accepted Manuscript
The version presented in WRAP is the author’s accepted manuscript and may differ from the published version or Version of Record.
Persistent WRAP URL:
http://wrap.warwick.ac.uk/112956
How to cite:
Please refer to published version for the most recent bibliographic citation information. If a published version is known of, the repository item page linked to above, will contain details on accessing it.
Copyright and reuse:
The Warwick Research Archive Portal (WRAP) makes this work by researchers of the University of Warwick available open access under the following conditions.
Copyright © and all moral rights to the version of the paper presented here belong to the individual author(s) and/or other copyright owners. To the extent reasonable and
practicable the material made available in WRAP has been checked for eligibility before being made available.
Copies of full items can be used for personal research or study, educational, or not-for-profit purposes without prior permission or charge. Provided that the authors, title and full
bibliographic details are credited, a hyperlink and/or URL is given for the original metadata page and the content is not changed in any way.
Publisher’s statement:
Please refer to the repository item page, publisher’s statement section, for further information.
Graph-Based Transform with Weighted Self-loops for
Predictive Transform Coding based on Template Matching
Debaleena Roy, Tanaya Guha, and Victor Sanchez
Department of Computer Science, University of Warwick, Coventry, UK
{debaleena.roy,tanaya.guha,v.f.sanchez-silva}@warwick.ac.uk
Abstract
This paper introduces the GBT-L, a novel class of Graph-based Transform within the con-text of block-based predictive transform coding. The GBT-L is constructed using a 2D graph with unit edge weights and weighted loops in every vertex. The weighted self-loops are selected based on the residual values to be transformed. To avoid signalling any additional information required to compute the inverse GBT-L, we also introduce a coding framework that uses a template-based strategy to predict residual blocks in the pixel and residual domains. Evaluation results on several video frames and medical images, in terms of the percentage of preserved energy and mean square error, show that the GBT-L can outperform the DST, DCT and the Graph-based Separable Transform.
1. Introduction
Block-based predictive transform coding (PTC) is a popular coding technique due to its simplicity and excellent energy compaction abilities through the use of orthogo-nal transforms [1, 2]. PTC has been used to compress natural images and videos, screen content and medical images [3, 4, 5]. PTC incorporates lossless and lossy compression and prediction methods based on intra-prediction, and motion estima-tion and compensaestima-tion [6, 7]. Even though lossless compression guarantees the exact reconstruction of the data, it may fail to achieve high compression ratios. Lossy compression, on the other hand, can provide higher compression ratios through, for example, efficient quantization of the transformed data [8, 9].
In general, lossy compression is based on applying an orthogonal transform on the signal to expand it into a set of orthogonal bases, with the expectation that most of the signal’s information is captured by a few basis functions. This is followed by quantization of the resulting coefficients. For any arbitrary signal with a known covariance function, it is well known that the Karhunen Love Transform (KLT) is the linear transform with the best energy compaction property. The KLT basis functions of natural images are close to those of the Discrete Cosine Transform (DCT) [10]. Hence, the DCT is widely considered as the best transform for image compression. Unfortunately, the DCT offers little adaptability to the characteristics of the data as a fixed transform is usually applied to all images.
(a) (b) (c) (d)
Figure 1: (a) Line graph with self-loops in the first and last vertices. (b) 1D residual signal predicted by the horizontal mode. (c) First basis function of a GBST designed for the horizontal mode. (d) 1D residual signal predicted by the horizontal mode for a noisy signal.
the first and last vertices (see Fig. 1(a)). Based on this fact, the authors learn the self-loop weights that produce efficient Graph-based Separable Transforms (GBSTs) for block-based PTC of intra-predicted video frames. They show how the first basis function of their learned transforms can accurately represent the residual signal. This is exemplified in Fig. 1(b)-(c), where the first basis function of their learned GBST for the horizontal prediction mode is plotted. One can easily note that the function vanishes on the left side and increases on the right side. This behavior resembles the shape of thisideal 1D residual signal, in which the error is expected to be small in the leftmost pixel location (i.e., the one closest to the reference pixel) and increase with the distance from the reference. In practice, however, the residual signals may not always have an ideal behavior. For example, a row of residual values computed by the horizontal prediction mode may have a relatively flat shape if the image is smooth, or several peaks and valleys if the image is noisy (see Fig. 1(d)). A GBT whose first basis accurately represents the residual signal, irrespective of the prediction mode, has the potential to provide better data decorrelation and energy compaction properties.
This paper thus proposes the GBT-L, a novel class of GBT based on a 2D graph with unit edge weights and weighted self-loops in every vertex. The GBT-L accurately captures the characteristics of a residual block by computing the self-loop weights according to the residual values. Since the GBT-L is based on a 2D graph, it accounts for the correlation among all values to be transformed. To avoid signaling additional information required to compute the inverse GBT-L within the context of block-based PTC, we also propose a coding framework that uses a template-block-based strategy to predict the residual blocks to be transformed. The GBT-L is evaluated on a wide range of video frames and medical images. Our results show that the GBT-L attains better energy compaction properties and a higher reconstruction quality than the DST, DCT and the Graph-based Separable Transform (GBST).
The rest of this paper is organized as follows. Section 2 describes the proposed GBT-L. Section 3 explains the coding framework that integrates the template-based strategies to predict residual blocks. Section 4 presents and discusses the performance evaluation results and Section 5 concludes this paper.
2. Proposed GBT-L
[image:3.612.116.499.72.149.2]10 14 21 2
12 17 28 16
11 12 24 19
7 2 9 8
0.31 0.46 0.73 0.00
0.38 0.58 1.00 0.54
0.35 0.38 0.85 0.65
0.19 0.00 0.27 0.23
0.31 0.46 0.73 0.00
0.54 1
1
1 1
1 1
1 1 1 1
1.00 0.58 0.38 0.65 0.85 0.38 0.35 0.23 0.27 0.00 0.19 1 1 1 1 1 1 1 1 1 1 1 1 1 1
(a)
(b)
(c)
(d)
(e)
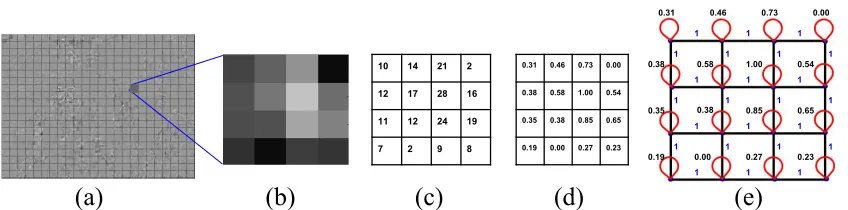
Figure 2: (a) Residual signal generated by intra-prediction for the Y component of a video
frame from the sequenceBlowingBubble. (b),(c) A sample 4×4 residual block and its actual
values. (d) Normalized residual values. (e) 2D graph (4-connect) with unit edge weights and self-loops in each vertex.
between the predicted and the original block. Let us denote such a (square) residual block as s ∈ R
√
N×√N, where N is the total number of residual values. The block s
can be represented as an undirected weighted graph, G= (V, E,A), where V is the set ofN nodesV ={vn}Nn=1,E is the set of all edges, andA∈RN×N is the symmetric
weighted adjacency matrix. The entry Aij inA represents the weight of the edgeeij
connecting vertices vi and vj. The GBT-L assumes a 4-connected pattern with
self-loops in every vertex as shown in Fig. 2. Consequently, Aij = 1 for i 6=j, i.e., the
weight of any edge connecting two adjacent nodes is always 1. The self-loop weights, i.e., the diagonal entries ofA, are computed based on the normalized residual values. For node vi, Aii is given by:
Aii=
vr
i −minV
maxV −minV , (1)
wherevr
i is the residual value ofvi and minV, maxV are the minimum and maximum
residual value of the nodes in set V.
The GBT-L is constructed by the eigen decomposition of the generalized Lapla-cian, L, computed as L=D−A, whereD is the diagonal degree matrix, whose nth
diagonal element is equal to the sum of the weights of all edges incident onto node
vn. The eigen decomposition of L is used as the orthogonal transform for the
resid-ual block, since it has a complete set of eigen vectors with real, non-negative eigen values. Fig. 2 shows a residual frame with 4×4 blocks and the 4-connected graph with self-loops in each vertex for a sample block. Note that the self-loop weights are between 0 and 1.
[image:4.612.90.514.68.173.2](a) (b) (c)
[image:5.612.91.520.76.269.2](d) (e) (f)
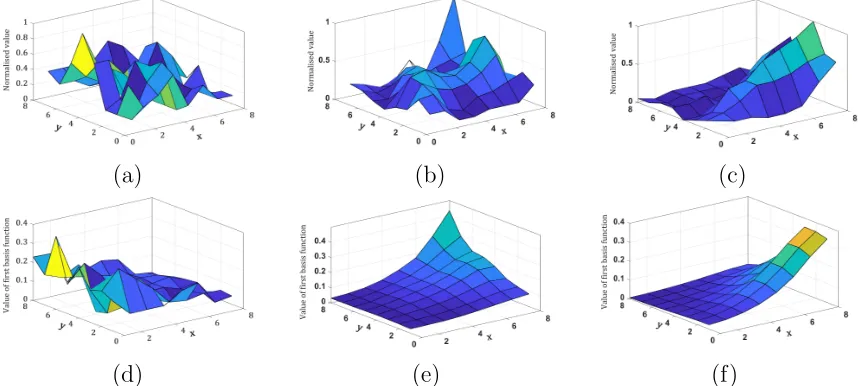
Figure 3: Normalized residual values of an 8×8 block computed by the (a) DC, (b) vertical,
and horizontal modes. (d-f) First basis function of the corresponding GBT-L.
specified by Eq. (1). Fig. 3 shows the 2D plot of various 8×8 residual blocks and the 2D plot of the first basis function of their corresponding GBT-L. One can note that the first basis function indeed resembles the residual signal and follows its general shape. This, as will be shown in Section 4, allows to preserve more of the signal’s energy with only a few coefficients.
3. Proposed Coding Framework
As explained in Section 2, the GBT-L is based on a 2D graph with unit edge weights and self-loops in every vertex. This, however, requires sending additional information to the decoder to reconstruct the 2D graph needed to compute the inverse GBT-L. To tackle this issue, we propose a coding framework that does not require sending such additional information.
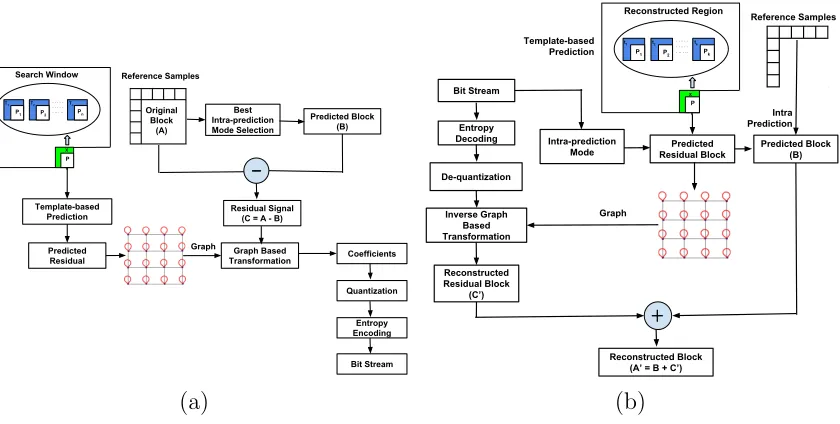
Our framework is depicted in Fig. 4. At the encoder side, we employ a template-based strategy [15, 16] to predict each √N ×√N residual block by only using the previously encoded and reconstructed blocks. Each predicted residual block is repre-sented as a 2D graph with self-loops in each vertex and unit weight edges following a 4-connected pattern. The GBT-L is then computed based on this graph and used to transform the actual residual block. By following such a prediction strategy, it is possible to recover the residual block at the decoder without signalling any additional information, as the exact same prediction can be performed at the decoder [17] (see Fig. 4(b)). Specifically, based on the residual block predicted by the encoder, the same 2D graph can be computed to obtain the inverse GBT-L.
Search Window . . . . . . . .. . .. P n X Tn Pn Reference Samples P2 P1 T2 T1 Graph Best Intra-prediction Mode Selection Predicted Block (B) Residual Signal (C = A - B)
[image:6.612.99.519.72.284.2]Coefficients Graph Based Transformation Quantization Entropy Encoding Bit Stream Template-based Prediction Predicted Residual Original Block (A) (a) Reconstructed Region . . . . . . . .. . .. P n x tk Pk Reference Samples P2 P1 t2 t1 Graph Predicted Block (B) Reconstructed Block (A’ = B + C’) Inverse Graph Based Transformation Entropy Decoding Bit Stream De-quantization Predicted Residual Block Intra Prediction Template-based Prediction Reconstructed Residual Block (C’) Intra-prediction Mode (b)
Figure 4: Block diagram of the proposed framework for (a) encoding and (b) decoding.
Search window in the residual or pixel domain
. . . .. . ..
Pn
x t1 t2 tk
P1 P2 Pk
. . . .. . .. . . . .. . .. Target Block Candidate blocks Candidate Template Target Template
Target Template (x)
8 x 8 Target
Block (Pn)
Patch
(b) (a)
Figure 5: (a) Search window used to find blocks to predict the target block. (b) Sample target template and target block.
absolute differences (SAD) between the target template and a candidate template as the criterion to select thesek templates. Pis then predicted as a weighted average of the candidate blocksP1, ...Pk, one for each of thek-most similar candidate templates.
Weighted template pooling uses a weighted average of all the previously encoded and reconstructed blocks to predict the target block. The weights used to average these blocks are computed based on the similarity of their templates with the target template, in terms of the SAD. We use templates of 4 rows and 4 columns, which results in 72 samples surrounding a block to the left and above (see Fig. 5(b)). The higher the similarity among the target and the candidate templates used for prediction, the higher the prediction accuracy of the target block. We perform the template-based strategies in two domains: the residual and pixel domains.
[image:6.612.165.448.332.442.2]Input frame Predicted frame Residual frame
Predicted residual frame
Search Window
. . . . .
P
n x tk
Pk t1
P1 t2
[image:7.612.91.523.74.185.2]P2
Figure 6: Template-based prediction in the residual domain.
Input frame Predicted frame
Predicted input frame
Predicted residual frame
Search Window
. . . . . .. . ..
In
x
t1 t2 t
k
I1 I2 Ik
Figure 7: Template-based prediction in the pixel domain.
the k-most similar candidate templates, the target template: min
w kx−Twk 2 2 s.t.
X
k
wk = 1, (2)
where vectorxcontains the residual values of the target template, matrixTcontains the residual values of the k-most similar candidate templates, and w = [w1,· · · , wk]
is a weight vector. The nth target residual block, Pn, is then predicted as as P˜n by
using the k-most similar candidate blocks, as follows:
˜
Pn =w1P1+w2P2+...+wkPk. (3)
For the case of the weighted template pooling strategy, the residual signals of the
n−1 previously encoded and reconstructed blocks are used to predict thenth target residual block, as follows:
˜
Pn =w1P1+w2P2+...+wn−1Pn−1, (4)
where the weight for the jth candidate block is:
wj =e
kx−tjk22
h2 , (5)
where tj is the jth candidate template and h is the average of standard deviation of
the samples of the j−1 candidate templates.
Template-based prediction in the pixel domain: The prediction of the target residual block is performed by using the previously encoded and reconstructed blocks. In other words, the target block is first predicted in the pixel domain. This predicted target block is then subtracted from the corresponding predicted block computed by angular intra-prediction to compute the predicted residual block. This is illustrated in Fig. 7. For the case of template matching, we first compute˜In, the predicted block
for the nth target block in the pixel domain, denoted byIn, as follows:
˜In=w1I1+w2I2+...+wkIk, (6)
where I1,I2,...,Ik are the k-most similar candidate blocks in the pixel domain, and
w1,w2,...,wk are the weights as computed by Eq.(2). Note that in the pixel domain,
Eq. (2) uses templates comprising pixel values instead of residual values.
For the case of weighted template pooling, we predictIn using then−1 previously
coded and reconstructed blocks, as follows:
˜In=w1I1+w2I2+...+wn−1In−1, (7)
where weights w1,w2,...,wn−1 are computed by Eq. (5) with candidate templates
comprising pixel values. We subtract ˜In from the corresponding predicted block
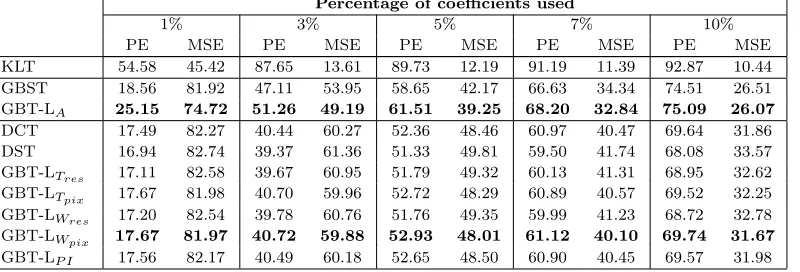
Table 1: Average PE (in %) and MSE using a small percentage of the largest coefficients.
Percentage of coefficients used
1% 3% 5% 7% 10%
PE MSE PE MSE PE MSE PE MSE PE MSE KLT 54.58 45.42 87.65 13.61 89.73 12.19 91.19 11.39 92.87 10.44 GBST 18.56 81.92 47.11 53.95 58.65 42.17 66.63 34.34 74.51 26.51 GBT-LA 25.15 74.72 51.26 49.19 61.51 39.25 68.20 32.84 75.09 26.07
DCT 17.49 82.27 40.44 60.27 52.36 48.46 60.97 40.47 69.64 31.86 DST 16.94 82.74 39.37 61.36 51.33 49.81 59.50 41.74 68.08 33.57 GBT-LTres 17.11 82.58 39.67 60.95 51.79 49.32 60.13 41.31 68.95 32.62
GBT-LTpix 17.67 81.98 40.70 59.96 52.72 48.29 60.89 40.57 69.52 32.25
GBT-LWres 17.20 82.54 39.78 60.76 51.76 49.35 59.99 41.23 68.72 32.78
GBT-LWpix 17.67 81.97 40.72 59.88 52.93 48.01 61.12 40.10 69.74 31.67
GBT-LP I 17.56 82.17 40.49 60.18 52.65 48.50 60.90 40.45 69.57 31.98
4. Performance Evaluation
The proposed GBT-L and our coding framework are evaluated on 30 different YUV frames of standard test video sequences of class A, B, C, D, E and screen content (SC). We also use pathology images in RGB format from the Center for Biomedical Informatics and Information Technology of the US National Cancer Institute [20] in the evaluation. We use the 35 intra-predicton modes of HEVC to compute the residual blocks. We use blocks of 8×8 pixels on the Y and G components of the video frames and pathology images, respectively.
We compare the performance of the GBT-L using template matching in the resid-ual (GBT-LTres) and the pixel (GBT-LTpix) domains, the GBT-L using weighted
tem-plate pooling in the residual (GBT-LWres) and the pixel (GBT-LWpix) domains, the
GBT-L using the prediction inaccuracy modelling (GBT-LP I) proposed in our
previ-ous work [17], the DCT, and the DST as implemented in HEVC.
The performance of all transforms is measured in terms of the percentage of pre-served energy (PE) by reconstructing the image using a sub-set of the largest coef-ficients, and the corresponding MSE. No quantization is used to clearly understand the advantages of each transform in terms of energy compaction and reconstruction error using the largest coefficients. The sub-set of coefficients used for reconstruction is selected by setting a threshold that indicates the minimum absolute value that the coefficients in the sub-set should have. By gradually decreasing an initial large threshold, this approach gradually includes in the sub-set the largest coefficients. Consequently, we do not follow any conventional scanning pattern as commonly done in modern codecs. This strategy allows selecting the largest coefficients, regardless of their frequency type.
Our evaluations also include three baseline transforms: the KLT, the GBT-L when the graphs are computed using the actual residual blocks (GBT-LA), and a GBST with
self-loops in every vertex, whose weights are computed by Eq.(1) using actual residual values. Note that these baselines require the signaling of additional information to compute the corresponding inverse transforms. Evaluation of the GBT-LA, however,
(a) (b)
(c) (d)
Figure 8: (a,b) PE (%) and (c,d) MSE vs. percentage of coefficient used for reconstruction
of a frame of sequence KristenAndSara.
Table 1 presents the average PE (%) and MSE values for all evaluated data using a small percentage of coefficients. As expected, the KLT provides the best performance. Compared to the GBST, the GBT-LA attains higher PE and lower MSE values. This
confirms the advantages of constructing GBTs using 2D graphs. For example, by using only 5% of the largest coefficients , the GBT-LAcan preserve 4.87% more energy
than the GBST. The GBT-LAalso outperforms the DCT and DST. The GBT-LAcan
preserve 19.83% and 17.47% more energy than the DST and DCT, respectively, by using only 5% of the largest coefficients. This confirms the advantages of using self-loops in every vertex of the 2D graph.
On average, the GBT-LWpix attains the best performance among the transforms
that require signaling no additional information to the decoder. The GBT-LWpix
preserves 3.11% and 1.08% more energy than the DST and DCT if only 5% of the co-efficients are used. Note that the GBT-L, when paired with template-based prediction in the residual domain, tends to perform poorly compared to using template-based prediction in the pixel domain. Predicting residual values is more challenging than predicting pixel values, as residual signals involve signed values [14]. Consequently, the template-based strategies in the residual domain are expected to attain less ac-curate predictions, hindering the performance of the GBT-L. In other words, the performance of the GBT-L is expected to improve as the prediction accuracy of the residual blocks improves.
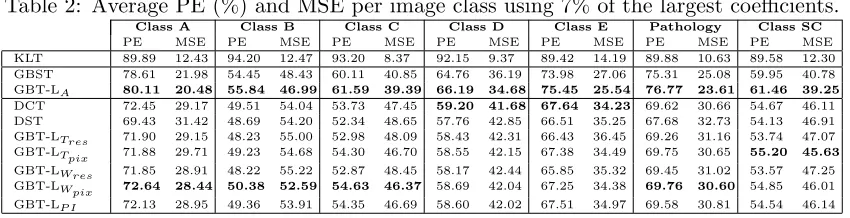
[image:9.612.125.485.79.368.2]Table 2: Average PE (%) and MSE per image class using 7% of the largest coefficients.
Class A Class B Class C Class D Class E Pathology Class SC
PE MSE PE MSE PE MSE PE MSE PE MSE PE MSE PE MSE
KLT 89.89 12.43 94.20 12.47 93.20 8.37 92.15 9.37 89.42 14.19 89.88 10.63 89.58 12.30
GBST 78.61 21.98 54.45 48.43 60.11 40.85 64.76 36.19 73.98 27.06 75.31 25.08 59.95 40.78
GBT-LA 80.11 20.48 55.84 46.99 61.59 39.39 66.19 34.68 75.45 25.54 76.77 23.61 61.46 39.25
DCT 72.45 29.17 49.51 54.04 53.73 47.45 59.20 41.68 67.64 34.23 69.62 30.66 54.67 46.11
DST 69.43 31.42 48.69 54.20 52.34 48.65 57.76 42.85 66.51 35.25 67.68 32.73 54.13 46.91
GBT-LTres 71.90 29.15 48.23 55.00 52.98 48.09 58.43 42.31 66.43 36.45 69.26 31.16 53.74 47.07
GBT-LTpix 71.88 29.71 49.23 54.68 54.30 46.70 58.55 42.15 67.38 34.49 69.75 30.65 55.20 45.63
GBT-LWres 71.85 28.91 48.22 55.22 52.87 48.45 58.17 42.44 65.85 35.32 69.45 31.02 53.57 47.25
GBT-LWpix 72.64 28.44 50.38 52.59 54.63 46.37 58.69 42.04 67.25 34.38 69.76 30.60 54.85 46.01
GBT-LP I 72.13 28.95 49.36 53.91 54.35 46.69 58.60 42.02 67.51 34.97 69.58 30.81 54.54 46.14
and pathology images, the GBT-LWpix attains the best performance among those
that require no extra signalling information. For class D and E, the DCT is the best transform. Frames of these two classes depict several smooth regions. The DCT is then well-suited for this content, as it approximates the KLT basis functions of natural images. Fig. 8 plots the PE (%) and MSE values vs. the percentage of coefficients used for reconstruction of a video frame, where the MSE values are normalized with respect to the maximum value attained when no coefficients are used for reconstruction. Note that the GBT-LA clearly outperforms the DCT and
DST. The GBT-LWpix indeed outperforms all other transforms that require no extra
signalling information.
5. Conclusion
In this paper, we proposed the GBT-L, a new class of GBT constructed based on a 2D graph with unit edge weights and weighted self-loops in every vertex. We showed that the first basis function of the GBT-L closely resembles the residual block to be transformed, which allows to preserve more energy by using a small percentage of the largest coefficients. We also presented a coding framework that allows employing the GBT-L on intra-predicted residual blocks without the need to signal information about the graphs to the decoder. The framework uses template-based strategies to predict the residual blocks in the residual or pixel domains. We evaluated the performance of the GBT-L in terms of the PE (%) and MSE when a small percentage of the largest coefficients are used for reconstruction. Evaluation results show that, as the prediction accuracy of the residual blocks improves, the improvements of the GBT-L over the DCT, DST and the GBST also increase. When only 5% of the largest coefficients are used, the GBT-L, when computed based on actual residual blocks, can preserve up to 19.83% and 17.47% more energy than the DST and DCT, respectively.
References
[1] C Zhang and D AF Florˆencio, “Analyzing the optimality of predictive transform coding
using graph-based models.,” IEEE Signal Process. Lett., vol. 20, no. 1, pp. 106–109,
2013.
[2] J-R Ohm, G J Sullivan, H Schwarz, T K Tan, and T Wiegand, “Comparison of
the coding efficiency of video coding standardsincluding high efficiency video coding
(hevc),” IEEE Trans. circuits and systems for video technology, vol. 22, no. 12, pp.
1669–1684, 2012.
[3] V Sanchez and M Hern´andez-Cabronero, “Graph-based rate control in pathology
[4] Victor Sanchez, Panos Nasiopoulos, and Rafeef Abugharbieh, “Efficient 4d motion
compensated lossless compression of dynamic volumetric medical image data,” in
In-ternational Conference on Acoustics, Speech and Signal Processing, (ICASSP). IEEE, 2008, pp. 549–552.
[5] Victor Sanchez, Francesc Auli-Llinas, Rahul Vanam, and Joan Bartrina-Rapesta, “Rate control for lossless region of interest coding in hevc intra-coding with
appli-cations to digital pathology images,” inInternational Conference on Acoustics, Speech
and Signal Processing, (ICASSP). IEEE, 2015, pp. 1250–1254.
[6] G J Sullivan, J R Ohm, W J Han, T Wiegand, et al., “Overview of the high efficiency
video coding(hevc) standard,” IEEE Trans. circuits and systems for video technology,
vol. 22, no. 12, pp. 1649–1668, 2012.
[7] V Sanchez, F Aul´ı-Llin`as, J Bartrina-Rapesta, and J Serra-Sagrist`a, “Hevc-based
lossless compression of whole slide pathology images,” in Global Conf. Signal and
Information Processing (GlobalSIP). IEEE, 2014, pp. 297–301.
[8] M Hern´andez-Cabronero, F Aul´ı-Llin`as, V Sanchez, and J S Sagrist`a, “Transform
op-timization for the lossy coding of pathology whole-slide images,” inData Compression
Conference (DCC), 2016, pp. 131–140.
[9] A Skodras, C Christopoulos, and T Ebrahimi, “The jpeg 2000 still image compression
standard,” IEEE Signal Processing magazine, vol. 18, no. 5, pp. 36–58, 2001.
[10] A Saxena and F C Fernandes, “Dct/dst-based transform coding for intra prediction in
image/video coding,” IEEE Trans. Image Processing, vol. 22, no. 10, pp. 3974–3981,
2013.
[11] D I Shuman, S K Narang, P Frossard, A Ortega, and P Vandergheynst, “The emerg-ing field of signal processemerg-ing on graphs: Extendemerg-ing high-dimensional data analysis to
networks and other irregular domains,” IEEE Signal Processing Magazine, vol. 30, no.
3, pp. 83–98, 2013.
[12] E Pavez, A Ortega, and D Mukherjee, “Learning separable transforms by inverse
covariance estimation,” in Int. Conf. Image Processing (ICIP), 2017, pp. 285–289.
[13] J Lainema, F Bossen, WJ Han, J Min, and K Ugur, “Intra coding of the hevc standard,” IEEE Trans. Circuits and Systems for Video Tech, vol. 22, no. 12, pp. 1792–1801, 2012.
[14] V Sanchez, F Aul´ı-Llin`as, and J Serra-Sagrist`a, “Piecewise mapping in hevc lossless
intra-prediction coding,” IEEE Trans. Image Processing, vol. 25, no. 9, pp. 4004–4017,
2016.
[15] T K Tan, C S Boon, and Y Suzuki, “Intra prediction by template matching,” in Int.
Conf. Image Processing (ICIP), 2006, pp. 1693–1696.
[16] C Lan, J Xu, W Zeng, G Shi, and F Wu, “Variable block-sized signal-dependent
transform for video coding,” IEEE Trans. Circuits and Systems for Video Tech, vol.
28, no. 8, pp. 1920–1933, 2018.
[17] D Roy and V Sanchez, “Graph-based transforms based on prediction inaccuracy
mod-eling for pathology image coding,” inData Compression Conference (DCC), 2018, pp.
157–166.
[18] C Lan, J Xu, F Wu, and G Shi, “Intra frame coding with template matching prediction
and adaptive transform,” inInt. Conf. Image Processing (ICIP), 2010, pp. 1221–1224.
[19] Y Suzuki, C S Boon, and T K Tan, “Video encoding scheme employing intra and inter
prediction based on averaged template matching predictors,” IEICE Trans.
Informa-tion and Systems, vol. 91, no. 4, pp. 1127–1134, 2008.
[20] The Cancer Genome Atlas National Cancer Institute, National Institute of
Health. Available, “The cancer genome atlas,” https://tcga-data.nci.nih.gov.,