Lasing within live cells containing intracellular
optical micro-resonators for barcode-type cell
tagging and tracking
Marcel Schubert1, Anja Steude1, Philipp Liehm1, Nils M. Kronenberg1, Markus Karl1, Elaine C. Campbell2, Simon J. Powis2, and Malte C. Gather1*
1 SUPA, School of Physics and Astronomy, University of St. Andrews, St Andrews, Fife,
Scotland, United Kingdom
ABSTRACT
We report on a laser that is fully embedded into a single live cell. By harnessing natural
endocytosis of the cell we introduce a fluorescent whispering gallery mode (WGM)
micro-resonator into the cell cytoplasm. On pumping with nanojoule light pulses, green laser emission
is generated inside the cells. Our approach can be applied to different cell types and cells with
micro-resonators remain viable for weeks under standard conditions. The characteristics of the
lasing spectrum provide each cell with a barcode-type label which enables uniquely identifying
and tracking of individual migrating cells. Self-sustained lasing from cells paves the way to new
forms of cell tracking, intracellular sensing and adaptive imaging.
Keywords: Biological lasers, intracellular lasing, Whispering Gallery Mode resonator, opsonized
beads, multiplexing, cell tracking and tagging
Integration of photonic and electronic devices into biological systems is a promising route to
versatile biosensing and enhanced in-vivo imaging1-6. As sensing and imaging in biophotonics
often relies on laser light, integration of lasers with biological systems is increasingly seen as a
promising route to complementing and expanding the capability of current sensing and imaging
techniques7. Like other lasers, such biointegrated laser sources will require three principal
components—gain medium, optical feedback structure and pump source. Recently, naturally
produced fluorescent proteins and vitamins were used as gain medium in different laser
structures8-10. Cells expressing fluorescent protein were also utilized directly as gain medium11,12.
However, these lasers required extracellular optical feedback structures that were much larger
than typical cells and thus have limited potential for biointegration. Future applications of
biolasers will require self-sustained generation of laser light, i.e. the integration of optical
feedback into single cells without compromising their biological function.
Whispering gallery mode (WGM) micro-sphere resonators13,14 confine light by total internal
reflection and can provide optical feedback in a range of micro-laser configurations, e.g. as
dielectric micro-spheres loaded with synthetic dyes15,16. Due to their large quality factor (Q > 108
has been reported)13, compact size, and relative ease of fabrication, we hypothesize that they are
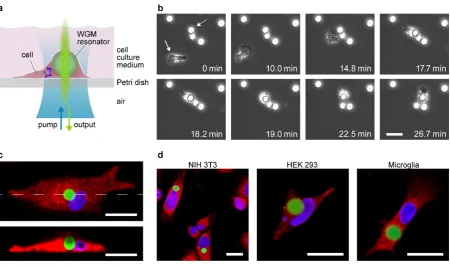
promising for intracellular lasing when internalized by cells as schematically illustrated in
Fig. 1a. The lasing wavelength and threshold of micro-sphere lasers depend critically on sphere
size and on the refractive index contrast between the sphere and the surrounding medium. The
micro-sphere resonators used in this work consisted of polystyrene divinylbenzene (PS-DVB)
and had radii varying between 5 and 10 µm, i.e. smaller than most eukaryotic cells. Optical gain
refractive index of PS-DVB at 510 nm is nPS = 1.60, providing considerable index contrast for
the micro-spheres to act as WGM resonators inside cells (ncell ≈ 1.375, Ref. 17).
The ability of cells to internalize PS-DVB micro-spheres was tested with four different cell
types: primary human macrophages, primary mouse microglia cells, mouse fibroblasts (NIH
3T3) and human embryonic kidney cells (HEK 293). A dispersion of PS-DVB micro-spheres
was added to culture dishes containing the different cells and the interaction of the cells with the
spheres was monitored under the microscope. Figure 1b and Supplementary Video 1 show a
representative time-lapse series of a macrophage cell, starting 1 h after addition of the
micro-spheres. During its random migration, the cell reached a micro-sphere (at time 14.8 min) and
within less than five minutes internalized the entire sphere. Afterwards, the cell remained motile,
dragging the internalized sphere along (time 18.2 to 26.7 min).
To study the internalization of micro-spheres further, we fluorescently labelled the nucleus and
the cytoplasm of cells that were incubated with micro-spheres for 72 h and investigated them by
confocal laser scanning microscopy (CLSM). Figure 1c shows a CLSM maximum intensity
projection and a cross section for a typical macrophage (also see Supplementary Video 2). The
high refractive index and the strong fluorescence of the micro-sphere distort the CLSM image, in
particular the upper half of the sphere in the cross section. However, the images show clearly that
the micro-sphere is fully enclosed by the cell. The same situation was observed for the other
three investigated cell types (Figure 1d, Supplementary Figure 1). If kept at appropriate
temperature and CO2 level, cells containing micro-spheres remained viable for at least four
Figure 1. Self-sustained lasing from live cells containing intracellular optical resonators.
(a) Schematic illustration of the intracellular laser. When kept under standard culture conditions
cells internalize a whispering gallery mode micro-sphere resonator by natural endocytosis
thereby eliminating the need for an extra-cellular resonator structure. Supply of pump light and
detection of laser output are performed through a common imaging pathway. (b) Time-lapse
microscopy of primary human macrophage cell (solid arrow) internalizing a micro-sphere
resonator (dashed arrow). Numbers, time after start of measurement. (c) Confocal laser scanning
microscopy (CLSM) data of a macrophage with cytoplasm (red fluorescence), cell nucleus (blue
fluorescence) and internalized micro-sphere resonator (green fluorescence). Maximum intensity
projection (top) and cross section along the dashed line (bottom). (d) Maximum intensity
projection CLSM images for three further cell types—NIH 3T3 fibroblasts, Human Embryonic
Kidney 293 and primary mouse microglia. For all three, spontaneous internalization of
Macrophages and microglia play an important role in the immune system and are capable of
ingesting foreign objects (by endocytosis) that measure up to nearly twice their own
diameter18,19. By contrast, NIH 3T3 and HEK 293 are cell lines without particularly pronounced
capacity for endocytosis but these cells also readily internalized micro-spheres. Endocytosis of
micrometre-sized objects has also been reported for other cell lines20. Introducing optical
feedback structures in this way is thus a viable approach for a large variety of different cell types.
We next tested the ability of the micro-sphere containing cells to produce laser light. Using a
custom-built microscope setup with 500 nm dichroic beam splitter, 40x objective and cell
incubator, the nanosecond pulsed output of an optical parametric oscillator (OPO) laser system
tuned to 470 nm was delivered to individual micro-sphere containing cells through the bottom of
the culture dish. Emission from the cell was collected with the same objective, separated from
back-reflected excitation light by the dichroic beam splitter and directed to a spectrometer.
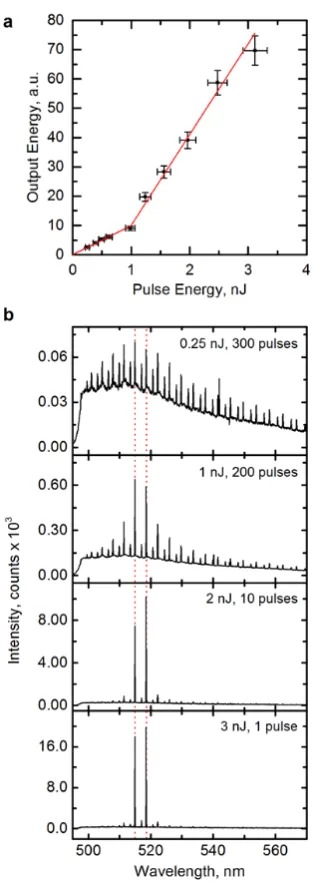
Figure 2a shows the spectrally integrated emission of an individual cell as function of pump
pulse energy. The data show a distinct threshold at 1.0 0.1 nJ (corresponding to 0.6 mJ cm-2);
for higher pump energies, the increase in emission from the cell was significantly steeper than at
Figure 2. Characteristics of intracellular micro-sphere laser. (a) Output energy of laser as a
function of energy of blue-light (470 nm) pump pulses. Red lines: linear fits to data below and
above 1 nJ pump pulse energy. (b) Output spectra below threshold (0.25 nJ), at threshold (1 nJ)
and at two points above the lasing threshold (2 and 3 nJ). Dotted red lines mark the two
wavelengths of laser emission. Pulse number indicates number of pump pulses required to
For pump energies below the lasing threshold, the emission spectrum of the micro-sphere
showed a series of regularly separated pairs of emission peaks; each larger peak was paired with
a weaker blue-shifted peak (Fig. 2b, 0.25 nJ). This pattern is consistent with coupling to the
transverse electric (TE, larger peaks) and transverse magnetic (TM, smaller blue-shifted peaks)
modes of the WGM resonator13,14. (TE and TM are defined with respect to the micro-sphere
surface, Supplementary Fig. 2.) Around the lasing threshold, two TE peaks close to the
maximum emission wavelength of the green fluorescent dye began to gain in relative intensity
(1 nJ) and eventually completely dominated the emission spectrum (2 and 3 nJ), providing
further evidence for laser action inside the cell. (Lasing is expected to occur predominantly from
TE modes due to their higher quality factor16.) Over the investigated range of pump energies, the
spectral position of the peaks shifted by < 0.05 nm. We note that above the lasing threshold a
clean spectrum can be obtained by collecting light from just one laser pulse, while below
threshold integration over hundreds of pulses was necessary to achieve good signal-to-noise
ratio.
To confirm that the observed spectral pattern is due to a series of TE and TM modes of the
WGM resonator (with different angular mode numbers l), we calculated the wavelengths of these
modes by solving the 2D polar Helmholtz equation21. Assuming nPS = 1.6 and ncell = 1.375, the
peaks at 514.9 nm and 518.6 nm correspond to TE modes with l = 135 and 134, respectively, and
to a micro-sphere radius of 7.41 µm, consistent with microscope images of the investigated cell.
The dominant lasing wavelength (λmax) and the spacing between the two TE peaks in the lasing
spectrum (Δλ) differ between different intracellular lasers. We propose to use this as
barcode-type cell label to unambiguously distinguish a large number of cells and to track cell migration
macrophages with internalized micro-spheres was followed for 19 h (Figure 3a, Supplementary
Video 3). All cells were motile and changed shape over the course of the experiment, but
migration patterns varied between cells as expected. The lasing spectrum of each cell was
recorded at 0, 7 and 19 h (Figure 3b). Each cell was characterized by a unique spectrum that was
clearly different from the spectra of all other cells and that remained unchanged over the entire
course of the experiment, indicating that the spectrum is specific to each intracellular laser and
showing clearly that the resonator is not damaged during the experiment. Only for one cell
(Cell C3), λmax shifted by a noticeable amount (between 7 h and 19 h). However, even here the
shift was only 0.15 nm and Δλ was not affected (Δλ = 4.638 nm).
The cells remained viable and highly motile over the entire 19 h course of the measurement
(during which the lasing spectra were recorded three times) and cells transported the
micro-sphere resonators over substantial distances (many times the size of the cells). Cell damage was
only observed when we pumped the cells continuously for several minutes, i.e. by several
thousand pump pulses, and well above the threshold. Such extreme conditions are not required
for any foreseeable application of the cell lasers as the complete spectrum can be obtained by a
single excitation pulse. The light dose a cell is exposed to when acquiring its lasing spectrum
(pump flux, ~1 mJ cm-2) in fact is equivalent to the dose needed to record a typical
epi-fluorescence image (100 ms exposure at 10 mW cm-2). We further found that the viability of
macrophages over a 3 week time-course (the longest we studied so far) was the same for cells
with and without internalized micro-spheres, indicating that the resonators are not harmful to the
Figure 3. Application of emission from intracellular lasers as tags for tracking and identification
of individual freely migrating cells. (a) Bright-field image of six primary macrophage cells with
internalized micro-sphere resonators (labelled C1 to C6) at the beginning of the experiment.
Coloured solid traces indicate the migration path of each cell over the 19 h time frame of the
experiment. Orange dashed lines indicate time gap during which lasing experiments were
performed. Scale bar, 100 µm. (b) Left: Lasing spectra from each cell at 0 h, 7 h and 19 h.
Arrows indicate spectral separation between the transverse electric (TE) modes (Δλ). Right:
Bright field images of each cell at 0h. Scale bar, 20 µm. (c) Dominant lasing wavelength (λmax)
randomly selected intracellular lasers from the same dish as in b. Cells from b are labelled. Error
bars, TE mode separation ±0.015 nm (resolution of spectrometer), λmax ±0.15 nm (derived from
wavelength shift of Cell C3 in b).
Figure 3c summarizes λmax and Δλ for the cells from Figure 3b and for a further 35 cells
(brightfield images, Supplementary Figure 3) from the same culture dish and shows that all but
two cells can be reliably distinguished. (All intracellular lasers had thresholds of 0.5 - 7 nJ.) For
the micro-spheres used here, λmax was within a range of 8 nm, and Δλ varied by 2 nm. Given the
temporal stability of λmax and Δλ and the small uncertainty in measuring them (0.3 nm for λmax
and 0.03 nm for Δλ; see error bars in Figure 3c), one could track over a thousand cells without
overfilling the λmax-Δλ parameter space. Assuming that intracellular lasers are distinguishable if
the spectral separation is at least twice the measurement uncertainty, the number of
distinguishable lasers is (8 nm/0.3 nm) (2 nm/0.03 nm) 1800. On the Δλ axis the 0.03 nm
uncertainty corresponds to an ability to distinguish resonators that differ in radius by 35 nm. In
the future, even smaller size difference could be resolved by using a higher resolution
spectrometer. In this context the narrow linewidth of intracellular lasers is advantageous over
non-lasing micro-sphere resonators, analogous to the situation for WGM biosensors16.
In the future, to increase the number of uniquely tagged cells further, micro-spheres stained
with different dyes can be spectrally multiplexed. In our experiments, cell lasing occurs across an
approximately 10 nm spectral range close to the emission peak of the dye, therefore enabling use
of a larger number of dyes than would be possible with conventional fluorescence spectroscopy
where multiplexing is usually limited to four to five dyes across the visible part of the spectrum
emitting across the visible spectrum could be used for staining micro-spheres, yielding a total of
~105 cells that can be unambiguously tagged.
Our method can be applied in scenarios where tracking cells from a sequence of bright-field
images is impossible or impractical, e.g. for long-term studies involving multiple dishes that
cannot be monitored continuously, for confluent cells, for cells in 3D tissue scaffolds and to tag
cells in vivo. Read-out of the lasing characteristics requires only one ns pump pulse (see Fig. 2b,
3 nJ), rendering our approach well suited for high throughput detection. Existing cell tagging
techniques rely on spectrally distinct fluorescent dye or quantum dot tags, on imaging
barcode-type microstructures attached to cells22,23 or on microscopic radio-frequency (RF) identification
tags24. Our intracellular laser tags offer several unique advantages over these: They facilitate
tracking of a vastly larger number of different cells than fluorescent tags; their fabrication is less
complex than for RF and microstructure tags; they can be localized with better spatial resolution
than RF tags; the requirements for optical access are less stringent than for imaging
microstructures which is particularly relevant for applications in tissue scaffolds or in vivo.
From the width of the emission peaks in the sub-threshold emission spectrum of one of the
smallest intracellular lasers that we analyzed (radius 6.5µm, threshold 5 nJ), we estimate that the
quality factor of this resonator is ≈ 10,000. From this number, the modal optical gain at
threshold can be estimated as 19 cm-1, consistent with the gain available in
state-of-the-art organic gain materials25 (modal refractive index ; , vacuum wavelength). In the
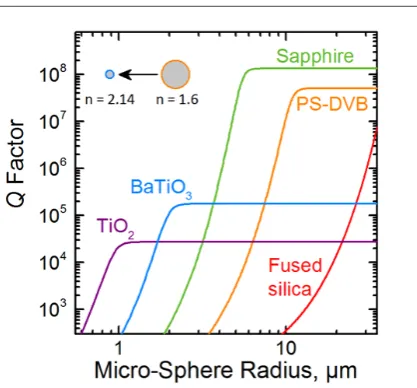
future, shrinking resonator size is likely to simplify integration with cells further. To evaluate
routes to reducing resonator size, we estimated the dependence of the quality factor of a
micro-sphere resonator located inside a cell (ncell = 1.375) on sphere radius and refractive index, using
grows quickly but then reaches an upper limit given by material absorption. The absolute value
of depends strongly on the refractive index of the micro-sphere. While the widely used
low-index fused silica (n = 1.46) micro-spheres do not achieve useful at biologically relevant radii
when inside a cell, barium titanate micro-spheres (BaTiO3, n = 2.14) reach ≈ 10,000 at a 3.8
times smaller radius than PS-DVB micro-spheres (see inset of Figure 4), reducing the volume of
the resonator by a factor of 55. Finally, other resonator concepts, in particular metal based
[image:13.595.191.400.319.513.2]plasmonic cavity structures, may provide further scope for reducing resonator size26,27.
Figure 4. Calculated Q factors for WGM micro-sphere resonators made of different optical
materials as a function of resonator size. The surrounding medium was assumed to have a
refractive index of 1.375 (the average refractive index of a typical cell). For PS-DVB and quartz,
a vacuum wavelength of λ = 520 nm was assumed; data for the other materials was computed at
λ = 600 nm where the absorption of these materials is less. The inset illustrates the relative
sizes of a PS-DVB and a BaTiO3 micro-sphere, with 5.7 µm and 1.5 µm radius, respectively;
both micro-spheres have a predicted Q factor of 10,000. Numbers indicate the refractive index of
In contrast to previous demonstrations of biolasing, the intracellular WGM lasers presented
here are fully contained within single cells, are formed by a natural, biologically driven process
that can be readily scaled28, and enable unique tagging and tracking of large numbers of cells.
We expect that this breakthrough in biointegration of micro-lasers will lead to applications in
structural and functional in vivo imaging: Intracellular lasers pumped by non-ballistic diffuse
photons may be used to monitor the migration of macrophages to sites of inflammation29 and
dendritic cells in local lymph nodes30, thus visualizing local structures during immune responses
or to map the trajectory of circulating tumor cells31.
Methods
Cell culture and micro-sphere internalization: Plastic adherent CD14+ macrophage cells were
isolated from blood samples obtained from normal healthy human donors under informed ethical
consent from the School of Medicine, University of St Andrews. Flow cytometry confirmed the
cells as CD14+ macrophages (Supplementary Fig 4). Microglia cells were isolated from the
cerebral cortex of postnatal day 2 mice following the procedure described in Ref. 32. NIH 3T3
and HEK 293 cells were obtained from Sigma Aldrich. Cells were cultured in RPMI (primary
macrophages) or DMEM (microglia, HEK 293, NIH 3T3) medium with 10vol% fetal calf serum
and 1vol% penicillin-streptomycin solution. 10vol% horse serum were added for microglia
cultures. PS-DVB micro-spheres that were internally stained with the Firefli™ Green dye were
purchased from Fisher Scientific. Staining was stable in water and ethanol. Micro-spheres were
dispersed in 70% ethanol and incubated for 1h for sterilization. Ethanol was exchanged for PBS
buffer and the micro-sphere concentration was adjusted to 2 × 10⁶ mL-1. 10 µL of the dispersion
Imaging of resonator uptake: To observe uptake of the micro-sphere resonators, the cell
containing dishes were transferred to a stage-top microscope incubator (OkoLab, H301, set to
37°C, 5% CO2, 95% rel. humidity) and observed with an inverted optical fluorescence
microscope (Nikon, Ti-S). Long-term cell viability was assessed by observing cell motility and
proliferation. CLSM (Leica, TCS SP8) was used to image the cell cytoplasm (red fluorescence,
stained with CellTrackerTM dye, LifeTechnologies), the cell nucleus (blue fluorescence, Hoechst
33342, Sigma Aldrich) and the internalized micro-sphere resonator (green fluorescence). Cells
were stained 1 to 2 h prior to CLSM and transferred to pH indicator-free medium right before the
measurements to reduce background fluorescence. CLSM was performed under standard
ambient conditions.
Laser characterization: A custom built microscopy setup was used for laser characterization.
The cell containing dish was transferred to a stage-top microscope incubator mounted on a
micro-positioning stage. Koehler type bright-field illumination with a white LED and a 10x or
40x objective were used to image cells. Optical pumping was achieved by an OPO laser system
(Opotek; pulse duration, 5 ns; set to 10 Hz repetition rate). Pump light was directed onto
individual cells with a dichroic mirror (500 nm, long-pass) and the 40x objective, yielding a
pump-spot diameter of ~15 µm. Emission from the cells was collected through the same
objective, passed through the dichroic mirror and a further 500 nm long-pass filter and imaged
onto the entrance slit of a 500 mm spectrograph coupled to a cooled CCD camera (Andor). To
determine the Q-factor of the micro-spheres, lasing spectra were recorded with a high resolution
grating (1800 lines mm-1) and Q was computed as the ratio of peak wavelength over peak width
(λ/Δλ). Neutral density filters were used to adjust the energy of the pump pulses. Pump pulse
and measured behind the 40x objective, i.e. they correspond directly to the pulse energy incident
on the cell and the resonator. The output energy of the intracellular laser was determined by
integrating the emission spectra between 514 and 520 nm.
Cell tagging and tracking: For the cell tracking experiments a series of overview images were
recorded with a 10x objective. The migration path of each cell was extracted using the Fiji
software with the plugin MTrackJ33. Lasing characteristics were recorded with a 40 x objective
for each cell at defined time points as described above.
ASSOCIATED CONTENT
Supporting Information
Additional CLSM data, hyperspectral images, bright field images of the intracellular lasers from
Figure 3c, flow cytometry data, time lapse video of bead uptake, CLSM z-stack video and time
lapse video of cell tagging experiment. This material is available free of charge via the Internet at
http://pubs.acs.org.
AUTHOR INFORMATION
Corresponding Author
*Email address: [email protected]
Author Contributions
MS characterized intracellular lasers, designed the cell tracking experiment, and performed and
preparing CLSM measurements. AS and NMK recorded time lapse microscopy data and
analysed bead uptake. PL prepared microglia cells. ECC and SJP prepared and analysed
macrophage samples. MK and MCG performed optical simulations. MCG conceived and
supervised the project, designed the intracellular lasing experiments and wrote the manuscript
with input and discussion from all authors. All authors have approved the final version of the
manuscript.
Funding Sources
This work was supported by the European Union Marie Curie Career Integration Grant
(PCIG12-GA-2012-334407) and the Scottish Funding Council (SUPA II). MS acknowledges
funding by the German Science Foundation (DFG) through a Research Fellowship (SCHU
3003/1-1).
Notes
The authors declare no competing financial interest.
ACKNOWLEDGEMENTS
We thank Jochen Guck (TU Dresden, Germany) and Valentina Emiliani (Universitate Paris
Descartes, France) for fruitful discussion.
REFERENCES
1 Kim, T. I. et al. Injectable, Cellular-Scale Optoelectronics with Applications for Wireless
Optogenetics. Science340, 211-216 (2013).
2 Yan, R. X. et al. Nanowire-based single-cell endoscopy. Nat. Nanotechnol. 7, 191-196 (2012).
3 Shambat, G. et al. Single-Cell Photonic Nanocavity Probes. Nano Lett. 13, 4999-5005 (2013).
4 Omenetto, F. G. & Kaplan, D. L. New Opportunities for an Ancient Material. Science
329, 528-531 (2010).
5 Hwang, S. W. et al. A Physically Transient Form of Silicon Electronics. Science 337, 1640-1644 (2012).
6 Ghezzi, D. et al. A polymer optoelectronic interface restores light sensitivity in blind rat
retinas. Nat. Photonics7, 400-406 (2013).
7 Fan, X. & Yun, S.-H. The potential of optofluidic biolasers. Nature Methods11, 141-147 (2014).
8 Vannahme, C., Maier-Flaig, F., Lemmer, U. & Kristensen, A. Single-mode biological distributed feedback laser. Lab Chip13, 2675-2678 (2013).
9 Chen, Q. S. et al. Highly sensitive fluorescent protein FRET detection using optofluidic
lasers. Lab Chip13, 2679-2681 (2013).
10 Nizamoglu, S., Gather, M. C. & Yun, S. H. All-Biomaterial Laser Using Vitamin and Biopolymers. Adv. Mater.25, 5943-5947 (2013).
11 Gather, M. C. & Yun, S. H. Single-cell biological lasers. Nat. Photonics 5, 406-410 (2011).
12 Jonáš, A. et al. In vitro and in vivo biolasing of fluorescent proteins suspended in liquid
microdroplet cavities. Lab Chip14, 3093-3100 (2014).
13 Chiasera, A. et al. Spherical whispering-gallery-mode microresonators. Laser Photon. Rev.4, 457-482 (2010).
14 Vollmer, F. & Yang, L. Label-free detection with high-Q microcavities: a review of biosensing mechanisms for integrated devices. Nanophotonics1, 267-291 (2012).
15 Kuwata-Gonokami, M. & Takeda, K. Polymer whispering gallery mode lasers. Opt. Mater.9, 12-17 (1998).
16 Francois, A. & Himmelhaus, M. Whispering gallery mode biosensor operated in the stimulated emission regime. Appl. Phys. Lett.94, 031101 (2009).
17 Ekpenyong, A. E. et al. Bacterial infection of macrophages induces decrease in refractive
index. J. Biophotonics6, 393-397 (2013).
18 Murray, P. J. & Wynn, T. A. Protective and pathogenic functions of macrophage subsets.
Nat. Rev. Immunol.11, 723-737 (2011).
19 Cannon, G. J. & Swanson, J. A. The macrophage capacity for phagocytosis. J. Cell Sci.
101, 907-913 (1992).
20 Gratton, S. E. A. et al. The effect of particle design on cellular internalization pathways. Proc. Natl. Acad. Sci. U. S. A.105, 11613-11618 (2008).
21 Bohren, C. F. & Huffman, D. R. Absorption and scattering of light by small particles.
(John Wiley & Sons, 2008).
23 Novo, S. et al. A novel embryo identification system by direct tagging of mouse embryos
using silicon-based barcodes. Human Reproduction26, 96-105 (2011).
24 Chen, L. Y. et al. Mass fabrication and delivery of 3D multilayer µTags into living cells. Scientific Reports3, 2295 (2013).
25 Samuel, I. D. W. & Turnbull, G. A. Organic semiconductor lasers. Chem. Rev. 107, 1272-1295 (2007).
26 Hess, O. et al. Active nanoplasmonic metamaterials. Nat. Mater.11, 573-584 (2012). 27 Ma, R. M., Oulton, R. F., Sorger, V. J. & Zhang, X. Plasmon lasers: coherent light source
at molecular scales. Laser Photon. Rev.7, 1-21 (2013).
28 Wu, Y.-C. et al. Massively parallel delivery of large cargo into mammalian cells with
light pulses. Nature Methods12, 439-444 (2015).
29 Grabher, C. et al. Birth and life of tissue macrophages and their migration in
embryogenesis and inflammation in medaka. J. Leukoc. Biol.81, 263-271 (2007).
30 Stoll, S., Delon, J., Brotz, T. M. & Germain, R. N. Dynamic imaging of T cell-dendritic cell interactions in lymph nodes. Science296, 1873-1876 (2002).
31 Zhe, X. N., Cher, M. L. & Bonfil, R. D. Circulating tumor cells: finding the needle in the haystack. Am. J. Cancer Res.1, 740-751 (2011).
32 Mecha, M. et al. An easy and fast way to obtain a high number of glial cells from rat
cerebral tissue: A beginners approach. Protocol Exchange (2011).
33 Meijering, E., Dzyubachyk, O. & Smal, I. Methods for Cell and Particle Tracking
Methods in Enzymology504, 183-200 (2012).