ORIGINAL RESEARCH
Diffusion Tensor Imaging of the Subcortical
Auditory Tract in Subjects with Congenital
Cochlear Nerve Deficiency
C.-M. Wu S.-H. Ng J.-J. Wang T.-C. Liu
BACKGROUND AND PURPOSE: Cochlear nerve deficiency (CND), including aplasia and hypoplasia, is a rare cause of congenital hearing loss. The purpose of this study was to evaluate the neuronal integrity of the subcortical auditory pathway in subjects with CND by diffusion tensor MR imaging (DTI).
MATERIALS AND METHODS:Twelve subjects with unilateral congenital CND were included in this prospective study. Twelve normal-hearing subjects served as controls. DTIs were acquired from these subjects on a 3T MR imaging scanner. Several indices including axial diffusivity (储), radial diffusivity (⬜), mean diffusivity (MD), and fractional anisotropy (FA) along the auditory pathway were extracted. Two regions of interest were selected bilaterally for evaluation: the lateral lemniscus (LL) and inferior colliculus (IC). The mean values of储,⬜, MD, and FA at both regions of interest were compared between the ipsilateral and contralateral sides of subjects with CND with those in the control group.
RESULTS: Significant decrease of FA and increase of MD on both the ipsilateral and contralateral sides of patients with CND as compared with normal subjects in both LL and IC were found. The decrease of FA was due to the increase of⬜, whereas储remained unchanged.
CONCLUSIONS:The maintained axial diffusion implied that the orientation of neural fibers along the subcortical auditory pathway in subjects with unilateral CND is intact. However, the reduction in FA and increase in⬜on both the ipsilateral and contralateral sides might be attributed to axonal loss and/or demyelination of the subcortical auditory tract in these subjects.
A
natomic cochlear nerve deficiency (CND), including aplasia and hypoplasia, is a rare cause of congenital hear-ing loss. It was estimated that CND accounts for approxi-mately 1% of all newly diagnosed cases of congenital sensori-neural hearing loss in the United States.1 It has also beendemonstrated that CND can occur in children with a wide range of internal auditory canal and labyrinthine morpholo-gies.1The development of the MR imaging⫺based
subcenti-meter cross-sectional technique has improved the diagnostic rate of CND.2Clinically, CND is considered to be an absolute
contraindication for cochlear implantation.3-5
The pathogenesis of CND remains unknown, and the eti-ology of unilateral occurrence still remains unexplained. Nel-son and Hinojosa6reported the histopathologic findings of
temporal bones in 2 cases with absent cochlear nerves but with a normal structure of the organ of Corti. Another study found that 70% of the ears with absent cochlear nerves demonstrated cochlear microphonics, which implies that hair cell functions can persist despite the absence of the cochlear nerve.7Another
study also documented that normal hair cell development can occur in the absence of innervation.8Conversely, the
develop-ment of spiral ganglion cells and the innervation of the inner
ears are dependent on the neurotrophic factors secreted by hair cells.9Although all these studies focused on the develop-mental relationship between the auditory nerve and hair cells of the inner ear, there has been no study investigating the neural integrity of the subcortical auditory projections central to the cochlear nerve in subjects with CND. The present study tried to address this issue by using the diffusion tensor imaging (DTI) technique.
DTI has become one of the most popular MR imaging techniques in brain research. It enables visualization and characterization of white matter fasciculi in 2 or 3 dimen-sions.10 In general, DTI measures the translational
dis-placement of water molecules, which was found to be much faster along the white matter fibers than perpendicular to them.11,12DTI provides a framework for acquisition,
anal-ysis, and quantification of the diffusion properties of white matter and has been used in detecting the subtle changes in the structure of tissue associated with brain development, degeneration, and injury.13-15
In DTI, the diffusivities parallel and perpendicular to the fiber (also named axial diffusivity [储] and radial diffusivity [⬜]) can be extracted from the eigenvalues of the tensor.11,12
Other commonly used indices include mean diffusivity (MD) and fractional anisotropy (FA). MD is a reflection of the am-plitude of diffusion. FA represents the degree of anisotropy of water molecules.16,17DTI has been used to study the auditory
tract in the brain stem and in subjects with sensorineural hear-ing loss.18-20
In this study, we investigated the integrity of the subcortical auditory pathways of subjects with congenital CND by using DTI in an effort to examine the changes in the functional in-tegrity of the white matter. The purpose was to detect any possible subtle changes and pathology of the nerve fibers along subcortical auditory pathways.
Received March 17, 2009; accepted after revision April 22.
From the Department of Otolaryngology (C.-M.W.), College of Medicine, Molecular Imaging Center (S.-H.N., J.-J.W.) and Departments of Diagnostic Radiology, and Medical Imaging and Radiological Sciences (S.-H.N., J.-J.W.), Chang-Gung University, Linkou, Taiwan; and Department of Otolaryngology (T.-C.L.), National Taiwan University Hospital, Taipei, Taiwan.
This work was supported by a grant from Chang Gung Memorial Hospital (Medical Research Project CMRPG34027) to S.-H.N.
Please address correspondence to: Tien-Chen Liu, MD, Department of Otolaryngology, National Taiwan University Hospital, Taipei, Taiwan; e-mail: [email protected] DOI 10.3174/ajnr.A1681
HEAD
&
NECK
ORIGINAL
Materials and Methods
Subjects
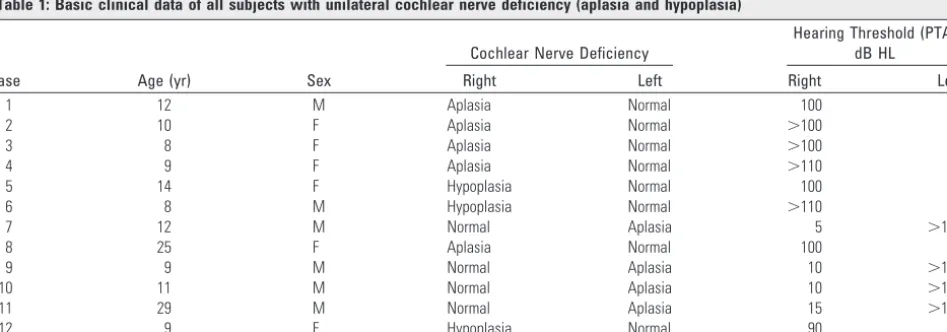
Twelve subjects with unilateral congenital CND participated in the study. There were 6 males and 6 females (range, 8 –29 years of age; mean, 13 years of age). The diagnosis was based on the findings of the internal auditory canal on their 3D MR imaging, which was per-formed with a 3D constructive interference in steady state (CISS) sequence on the 1.5T MR imaging scanner (Vision; Siemens, Erlan-gen, Germany) by using the following parameters: TR of 12 ms, TE of 6 ms, flip angle of 70°, slab thickness of 33.6 mm, 66 partitions, 448⫻ 5126 matrix, FOV of 170 mm, and effective section thickness of 0.5 mm. The nerves in the internal auditory canal were assessed with axial CISS images as well as coronal and sagittal CISS images reformed by multiplanar reconstruction. A sample image of aplasia and hypoplasia is shown in Fig 1. All 12 subjects have profound sensorineural hearing loss (pure tone thresholds,⬎90 dB hearing loss [HL]) on the affected side and normal hearing levels (pure tone thresholds,⬍25 dB HL) on the normal side. Twelve sex- and age-matched subjects with normal hearing served as controls. The basic clinical data of all subjects are listed in Table 1. This study was approved by the institutional review board of our university, and all patients who participated in the study signed the informed consent.
DTI Protocol
All studies were performed on a 3T MR imaging scanner (Trio, A TIM System; Siemens). DTI data were acquired by using a single-shot spin-echo spin-echo-planar imaging sequence with the following parameters: TR/TE of 3000/82 ms; FOV of 192 mm; and a matrix size of 128⫻
128, which leads to an in-plane resolution of 1.5 mm. Twenty-five contiguous axial sections of 2-mm thickness were obtained with a b-value of 1000 s/mm2. A non-diffusion-weighted image was
ac-quired. The diffusion-weighting gradients were applied along 12 non-collinear directions. Twenty averages were measured within the total acquisition time of 13 minutes 17 seconds.
The diffusion-tensor data were processed and analyzed by using the software DTIStudio (Version 2.40, Johns Hopkins University, Baltimore, Md)21and Matlab 7.0 (MathWorks, Natick, Mass).
Con-sidering the size of the region of interest, we used no distortion or motion correction in this study. The following indices were calculated from the tensor: 1)储, 2)⬜, 3) MD, and 4) FA, which are defined in the following equations:
1) 储⫽1
2) ⬜⫽(2⫹3)/2
3) MD⫽共1⫹2⫹3兲/3
wherei⫽1,2,3are the 3 eigenvalues of the diffusion tensor.
Region-of-Interest Analysis
Two regions of interest along the subcortical auditory pathway were drawn bilaterally for evaluation: the lateral lemniscus (LL) and infe-rior colliculus (IC), which are above the trapezoid body where the auditory nerve fibers from the cochlear nucleus cross over. MR imag-ing can only provide the expected course of the central auditory path-way; it cannot pinpoint the exact localization of the auditory fibers at various anatomic sites along the auditory pathway. Nevertheless, the
[image:2.594.57.533.43.169.2]Fig 1.Representative 3D MR images of cochlear nerve (N) aplasia (A), hypoplasia (B), and the normal cochlear nerve (C). Arrows indicate the cochlear nerve and facial nerve in the internal auditory canal.B, The caliber of the cochlear nerve is smaller than that of the facial nerve, which is the diagnostic criterion for cochlear nerve hypoplasia.
Table 1: Basic clinical data of all subjects with unilateral cochlear nerve deficiency (aplasia and hypoplasia)
Case Age (yr) Sex
Cochlear Nerve Deficiency
Hearing Threshold (PTA) dB HL
Right Left Right Left
1 12 M Aplasia Normal 100 10
2 10 F Aplasia Normal ⬎100 20
3 8 F Aplasia Normal ⬎100 10
4 9 F Aplasia Normal ⬎110 15
5 14 F Hypoplasia Normal 100 5
6 8 M Hypoplasia Normal ⬎110 10
7 12 M Normal Aplasia 5 ⬎110
8 25 F Aplasia Normal 100 10
9 9 M Normal Aplasia 10 ⬎110
10 11 M Normal Aplasia 10 ⬎110
11 29 M Normal Aplasia 15 ⬎110
12 9 F Hypoplasia Normal 90 10
[image:2.594.60.534.215.381.2]color-encoded FA map can display the orientations of the nerve fibers with different colors. Because the auditory nerve fibers in the LL and IC are predominantly vertically oriented, they are highlighted as blue structures in the corresponding areas of the color-encoded FA maps, facilitating correct selection of regions of interest. Region-of-interest selection was guided by the color-encoded FA map. Uniform rectan-gular regions of interest, each containing 4 pixels of 3⫻3⫻2 mm (area, 9 mm2), were drawn for all subjects. The receiver operating
characteristic analysis of such size was found to be best fit within the blue areas on the color-encoded FA map at the LL and IC, corre-sponding to the vertically oriented auditory fibers, so that the con-tamination from other fibers could be minimized. The vertical direc-tion along the auditory fibers in the LL and IC was considered axial, whereas other the 2 orthogonal directions perpendicular to fiber bun-dles were considered radial. The reason for selecting theses 2 regions of interest is that the LL and IC are the most conspicuous anatomic landmarks of the subcortical auditory tract and can be reliably iden-tified in both patients and healthy participants.
We placed the region of interest for the LL at the level of internal acoustic canal. For region-of-interest placement of the IC, we chose the level above the superior cerebellar peduncle near the inferior mar-gin of the IC where the fiber tracts are most vertically oriented, facil-itating standardized region-of-interest selection on the
color-en-coded FA map. The mean and standard errors of all indices were computed from each region of interest for all subjects. Because most auditory nerve fibers cross the midline to the contralateral side above the level of the trapezoid body, the indices from the contralateral and ipsilateral sides were compared with those from the healthy group by using the Studentttest.
Results
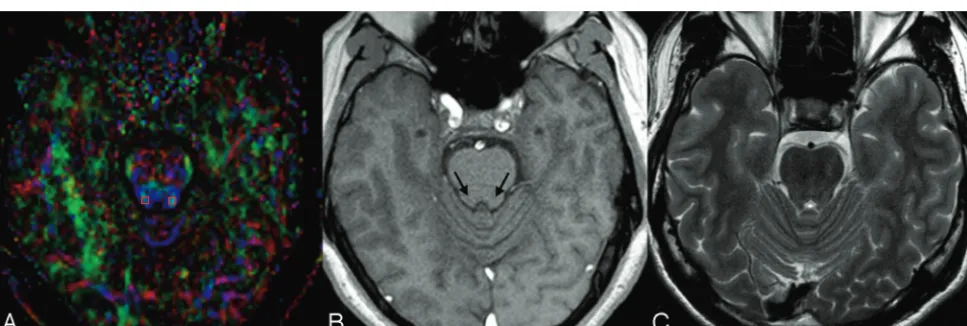
A sample DTI for 1 participant in the group with bilateral CND is shown in Figs 2 (LL) and 3 (IC). The areas of regions of interest and the nerve bundles connecting them are high-lighted in particular. These 2 figures also contain the corre-sponding T1- and T2-weighted MR images at the same sec-tional level to facilitate the identification of anatomic landmarks. The 4 diffusion indices at the LL and IC for the contralateral and ipsilateral sides of subjects with CND and the control group are summarized in Tables 2 and 3.
In the control group, a pairedttest was performed first to compare the 4 indices of the left and right sides. The result showed that there is no significant side difference. Therefore, we used the averaged value of the 2 sides to compare with the ipsilateral and contralateral side of the CND group. Table 2 shows that the FA is significantly reduced at both the LL and
Fig 2.A, A sample DTI at the level of the LL and the selected region of interest (3⫻3⫻2 mm rectangular box). Note that in the DTIs, the most basic red-green-blue color-coded scheme attributes a color to each orientation of the fibers: Fibers crossing from left to the right are shown in red, fibers crossing anteroposteriorly are visualized in green, and fibers crossing inferosuperiorly are visualized in blue.30B, In the corresponding T1-weighted MR image at the same sectional level, long arrows pinpoint the anatomic sites of lateral lemniscus.C, The
corresponding T2-weighted image at the same section level.
[image:3.594.56.534.42.204.2] [image:3.594.55.539.258.421.2]IC, whereas the MD is significantly increased for the contralat-eral side of the CND group. The⬜increased significantly for the contralateral side, whereas the储 remained unchanged. Table 3 shows the comparison of the ipsilateral side of the CND group with that in the control group. Similar results were obtained for the contralateral side: significantly reduced FA and increased MD at both the LL and IC with the⬜ in-creased significantly for the ipsilateral side while the储 re-mained unchanged.
Discussion
DTI measures the displacement of water molecules on the mi-croscale and provides information about white matter fibers that pass within a pixel. Changes in MR imaging signals may be attributed to a number of physiologic factors including edema, demyelination, gliosis, and inflammation. By examin-ing the different diffusivities and combinexamin-ing different diffu-sion indices, we can identify the pathologic process.10The un-derlying mechanism for the changes in FA and MD related to various pathologies is still under debate. A comprehensive un-derstanding of the changes in the microenvironment of the tissue can only be accomplished with a thorough investigation of each diffusion ingredient.21,22In the series of 37 individuals
with sensorineural hearing loss who had no morphologic ab-normality of the inner ear or auditory pathway, Lin et al19
found that DTI showed a high⬜, which consequently led to a decreased FA in the LL and the IC, suggesting myelin sheath degeneration in the brain stem. The present study examined the underlying integrity of the neurons of ipsilateral and con-tralateral subcortical pathways in subjects with unilateral CND. The results, similar to those of Lin et al, suggested that the orientation of neural fibers along the subcortical auditory pathway in subjects with unilateral CND may be preserved. The reduction in FA and the increase in⬜on both the ipsi-lateral and contraipsi-lateral sides might be attributed to axonal loss and/or demyelination of the subcortical auditory tract in these subjects.
From the developmental perspective, Gurung and Fritzsch23studied the time line of the development of projec-tions between subcortical auditory nuclei (cochlear nucleus, LL, IC, and medial geniculate body) in mice by using carbo-cyanine dye tracing. The results suggested that these projec-tions are tonographically specific from the beginning and that only fine tuning might occur in neonates before or after the onset of hearing, implying that the development of auditory pathway connections is independent of any acoustic stimula-tion.24The grossly normal formation of these connections is apparently specified by genes at the onset. However, there is also evidence demonstrating that the central pathway under-goes developmental changes that occur, at least partially, in parallel with the peripheral development. Moreover, sound deprivation in the perinatal period may have negative effects on the normal development of the central auditory sys-tem.25,26Our results seem to support the latter theory, that in
subjects with CND, the subcortical auditory pathway central to the cochlear nerve is not normal in terms of neuronal dif-fusivity. This abnormal diffusivity may be a consequence of developmental change or late auditory deprivation due to co-chlear nerve deficiency.
In a previous article, our group demonstrated increased⬜ and decreased FA of the contralateral side of the subcortical tract in subjects of long-term deafness caused by cochlear le-sions.20Compared with subjects with that result, patients with CND have decreased FA and increased⬜on both ipsilateral and contralateral sides of subcortical tract. The finding of ab-normal diffusivity bilaterally is interesting. It is clear that IC and LL are the sites of convergence of input from the multiple lower auditory nuclei, including the superior olivary complex and the cochlear nucleus. Some previous studies have shown that unilateral damage of peripheral hearing organs can result in disruption of projections and decreased neuronal activities of the bilateral LL and IC.27-29Why the ipsilateral side of the
[image:4.594.53.533.62.137.2]CND with abnormal diffusivity of the auditory tract still has normal hearing is not clear. One possible explanation is that
Table 2: Summary of the diffusion indices at the LL and IC for the unilateral CND group*
LL IC
Contralateral Mean (SEM)
Control Mean (SEM)
P Value
Contralateral Mean (SEM)
Control Mean (SEM)
P Value
储 1.12 (0.22) 1.22 (0.19) .2817 1.50 (0.37) 1.37 (0.11) .2558 l⬜ 0.58 (0.16) 0.34 (0.05) .0003† 0.45 (0.13) 0.26 (0.06) .0004† MD 0.76 (0.18) 0.62 (0.06) .0263† 0.80 (0.20) 0.64 (0.09) .0231† FA 0.43 (0.07) 0.67 (0.08) .0001† 0.68 (0.06) 0.79 (0.04) .0001†
Note:—LL indicates lateral lemniscus; IC, inferior colliculus; CND, cochlear nerve deficiency; SEM, standard error of the mean;储, axial diffusivity; l⬜,radial diffusivity; MD, mean
diffusivity; FA, fractional anisotropy.
* The contralateral side of the patients was compared with that in the control group. † Statistically significant.
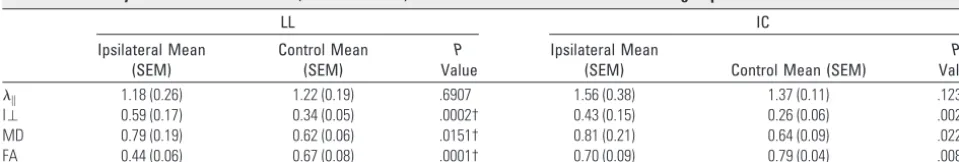
Table 3: Summary of the diffusion indices (mean and SEM) at the LL and IC for the unilateral CND group*
LL IC
Ipsilateral Mean (SEM)
Control Mean (SEM)
P Value
Ipsilateral Mean
(SEM) Control Mean (SEM)
P Value
储 1.18 (0.26) 1.22 (0.19) .6907 1.56 (0.38) 1.37 (0.11) .1236 l⬜ 0.59 (0.17) 0.34 (0.05) .0002† 0.43 (0.15) 0.26 (0.06) .0026† MD 0.79 (0.19) 0.62 (0.06) .0151† 0.81 (0.21) 0.64 (0.09) .0228† FA 0.44 (0.06) 0.67 (0.08) .0001† 0.70 (0.09) 0.79 (0.04) .0081†
[image:4.594.53.533.192.273.2]the 20%–30% of the nerve bundles that come from the same (ipsilateral) side have damage severe enough to cause a signif-icant change in these diffusivity indices, whereas the remain-ing normal 70%– 80% fibers from the contralateral healthy side can function normally and hence maintain normal hearing.
There are some limitations of the present study. First, only 1 rater was responsible for the region-of-interest designation. Use of at least 2 raters would be helpful for the reliability of region-of-interest assessments. Another limitation of this study is that only 2 regions of interest were selected for evalu-ation. The compromise in image resolution and signal-inten-sity–to-noise ratio, compared with the tiny complex struc-tures along the auditory pathway, led to potential partial volume effects and difficulty in delineating the regions of in-terest from other important brain stem nuclei, such as the cochlear nucleus and medial geniculate body. The third limi-tation was the small number of cases, for 2 reasons: First, this kind of case is uncommon. Second, to obtain reliable data, we considered only subjects older than 8 years of age suitable for the DTI procedures. Finally, actual tractography between the LL and IC was not attempted in the current study. It will be attempted and the results should provide more information on this issue in the future.
Conclusions
Our DTI study demonstrated that the longitudinal diffusion and the orientation coherence were maintained but the neu-ronal integrity was affected along the contralateral and ipsilat-eral subcortical auditory projections central to the cochlear nerve in subjects with unilateral CND. The reduction in FA and increase in⬜on the both the ipsilateral and contralateral sides might be attributed to axonal loss and/or demyelination as a consequence of maldevelopment or late-onset auditory deprivation in these subjects.
References
1. Adunka OF, Roush PA, Teagle HF, et al.Internal auditory canal morphology in children with cochlear nerve deficiency.Otol Neurotol2006;27:793– 801 2. Casselman JW, Offeciers FE, Govaerts PJ, et al.Aplasia and hypoplasia of the
vestibulocochlear nerve: diagnosis with MR imaging. Radiology 1997;202:773– 81
3. Jackler RK, Luxford WM, House WF.Sound detection with the cochlear im-plant in five ears of four children with congenital malformations of the co-chlea.Laryngoscope1987;97:15–17
4. Shelton C, Luxford WM, Tonokawa LL, et al.The narrow internal auditory canal in children: a contraindication to cochlear implants.Otolaryngol Head Neck Surg1989;100:227–31
5. Govaerts PJ, Casselman J, Daemers K, et al.Cochlear implants in aplasia and hypoplasia of the cochleovestibular nerve.Otol Neurotol2003;24:887–91
6. Nelson EG, Hinojosa R.Aplasia of the cochlear nerve: a temporal bone study.
Otol Neurotol2001;22:790 –95
7. Buchman CA, Poush PA, Teagle HFB, et al.Auditory neuropathy characteris-tics in children with cochlear nerve deficiency.Ear Hear2006;27:399 – 408 8. Malgrange B, Belachew S, Thiry M, et al.Proliferation generation of
mamma-lian auditory hair cells in culture.Mech Dev2002;112:79 – 88
9. Rubel EW, Fritzsch B.Auditory system development: primary auditory neu-rons and its targets.Annu Rev Neurosci2002;25:51–101
10. Assaf Y, Pasternak O.Diffusion tensor imaging (DTI)-based white matter mapping in brain research: a review.J Mol Neurosci2008;34:51– 61 11. Basser PJ, Mattiello J, LeBihen D.MR diffusion tensor spectroscopy and
imag-ing.Biophys J1994;66:259 – 67
12. Basser PJ.Inferring microstructural features and the physiological state of tissue from diffusion-weighted images.NMR Biomed1995;8:333– 44 13. Mukherjee P, Miller JH, Shimony JS, et al.Diffusion-tensor MR imaging of
gray and white matter development during normal human brain maturation.
AJNR Am J Neuroradiol2002;23:1445–56
14. Arfanakis K, Haughton VM, Carew JD, et al.Diffusion tensor MR imaging in diffuse axonal injury.AJNR Am J Neuroradiol2002;23:794 – 802
15. Pfefferbaum A, Sullivan EV, Hedehus M, et al.Age-related decline in brain white matter anisotropy measured with spatially corrected echo-planar dif-fusion tensor imaging.Magn Reson Med2000;44:259 – 68
16. Basser PJ, Pierpaoli C.Microstructural and physiological features of tissue elucidated by quantitative-diffusion-tensor MRI. J Mag Reson B 1996;111:209 –19
17. Basser PJ, Pierpaoli CA.A simplified method to measure the diffusion tensor from seven MR images.Magn Reson Med1998;39:928 –31
18. Chang Y, Lee SH, Lee YJ, et al.Auditory neural pathway evaluation on senso-rineural hearing loss using diffusion tensor imaging. Neuroreport 2004;15:1699 –703
19. Lin YC, Wang JJ, Wu CM, et al.Diffusion tensor imaging of the auditory pathway in sensorineural hearing loss: change in radial diffusivity and diffu-sion anisotropy.J Magn Res Imaging2008;28:598 – 603
20. Wu CM, Ng SH, Liu TC.Diffusion tensor imaging of subcortical auditory tract in subjects with long-term unilateral sensorineural hearing loss.Audiol Neurotol2009;14:248 –53
21. Toh CH, Wong AM, Wei KC, et al.Peritumoral edema of meningiomas and metastatic brain tumors: differences in diffusion characteristics evaluated with diffusion-tensor MR imaging.Neuroradiology2007;49:489 –94 22. D’Arceuil H, de Crespigny A.The effects of brain tissue decomposition on
diffusion tensor imaging and tractography.Neuroimage2007;36:64 – 68 23. Gurung B, Fritzsch B.Time course of embryonic midbrain and thalamic
audi-tory connection development in mice as revealed by carbocyanine dye tracing.
J Comp Neurol2004;479:309 –27
24. Cant NB.Structural development of the mammalian central auditory path-way.In: Rubel EW, Popper AN, Fay, RR, eds.Development of the Auditory Sys-tem.New York: Springer-Verlag; 1998
25. Moore JK, Linthicum FH.The human auditory system: a timeline of develop-ment.Int J Audiol2007;46:460 –78
26. Moore DR.Postnatal development of the mammalian central auditory system and the neural consequences of auditory deprivation.Acta Otolaryngol Suppl 1985;421:19 –30
27. Gabriele ML, Brunso-Bechtold JK, Henkle CK.Plasticity in the development of afferent patterns in the inferior colliculus of the rat after unilateral cochlear ablation.J Neurosci2000;20:6939 – 49
28. Franklin SR, Brunso-Bechtold JK, Henkel CK.Unilateral cochlear ablation be-fore hearing onset disrupts the maintenance of dorsal nucleus of the lateral lemniscus projection patterns in the rat inferior colliculus.Neuroscience 2006;143:105–15
29. Dong S, Mulders WH, Rodger J, et al.Changes in neuronal activity and gene expression in guinea-pig auditory brainstem after unilateral partial hearing loss.Neuroscience2009;159:1164 –74. Epub 2009 Feb 12