Does Structure Influence Performance in Downstream
Supply Chain?
Horaţiu CIRTITA Università Degli Studi di Padova, Italy Babeş-Bolyai University, Cluj-Napoca, Romania E-mail: [email protected]; [email protected] Tel.: +39 (348)237.9415 Liviu ILIEŞ Babeş-Bolyai University, Cluj-Napoca, Romania E-mail: [email protected] Tel.: +40 (0264) 418652
Keywords: downstream supply chain network, multiple attribute utility model, SCOR, performance metrics, best practices
1 Introduction
Human behavior plays an important role in bullwhip effect, defined as an increase of fluctuations in demand as it moves up the supply chain from retailers to wholesalers to manufacturers to suppliers. Research of Forrester (1958) and Sterman (1989) showed that members’ perceptions about inventory and demand information, and mistrust in downstream supply chain generate this negative phenomenon.
The bullwhip effect distorts demand information and the supply chain Abstract
In 1989, John Sterman has explained in the famous beer game the bullwhip effect in downstream supply chain and how structure influences behavior of supply chain members. In this article, we try to find answers to the following questions: Does structure influence performance in downstream supply chain? Can be identified a network configuration that performs better than other configurations?
In finding answers to the research questions, we considered the axiom ‘what it is not measured, it cannot be managed’. In the study, we took SCOR metrics at first level as performance metrics and best practices to express each SCOR dimension. 30 top executives from World Class Manufacturers were surveyed to rate the importance of the metrics and best practices in measuring performance in downstream supply chain. The second step was to develop a multiple attribute utility model (MAUT) to select from the seven configurations identified the one that has the highest performance.
the lack of coordination creates increase in variability of performance metrics in the downstream supply chain. Since bullwhip effect is a cause of human behavior within a given downstream supply chain, we put the questions: Does structure influence performance in supply chain? Could be avoided this effect reengineering the downstream structure? What type of downstream supply chain networks are and how can be selected the best network to achieve best performance?
Downstream supply chain refers to the movement and storage activities required to transport a product from the supplier to a customer in the supply chain (Chopra, 2003). It represents the ‘face of the company’ to customers with a strong bearing on customer satisfaction. Customers expect quality service defined as reliable product deliveries of the right amount, at the right time with no damage to product and at a low cost. The company, however, must balance customer satisfaction with the need for profitability. The balance of customer satisfaction is determined by the proper mix of downstream supply chain process strategies.
The process strategies can be figured in many ways using a complex distribution network of internal and external providers or they can be configured as a direct model, such as used by Dell. It has succeeded to eliminate important downstream echelons as distributors and retailers, improving the visibility by creating a direct link with the end-customers. Recently, Dell has announced that they will renounce to use exclusively their famous direct sales approach and they will start to use retailers for some PC models.
The dilemma faced by companies concerns the choice of the best downstream supply chain that balances customer satisfaction and profitability. To solve this dilemma, companies need to have strategic supply chain planning tools to asses the performance along the supply chain.
One example is provided by SCOR model developed by Supply Chain Council in 1996, to integrate business management and improvement practices, including a multi-tiered metric system to improve the plan, source, make, and deliver activities in supply chain.
Our study uses SCOR metrics and best practices in selecting the best alternative in downstream supply chain. It can serve as a tool for supply chain managers to plan supply chain networks based on a set of metrics and best practices to obtain a superior performance, continuous improvement and avoid negative phenomena as bullwhip effect. We propose a tool to define the best network alternative in downstream supply chain, based on Multiple Attribute Utility Theory (MAUT), creating a value function with scalable importance criteria coefficients.
2
Criteria and sub-criteria based on performance metrics and best practices in downstream supply chainIn order to identify the most significant performance metrics and best practices that express the SCOR dimensions, we surveyed 30 top executives from world class companies in different industrial sectors such as machinery manufacturing; computer and electronic product manufacturing; electrical equipment, appliance, and component manufacturing; and transportation equipment manufacturing. The executives had key responsibilities in supply chain management. The individuals had positions from senior manager to president. A personalized email invitation and web survey instrument were used as questionnaire carrying ways. Questionnaire has comprised three sections: Company Profile, Network Design, and Performance Metrics.
2.1 Network Design
The purpose of this section is to see how companies deliver the products on their downstream supply chains. We consider the manufacturer, the intermediary distribution (distributors and retailers) and third party logistics as downstream supply chain echelons.
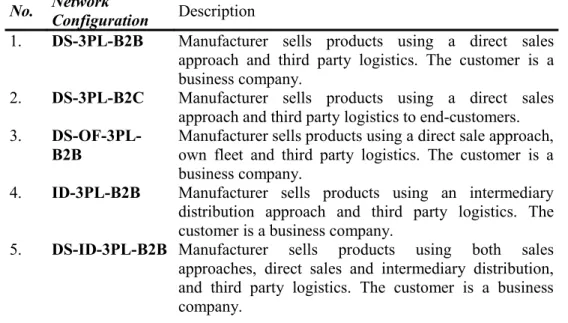
Based on these echelons, we have found seven network configurations, presented in table 2.
Network Configurations in Downstream Supply Chain
Table 2 No. Network
Configuration Description
1. DS-3PL-B2B Manufacturer sells products using a direct sales approach and third party logistics. The customer is a business company.
2. DS-3PL-B2C Manufacturer sells products using a direct sales approach and third party logistics to end-customers.
3.
DS-OF-3PL-B2B
Manufacturer sells products using a direct sale approach, own fleet and third party logistics. The customer is a business company.
4. ID-3PL-B2B Manufacturer sells products using an intermediary distribution approach and third party logistics. The customer is a business company.
5. DS-ID-3PL-B2B Manufacturer sells products using both sales approaches, direct sales and intermediary distribution, and third party logistics. The customer is a business company.
No. Network
Configuration Description
6. DS-ID-3PL-B2C Manufacturer sells products using both sales approaches, direct sales and intermediary distribution, own fleet, and third party logistics to end-customers. 7.
DS-ID-OF-3PL-B2C
Manufacturer sells products using both sales approaches, direct sales and intermediary distribution, own fleet and third party logistics to end-customers. Note. DS – Direct sales approach, ID-intermediary distribution, 3PL-third party logistics,
OF-own fleet, B2B-business-to-business, B2C-business-to-consumer.
2.2 The model
In this section, we present a model of Multiple Attribute Utility Theory (MAUT) in the sense of (Keeney and Raiffa, 1976) that defined a preference representation function as a value function.
In our model, we consider the value function to represent the best downstream supply chain network design under certainty, using a set of attributes as decision criteria.
The model assumptions are:
, m ,a , 1 s, a lternative nsider m a ves, we co alternati A - set of … ria, er n crite we consid criteria, C - set of ), ( j h v ciated wit tant) asso aling cons weight (sc -criteria j w ⋅ id process decision a the stage of at a given a weights he criteri lues for t ions of va e combinat acceptabl W - set of 1 w 0 and w aints the constr t satisfy of the se e elements W. All th ctor w ed as a ve represent ination is (each comb n 1 j j j≥ ∑ = ∈ =
We express the value function as:
(Dias and Climaco, 2000) showed that when the number of alternatives is relative small (in our case, seven alternatives) a good approach in selecting the best alternative from the set is pairwise comparisons and proposed three types of computations: (1) computation of a range of values for each network design alternative; (2) computation of the highest difference for each pair of alternatives, and (3) computation of the maximum regret associated with each alternative.
. set the of element an is ) ,..., ( where ), ( ) , ( 1 1
∑
= = = n j n i j j i w w v a w w w W a VIn order to make these computations, we generate the following steps: 1) The data obtained from the survey are normalized an m x n pairwise confrontation table is analyzed, that is represented as M = (mij).
2) The results produced by VIP (the free software created by Dias and delivered us by personal communication with the author) from a set W of acceptable combinations of values for the importance parameters and a set A of alternatives include the following:
•
Computation of range of value for each alternative ai: the minimum value of ai given W can be computed by solving a linear program (LP) with the scaling weights W=(w1,w2,…,wn) as variables; or the maximum value of ai given W can be computed by solving another LP.•
Computation of the highest difference of value for each ordered pair of alternatives: given an ordered pair of alternatives (ai,aj)∈
A2 and W, an LP may be solved to find the maximum possible advantage of the first alternative over the second one. If the maximum difference is negative or nullthen
If the maximum difference does not exceed a tolerance parameter ε, then
•
Computation of the “maximum regret” associated with choosing each alternative: give an alternative ai∈
A, the set A\{ai}, and W, this amounts to find the maximum difference of value by which ai can lose to another alternative in A\{ai}. The scaling weights w= (w1,w2,…,wn) are considered as variables (rather than being fixed) to allow the regret to be as high as possible given A and w.If then we can say that the alternative ai is optimal. If then we can say that the alternative ai is
“quasi-optimal”, with tolerance ε.
In our model, we consider as decision criteria: perfect order defined as perfect deliveries per total deliveries (in percents), delivery performance defined as orders delivered on-time per total orders (in percents), order fillrate defined as orders filled complete per total orders ( in percents), total supply chain cost, supply chain leadtime as the time from order receipt to order deliver to the customer and, order accuracy as error-free orders per total orders (in percents). The scaling weights for criteria were determined based on the ratings made by the respondents on each performance metrics. As result, perfect order>delivery performance>order fillrate>total supply chain cost>leadtime>order accuracy. The sum of the scaling weights is equal with one.
}
{
V a w V a w w W mij = max ( i, )− ( j, ): ∈ W w w a V w a V( i, )≥ ( j, )∀ ∈W
w
w
a
V
w
a
V
(
i,
)
≥
(
j,
)
−
ε
,
∀
∈
}} max{ { max ) ( Regret ,.., 1max a V(aj,w) V(ai,w):w W m j W w i = − ∈ = ∈ 0 ) (a Regretmax i = ε ≤ ) (a Regretmax i
3
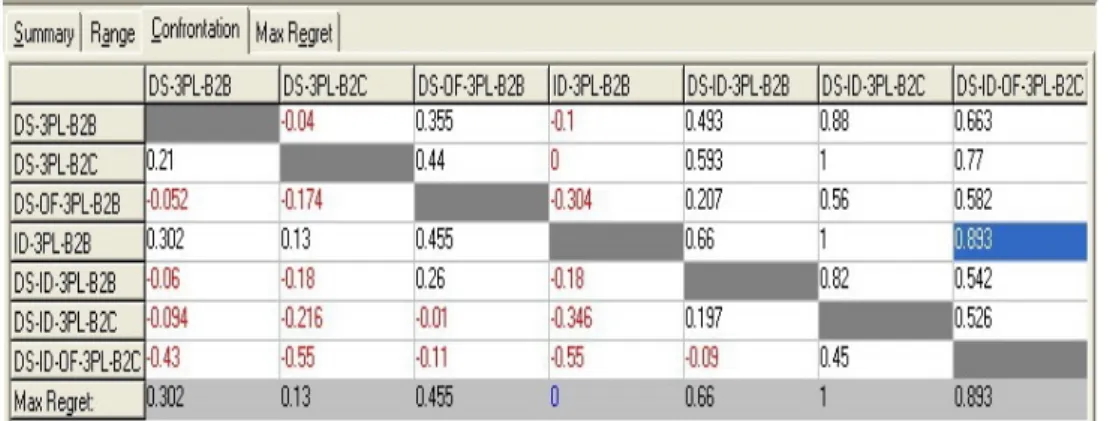
The resultsAfter performance the computations of the maximum regret (defined as the maximum disadvantage of an alternative when compared with another), we obtain that the network configuration ‘ID-3PL-B2B’ is the best structure (0-the lowest disadvantage), being absolute dominant respecting other five network configuration and dominant respecting one
On the confrontation table, we obtain the same result, the network configuration ‘ID-3PL-B2B’ is the best structure (the minimum value of the corresponding function has higher values than the maximum value of any other network configuration – from 0,13 corresponding to the maximum value function for ‘DS-3PL-B2C’ up to 1,00 corresponding to the maximum value function for ‘DS-ID-3PL-B2C).
Figure 1 Confrontation of values
4
ConclusionsIn this paper, we present a multiple attribute utility theory model that can be used for the decision makers in supply chain to select the best downstream supply chain network configuration. The problem of selecting the best choice from a set of network designs can be approached using multiple criteria decision aid tools when the data collection process is available and reliable. The main advantages of this method are the avoidance of the issue of rank preservation and rank reversal when an alternative is added/deleted, and the selection of the best alternative is based on a combination between data and judgments (the respondents from the first wave of the survey were asked to rank the importance of the performance metrics on a seven points Likert scale). The main potential deficiencies of the method could be in the situation when the decision makers could not have access to data (to expensive or impossible to collect the data regarding the specific issue) and it uses just tangible criteria (quantitative criteria). When it does appear at least one of the two situations, an alternative approach of Analytic Hierarchy Process (AHP) could be explored.
References
1.
Chopra, S. & Meindl, P. (2004). Supply Chain Management: Strategy,Planning and Execution 2nd Ed. New Jersey: Pearson
2.
Dias, L. C., & Climaco, J. N. (2000). „Additive aggregation with variable interdependent parameters: the VIP analysis software”. Journal of the Operational Research Society, 51(9)3.
Forrester, J. W. (1958). Industrial Dynamics: „A Major Breakthrough for Decision Makers”. Harvard Business Review, 36(4)4.
Johnson, M. E., & Pyke, D. F. (2000). „A Framework for Teaching Supply Chain Management”. Production and Operations Management 9(1)5.
Keeney, R. L., & Raiffa, H. (1976). Decisions with Multiple Objectives:Preferences and Tradeoffs: Wiley
6.
Neely, A. (1999). „The performance measurement revolution: why now and what next?” International Journal of Operations and ProductionManagement, 19