Framework for a UPC and SHMEM
Performance Analysis Tool
Hung-Hsun Su
Adam Leko
Hans Sherburne
[email protected] [email protected] [email protected]
Bryan Golden Alan D. George
[email protected] [email protected]
High-performance Computing and Simulation (HCS) Research LabDept. of Electrical and Computer Engineering University of Florida, Gainesville, Florida 32611-6200
ABSTRACT
Given the complexity of parallel programs, users often must rely on performance analysis tools to help them improve the performance of their code. While many tools support the analysis of message-passing programs, no tool exists that fully supports programs written in languages that present a global address space to the programmer, such as UPC and SHMEM. Due to the differences between message-passing and global-memory languages, existing tools cannot be easily extended to support UPC and SHMEM. Furthermore, the inclusion of implicit and one-sided communication renders many of the analyses irrelevant. Because of these reasons, there exists a need for a new performance tool specifically designed for UPC and SHMEM. In this paper, we present a framework for the development of a modularized event-based performance analysis tool for UPC and SHMEM. This framework was developed based on findings from three different studies we conducted: a tool evaluation, a language analysis, and a usability study. For each unit in our modularized design framework, we discuss the functionalities and development options. Next, the reusabil-ity of candidate components from existing tools is evaluated with respect to each specific unit. Finally, the interaction between related units is described. We are currently devel-oping a working prototype based on this framework.
Keywords
UPC, SHMEM, Performance Analysis Tool.
1. INTRODUCTION
To meet the growing demand for greater computing power, new shared-memory machines and clusters are constantly being built. In order to take advantage of these powerful systems, many parallel languages have been developed based on different programming models, such as the mes-sage-passing and global address space models. Due to the complexity of these parallel programs, users often must rely on performance analysis tools (PAT) to help them improve the performance of their code. Among the available pro-gramming models, the Message Passing Interface (MPI), a message-passing programming model, has received the lion’s share of PAT research and development, as it remains the most well-known and used parallel programming model. Almost all existing parallel PATs support MPI program analysis.
Recently, languages presenting the programmer with a global address space (GAS) are quickly gaining popularity. Unified Parallel C (UPC) [1-2] and Shared Memory Pro-gramming (SHMEM) [3] are among the most promising GAS languages. By extending the memory hierarchy to include an additional global memory layer, these languages provide environments that are similar to that of threaded sequential programming. Instead of the explicit data ex-change required by message-passing models, GAS languages allow implicit data exchange through reading and writing of global variables. The implicit communication greatly re-duces the complexity of data management from a program-mer’s perspective. Furthermore, GAS languages enable the development of new algorithms for large systems that are otherwise too complex to program under a message-passing environment [4]. However, the GAS abstraction forces the programmer to give up some control over the communication between nodes, which can lead to a reduction in performance. Therefore, PAT support for GAS languages becomes even more critical to the programmer. Unfortunately, no tool exists that fully supports the analysis of programs written in UPC or SHMEM.
In this study, we present the framework of a new PAT spe-cifically designed for UPC and SHMEM. Several studies,
including an evaluation of existing tools, an examination of the UPC and SHMEM languages, and an investigation of tool usability were performed and the findings were used in the development of this framework.
The next section of this paper provides an overview for UPC, SHMEM, and existing performance tools. In Section 3, a brief overview of our approach is given. Section 4 describes the high-level design of the proposed UPC/SHMEM PAT. Finally, Section 5 presents conclusions and directions for future research.
2. BACKGROUND
In the following subsections we present an overview of the global-memory parallel languages UPC and SHMEM. In addition, we also include a brief introduction to performance tools.
2.1 UPC
Unified Parallel C (UPC) began to take shape in the late 1990s, and Version 1.0 of the language specification became available in February 2001. Since then, UPC has caught the attention of many organizations in educational institutes, government, and industry. The key to its success is the ability to create powerful shared-memory parallel programs with a C-like syntax. Its ability to use a shared-memory model on a variety of architectures is making it very impor-tant in a number of high-performance applications. Version 1.2 of the UPC specification became available in June 2005. UPC is available on a growing number of HPC systems. Examples of newer platforms with UPC support include the HP 9000 and AlphaServer, Cray X1, and SGI Altix. In addition, any systems supporting MPI (such as the IBM SP) or connected by a cluster interconnect (e.g., SCI, Quadrics, InfiniBand, and Myrinet) can be used with the Berkeley UPC runtime system [5], albeit with varying degrees of perform-ance.
2.2 SHMEM
Cray Research originally created the SHMEM library for use on the T3D supercomputer. The SHMEM library provides a shared-memory abstraction for to programmers writing code for parallel computers. It allows a processing node to read and write data stored in the physical memory on another processing node. In addition to the basic set of primitives for accessing remote memory (e.g., get and put), the SHMEM library provides collective parallel operations. Although primarily available on Cray and SGI systems, SHMEM is also available for numerous other HPC machines, including machines equipped with either QsNet from Quad-rics or Scalable Coherent Interface from Dolphin.
Portable support for SHMEM middleware exists in the form of GPSHMEM, an effort from Ames Laboratory to increase the portability of SHMEM. GPSHMEM implements the SHMEM library by coupling MPI libraries with the Aggregate Remote Memory Copy Interface (ARMCI) library, a portable remote memory copy library.
2.3 Performance Analysis Tools
There are numerous performance tools using experiment measurement available for sequential and parallel languages [7]. In the experimental measurement approach, programs are executed and performance data are gathered through sampling or event recording. In sampling-based tools, a separate thread periodically records hardware counter data and the performance of the program is estimated using these data after program termination. These tools typically in-troduce very low overhead but have trouble reproducing accurate program behavior. In event-based tools, the user program is instrumented at pre-determined points in the code so event data can be recorded. Event-based tools can be trace-based, where an individual event is recorded (e.g., start/end time of 5th execution of func_1), or profile-based, in which statistical information is kept instead (e.g., minimum time of func_1). Tracing provides tools with sufficient data to reconstruct a program’s behavior, but often requires a huge amount of storage space. Profiling, on the other hand, re-quires only a few registers and memory locations to keep track of data, but cannot be used to reconstruct or analyze all of a program’s behavior. Almost all parallel performance tools are event-based and provide tracing, profiling, or both. Profiling tools supporting sequential C and MPI are the most common, with some profiling tools also supporting shared-memory programming models such as OpenMP and SHMEM. Many performance tools use the Performance Application Programming Interface (PAPI) [8], which pro-vides platform-independent access to hardware counters on a variety of platforms. These hardware counters can be used to track a wide range of low-level performance statistics, such as the number of instructions issued, L1 cache misses, and data TLB misses. In addition, some tools such as KO-JAK [9] and Paradyn [10] also attempt to precisely identify performance bottlenecks and qualify them according to their impact on performance. Few tools support SHMEM or UPC, and tools with support for these models are typically not portable and can only perform simple analyses.
3. APPROACH
In order to develop a framework tailored to UPC and SHMEM that enables user productivity, we conducted sev-eral studies in parallel. We first evaluated sevsev-eral popular parallel PATs, including Dimemas/Paraver [11], DynaProf [12], HPCToolkit [13], Intel Cluster Tools [14], KOJAK, MPE/Jumpshot [15], mpiP [16], MPICL/ParaGraph [17], Paradyn, SvPablo [18], and TAU [19]. Twenty-three char-acteristics in four categories (portability, scalability, usabil-ity/productivity, and miscellaneous) were used to evaluate these tools. In addition, a standard set of test programs, including MPI micro benchmarks, the NAS NPB LU bench-mark, and the CAMEL cryptanalysis program which served as a control program, was used with each tool to see if the tool could provide sufficient information to detect perform-ance bottlenecks. Through this process, we were able to identify characteristics and techniques common to successful PATs and select appropriate components for reuse [20]. While our tool evaluation study focused on identifying ex-isting technologies applicable to UPC and SHMEM, our
language analysis study examined the constructs in both languages and identified applicable events for each construct. We noted the important features of these languages that affect the development of a PAT. The goal of our usability study was to investigate the aspects of a performance tool’s user interface that impact the user’s ability to apply the tool effectively. With the results of this study, we were able to design our tool to be practical, functional, and usable.
4. UPC/SHMEM PAT FRAMEWORK
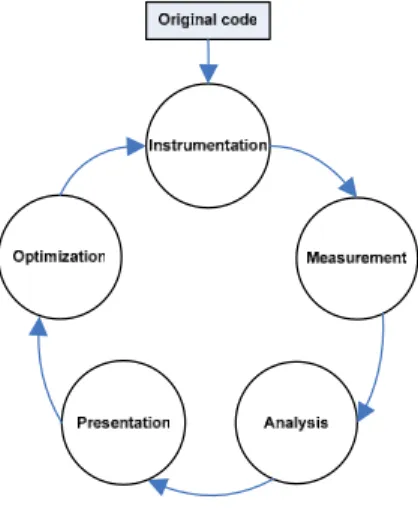
Figure 1 illustrates the typical stages in the experimental measurement approach. In this cycle, user code is first instrumented by the tool. This instrumented version is then executed and event data are gathered. Based on the gath-ered data, the tool performs various performance analyses and the result is presented to the user. Finally, optimiza-tions are made to the original code and the whole cycle re-peats until an acceptable level of performance is reached. This model works well for a performance analysis tool so we adopted it for our UPC/SHMEM PAT.
Figure 1. Experimental Measurement Stages
Several important findings from our studies have played a major role in shaping our design of the framework. We found that it is critical for a successful tool to provide source-code correlation so a user can easily associate per-formance data with actual code. Profiling data allow users to quickly identify possible areas to focus their tuning efforts, while tracing data provide detailed information that are nec-essary to determine the cause of performance degradation. Techniques used by existing PATs are compatible with UPC and SHMEM but are scattered among many tools. The wrapper approach for instrumentation commonly found in MPI tools works well with SHMEM libraries, but would be inadequate for several UPC compiler implementations. Due to UPC’s memory models and aggressive compiler optimiza-tions, correct instrumentation of UPC programs is only achievable with help from UPC compiler developers. Fur-thermore, the inability of most existing tools in tracking and analyzing implicit and one-sided communication remains the biggest roadblock in extending them to support to UPC and SHMEM. A specific model for UPC and SHMEM (similar
to the newly added feature found in KOJAK [21]) is needed to handle implicit and one-sided communication. Finally, the user interface of a tool must be intuitive and easy to learn. In our studies we found that the primary reason why PATs are avoided by users is because that while PATs can be effective at troubleshooting performance problems, they are often too hard to use effectively.
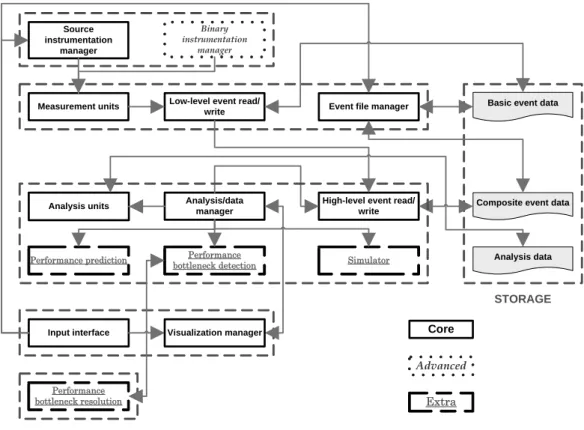
Figure 2 diagrams the framework for our UPC/SHMEM PAT. It consists of five modules corresponding to each stage of the experimental performance analysis cycle, and details for each module are presented in the following subsections. Each unit in a module is classified either as core, advanced, or extra. Core units are vital for the tool to function correctly, while advanced units include functionalities that are highly desirable but not critical to the system. Finally, extra units provide features that may prove to be of some use but require additional investigation.
In describing a specific unit, the unit’s primary functional-ities and preferred implementation approach based on our study findings are first explained. Appropriate development options are then discussed followed by an evaluation of the reusability of candidate components from existing tools. Lastly, we describe the interaction between related units.
4.1 Instrumentation Module
The instrumentation module deals with how and when to instrument user code. Program instrumentation is possible at any level in the source-compile-link-execute cycle [22]. Among these, source-level and binary-level instrumentation are used by modern PATs. Source-level instrumentation is attractive because it is easier to correlate the measured event data back to the original code, thus making it simpler for the user to identify code segments responsible for performance degradation. It is often simpler to implement source-level instrumentation in a portable manner. Unfortunately, this method can interfere with compiler optimization and makes gathering low-level events difficult.
On the other hand, since binary-level instrumentation targets executables or object code generated after compiler optimi-zations, it often provides more detailed and accurate per-formance data. However, each architecture supported would require a system-specific instrumentation unit. In ad-dition, it takes more effort to provide source-code correlation using binary instrumentation rather than source-level instru-mentation.
We favor source-level instrumentation over binary-level instrumentation because of our strong preference for source-code correlation. However, a hybrid source- and binary-level instrumentation approach may work the best as it can provide the most accurate and easy to understand per-formance data. We are currently investigating the best in-strumentation level for each language construct.
To prevent interference with compiler optimization and allow maximum tool portability, we use performance interfaces for UPC and SHMEM. For SHMEM, an interface called PSHMEM was defined and incorporated in several systems
including Cray SHMEM. However, no such interface is currently available for UPC. We have proposed a UPC performance tool interface [23] to the UPC community and are now ready to evaluate the effectiveness of this interface in several implementations, including Berkeley UPC and HP UPC.
4.1.1 Source instrumentation manager unit
This core unit handles the instrumentation of user programs at the source level. By default, all UPC and SHMEM con-structs are instrumented automatically by this unit through the corresponding performance interface. Users can instruct the instrumentation manager to include or exclude certain constructs (e.g., user functions) by modifying the unit’s figuration file. Figure 3 illustrates the contents of a con-figuration file that specifies user_func_1 and all UPC con-structs except upc_memget to be instrumented by the unit. In addition, the user is able to instrument any segment of code by manually inserting pre-defined calls to this unit.Figure 3. Example of Instrumentation Configuration File Development options - If the compiler-supported profiling interface is not available, the unit can modify the original program through a source-to-source translation and then feed
the translated program to the compiler. This approach is less desirable as inserted instrumentation code may interfere with compiler optimizations, thus altering the behavior of the original program. Additionally, some desirable detailed performance information will be unattainable. Since many UPC compilers use source-to-source translations coupled with runtime libraries, an alternative option is to instrument the compiler-translated program. Unfortunately, there is no standard as to how compilers translate the original programs; as a result, multiple units will need to be developed and maintained to handle each compiler.
Reusability evaluation - Besides the push for the UPC per-formance tool interface, we evaluated many candidate com-ponents for UPC and SHMEM instrumentation including compiler frontends (GCC [24], Open64 [25], EDG [26]), PDToolkit [28] (used by KOJAK and TAU), source-to-source compilers (SUIF/SUIF2 [29], Sage++ [30], Cetus [31]), and parsers (CIL [32], Keystone [27]). Most of these compo-nents require a great deal of work to correctly support UPC, making them less attractive than the compiler-supported performance tool interface option. However, we will have to use one of them to instrument user functions, and among these components, CIL and EDG appear most appropriate.
Unit interaction – This unit calls the measurement units for the actual measurement of events. It also interacts with the input interface for easy, user-driven, source-code instrumen-tation. Instrumentation Module Input interface Source instrumentation manager Binary instrumentation manager
Measurement units Low-level event read/ Event file manager
write
High-level event read/ write Analysis/data
manager Analysis units
Simulator
Basic event data
Composite event data
Analysis data
STORAGE
Performance prediction bottleneck detectionPerformance
Performance bottleneck resolution
Figure 2. UPC/SHMEM PAT Framework
Visualization manager Core
Advanced Extra Measurement Module Analysis Module Presentation Module Optimization Module
4.1.2 Binary instrumentation manager unit
This advanced unit performs instrumentation on the program executable. It takes the compiler-generated object code and statically creates the instrumented object code at compile time. The UPC and SHMEM performance tool interfaces can also be used to facilitate the task if instrumentation is performed by the compiler.Development options - Dynamic instrumentation can also be supported. However, due to the complexity that dynamic instrumentation entails, this alternative will require more investigation.
Reusability evaluation - If the performance interface is avail-able, Paradyn’s DynInst can be directly reused with some effort once we determine the correct mapping between pro-filing interface calls and DynInst calls. DPCL [33], another dynamic binary instrumentation tool, does not seem appro-priate due to its limited platform support.
Unit interaction – This unit calls the measurement units for the actual measurement of events.
4.2 Measurement Module
Units in the measurement module are responsible for the actual recording, accessing, and manipulating of basic event data. A basic event is defined as a complete and minimal set of raw events necessary to perform the user’s desired analyses. Units in this module are completely hidden from the user.
4.2.1 Measurement units
These core units determine what events to record and how to measure them, which can depend on the mode of operation (profiling or tracing). The generic hardware measurement unit interacts with existing hardware counter measuring in-terfaces (e.g., PAPI orPCL[34]) to record interesting hard-ware events such as L2 miss rate. Two generic softhard-ware measurement units, one each for UPC and SHMEM, deal with event recording at the software level.
Development options - Ideally, the generic units are sufficient to guarantee the correctness of the system as they define a uniform means for event measurement regardless of the un-derlying software/hardware architecture. However, in some cases, specific measurement strategies may be needed to record some events in a platform-dependent way (e.g. dif-ferent hardware counter measuring interfaces for difdif-ferent systems) or store additional implementation-specific infor-mation (e.g., caching in HP-UPC and MuPC). In such cases, system-specific software or hardware measurement units will need to be developed to supplement the generic units.
Reusability evaluation - PAPI is an ideal candidate for reuse in this unit because it has become the standard hardware counter interface and supports a wide variety of architec-tures.
Unit interaction – This unit calls the low-level event read/write unit to store event data and is used by the instru-mentation units for actual event recording.
4.2.2 Low-level event read/write unit
This core unit is for reading and writing basic event data to storage. By default, tracing data are written to files while profiling data are stored in main memory.
Development options - It is possible to separate this unit into read and write parts and merge each with their respective units. However, having a separate unit for basic event read-ing/writing is more desirable as this decouples the data for-matting from the rest of the process.
Reusability evaluation – We have evaluated trace file formats from several tools but no conclusion has been drawn on the best format to use.
Unit interaction – This unit’s write capability is used by the measurement units to store new basic event data. Its read capability is used by the high-level event read/write unit for efficient access to basic event data.
4.2.3 Event file manager unit
This core unit is primarily responsible for the management of basic event data, including the automatic generation of a single, combined trace file from each node’s individual trace file. In addition, this unit has a trace format converter sub-unit that enables conversion of basic and composite event data (i.e. events generated by combining multiple basic events) from the format used by our tool to a format used by an existing tool. Typically, this feature is included so users familiar with another tool can view the data using the other tool. Since no existing tool fully supports UPC or SHMEM, the development of multiple sub-units, one for each format, is of low priority.
Unit interaction – This unit interacts with the input interface for easy event data management.
4.3 Analysis Module
Units in this module are responsible for various post-execution processing of basic event data recorded by the measurement module. Examples of event processing in-clude simple aggregation of basic data, generation of analy-sis-specific data, and other more advanced analysis ap-proaches. Units in this module are completely hidden from the user.
4.3.1 High-level event read/write unit
This core unit provides access to basic and composite event data. From the basic event data, composite events are gen-erated by the aggregation sub-unit. Once gengen-erated, both the basic and composite event data are searchable through the search/indexing sub-unit that uses indexing for efficient access.
Unit interaction – This unit calls the low-level event read/write unit to access basic event data and is used by the analysis/data manager for access to basic and composite event data.
4.3.2 Analysis units
These core units perform specific analyses and generate the resulting analysis data. Each unit is responsible for a single analysis but can use data from other analysis units. The analysis is either time-oriented or resource-oriented. In time-oriented analyses, all event data are processed with respect to time and the goal is to minimize the overall pro-gram execution time. Resource-oriented analyses, on the other hand, look at the program resource utilization and at-tempt to identify redundant accesses that can be removed to improve overall program performance. Useful analyses include load-balancing analysis (time-oriented), scalability analysis (time-oriented), and memory system analysis (time- and resource-oriented).
Reusability evaluation - As the performance bottleneck de-tection process relies heavily on accurate analyses, KOJAK’s EXPERT and Paradyn’s W3 were closely investigated with respect to UPC and SHMEM. Due to their strong depend-ency to their respective tools, these components cannot easily be reused separately from the rest of the tool. However, because some of the identified bottlenecks except ones for point-to-point communication are applicable to UPC and SHMEM, we recommend reusing the underlying mecha-nisms. In addition, we are currently developing a model for implicit and one-sided communication for the purpose of bottleneck characterization that can be incorporated into this unit. This model is necessary for the tool to perform ap-propriate performance analyses for UPC and SHMEM.
Unit interaction – This unit is used by the analysis/data ager to perform specific analyses. The analysis/data man-ager supplies all the necessary data to the appropriate analy-sis unit.
4.3.3 Analysis/data manager unit
This core unit manages access to all basic, composite, and analysis event data. The performance data manager sub-unit manages the meta-data (file name, mode, etc.) for all trace/profile data generated. Once this meta-data is ob-tained, it invokes the search sub-unit to efficiently access data stored in a single trace file. Finally, based on the view selected by the user, this unit invokes the appropriate analy-sis units to produce analyanaly-sis data.
Unit interaction – This unit calls the high-level event read/write unit to access basic and composite event data. It also invokes the analysis units, simulator, performance pre-diction unit, and performance bottleneck detection unit to perform their corresponding capabilities. In addition, this unit provides the necessary event data to the visualization manager.
4.3.4 Performance prediction unit
This extra unit is for performance prediction and optimal performance estimation. In performance prediction, the unit statically examines the structure of the program prior to program execution and uses predefined models to predict the program performance. In optimal performance estimation, the unit uses the performance data gathered during program execution and restructures the program to produce an
“opti-mal” version of the original program. The performance of this “optimal” version is then estimated and serves as the based-line for the original program. The user is then able to compare the performance of the original program against the “optimal” version to evaluate the quality of their program.
Reusability evaluation – The majority of the performance prediction models, such as the various LogP and BSP models, evaluated are either too simplistic or require a great deal of user interaction to function correctly. Among the models, lost cycles analysis [35] looks promising as it is easy to im-plement and it presents an easy-to-understand metaphor that illustrates where performance is being lost. However, one problem that will need to be addressed before implementing this strategy is how to report lost cycles with a granularity finer than at the application level. Another promising pre-diction model is Adve’s deterministic task graphs [36], as it provide a relatively low-cost solution for performance pre-diction.
Unit interaction – This unit is used by the analysis/data man-ager.
4.3.5 Performance bottleneck detection unit
This extra unit is responsible for the automatic identification of performance bottlenecks within the program. Using all available data, it checks to see if any of the predefined per-formance bottleneck patterns are observed.Reusability evaluation – As mentioned in the reusability evaluation of analysis units (section. 4.3.2), neither Paradyn’s W3 model nor KOJAK’s EXPERT is sufficient for bottleneck detection in UPC and SHMEM.
Unit interaction – This unit is used by the analysis/data man-ager.
4.3.6 Simulator
This extra unit enables the simulation of a user program under different system architectures. Since most users are interested in improving program performance on a particular architecture, the development of this unit is a low priority.
Unit interaction – This unit is used by the analysis/data man-ager to start simulations.
4.4 Presentation Module
This is the only module in the system that is fully exposed to the user. The presentation module is also used to facilitate program instrumentation and data visualization both before and after program execution.
4.4.1 Input interface unit
The user interface of the tool is a core unit and is used to facilitate code instrumentation before program execution, data processing/managing after program execution, and view selection before and after program execution. The com-mand-line interface will first be defined based on established standards to minimize the time needed to learn to use the tool. Once completed, the graphical interface will be developed
completely based on the command-line interface. This ensures that both interfaces will provide the same functionality, and will also reduce the number of changes required when modification to the interface is needed.
Reusability evaluation - SvPablo's primary interface simpli-fies user specification of source code instrumentation points, but uses a built-in parser that would be difficult to maintain. Tool Gear, a part of mpiP, provides an infrastructure for building performance data viewers that can communicate with a separate data collector. However, on platforms without DPCL (a major component of Tool Gear), the de-velopers must create their own collector, and the usefulness of the infrastructure for use in post-mortem analysis is lim-ited.
Unit interaction – This unit interacts with the source instru-mentation manager prior to program execution. It also fa-cilitates view selection in the visualization manager and basic event data management in event file manager.
4.4.2 Visualization manager unit
These core units are responsible for generation of various visualizations from event data (all types). Useful visualiza-tions featured in existing performance tools include timeline display, call-graph tree, speedup chart, communication vol-ume display, and array placement display. In addition, new user-defined views can be added through the plug-in view interface.
Reusability evaluation – None of the tools we evaluated pro-vide a complete solution. Jumpshot propro-vides an excellent timeline display visualization but lacks support for a profil-ing information display. TAU's Paraprof features a diverse set of visualizations for profile data, but relies on other tools for trace visualization. KOJAK's CUBE features an innova-tive browser for profile data extracted from a trace, but does not have a timeline viewer. HPC Toolkit also provides a useful display, integrating profile and source code correlation information, but does not support viewing traces.
Unit interaction – This unit calls the analysis/data manager to retrieve the appropriate data. It also interacts with the input interface unit for view selection.
4.5 Optimization Module
Units in the optimization module facilitate the optimization process that is often performed by the user by automating certain tasks. Units in the module can either be completely hidden from the user or exposed to the user.
4.5.1 Performance bottleneck resolution unit
This extra unit is responsible for automatic or semi-automatic bottleneck resolution after a bottleneck has been identified. No tool in existence currently provides this capability and the feasibility of this unit is still under investigation.Unit interaction – This unit interacts with the performance bottleneck detection unit.
5. CONCLUSIONS
In this paper, a framework for a UPC and SHMEM perform-ance analysis tool based on important findings from our tool evaluation, language analysis, and usability study was pre-sented. Units in the instrumentation, measurement, analysis, presentation, and optimization modules were discussed in terms of their primary functionalities, alternative develop-ment options, and reusability evaluation of appropriate com-ponents.
Our framework specifically targets global-memory parallel languages such as UPC and SHMEM but can also be adopted for the majority of parallel languages. The major difference between our framework and the existing designs is the reali-zation for the need to support the tracking and analysis of implicit and one-sided communication. Without a well formulated model, no tool can work well with these lan-guages. Another important realization is the need for com-piler developers to support a UPC performance interface, however, the details of this interface are beyond the scope of this paper.
The implementation of the UPC performance interface and the development of an implicit and one-sided communication model for bottleneck characterization are currently underway. A working prototype based on this framework is scheduled for beta-release in late 2006.
6. REFERENCES
[1] The UPC Consortium, “UPC Language Specifica-tions”, May 2005.
http://www.gwu.edu/~upc/docs/upc_specs_1.2.pdf [2] Official Unified Parallel C website.
http://www.upc.gwu.edu/
[3] SHMEM website.
http://www.npaci.edu/T3E/shmem.html
[4] A. Johnson, “CFD on the Cray X1E using Unified Parallel C”, a PowerPoint presentation, 5th UPC Work-shop, September 2005.
http://www.gwu.edu/~upc/upcworkshop05/ahpcrc-UP C_User_Forum.pdf
[5] Official Berkeley UPC website. http://upc.nersc.gov/
[6] Official GASNet website.
http://www.cs.berkeley.edu/~bonachea/gasnet
[7] Luiz DeRose, Bernd Mohr and Kevin London, “formance Tools 101: Principles of Experimental Per-formance Measurement and Analysis," SC2003 Tuto-rial M-11.
[8] K. London, S. Moore, P. Mucci, K. Seymour, R. Luc-zak, “The PAPI Cross-Platform Interface to Hardware Performance Counters”, Department of Defense Users' Group Conference Proceedings, Biloxi, Mississippi, June 2001.
[9] B. Mohr and F. Wolf. KOJAK - a tool set for auto-matic performance analysis of parallel applications. In European Conference on Parallel Computing (Eu-roPar), pages 1301–1304, Klagenfurt, Austria, LNCS 2790, August 26-29 2003. Springer-Verlag.
[10] B. P. Miller, M. D. Callaghan, J. M. Cargille, J. K. Hollingsworth, R. B. Irvin, K. L. Karavanic, K. Kunchithapadam, and T. Newhall. The paradyn paral-lel performance measurement tool. IEEE Computer, 28(11):37–46, November 1995.
[11] J. Labarta, S. Girona, V. Pillet, T. Cortes, and L. Gregoris. Dip: A parallel program development envi-ronment. In Euro-Par ’96: Proceedings of the Second International Euro-Par Conference on Parallel Proc-essing-Volume II, pages 665–674, London, UK, 1996. Springer-Verlag.
[12] P. Mucci. Dynaprof tutorial. In SC2003, Phoenix, AZ, United States, September 2003.
[13] J. Mellor-Crummey, R. J. Fowler, G. Marin, and N. Tallent. HPCVIEW: A tool for top-down analysis of node performance. The Journal of Supercomputing, 23(1):81–104, August 2002.
[14] Intel Cluster Tools website.
http://www.intel.com/software/products/cluster [15] A. Chan, W. Gropp, and E. Lusk. Scalable log files for
parallel program trace data(draft), 2000.
[16] J. Vetter and M. McCracken. Statistical scalability analysis of communication operations in distributed applications. In Principles and Practice of Parallel Programming (PPOPP), Snowbird, UT, United States, 2001.
[17] M. T. Heath and J. A. Etheridge. Visualizing the per-formance of parallel programs. IEEE Softw., 8(5):29–39, 1991.
[18] L. DeRose, Y. Zhang, and D. Reed. Svpablo: A multi-language performance analysis system. In 10th International Conference on Computer Performance Evaluation - Modeling Techniques and Tools - Per-formance Tools, pages 352–355, Palma de Mallorca, Spain, September 1998.
[19] B. Mohr, D. Brown, and A. Malony. TAU: A portable parallel program analysis environment for pC++. In CONPAR 94 - VAPP VI, pages 29–40, University of Linz, Austria, LNCS 854, September 1994. [20] A. Leko, H. Sherburne, H. Su, B. Golden, A.D.
George, “Practical Experiences with Modern Parallel Performance Analysis Tools: An Evaluation”,
http://www.hcs.ufl.edu/upc/toolevaluation.pdf
[21] M. Hermanns, B. Mohr, F. Wolf, “Event-based Meas-urement and Analysis of One-sided Communication”, Proceedings of the International Conference on Paral-lel and Distributed Computing (Euro-Par 2005), Lis-boa, Spain, September 2005.
[22] S.S. Shende, “The Role of Instrumentation and Map-ping in Performance Measurement”, a dissertation, U. of Oregon, August 2001.
[23] UPC Performance Interface Proposal,
http://www.hcs.ufl.edu/upc/upctoolint/
[24] GCC website.
http://www.gnu.org/software/gcc/gcc.html [25] Open 64 Compiler Tools website.
http://open64.sourceforge.net/ [26] Edison Design Group website.
http://www.edg.com/ [27] Keystone front-end website.
http://www.cs.clemson.edu/~malloy/projects/keystone/ doc.html
[28] K. A. Lindlan, J. Cuny, A. D. Malony, S. Shende, B. Mohr, R. Rivenburgh, and C. Rasmussen. A tool framework for static and dynamic analysis of ob-ject-oriented software with templates. In SC2000, Dallas, TX, United States, November 2000.
[29] Stanford SUIF/SUIF2 website. http://suif.stanford.edu/ [30] Sage++ website. http://www.extreme.indiana.edu/sage/ [31] Cetus presentation. http://min.ecn.purdue.edu/~troyj/slides/johnson04lcpc-slides.pdf [32] CIL website. http://manju.cs.berkeley.edu/cil/
[33] L. DeRose, T. Hoover, and J. K. Hollingsworth. The dynamic probe class library-an infrastructure for de-veloping instrumentation for performance tools. In In-ternational Parallel and Distributed Processing Sym-posium (IPDPS), San Francisco, CA, United States, April 2001.
[34] PCL website. http://www.fz-juelich.de/zam/PCL/
[35] M. E. Crovella, T. J. LeBlanc, “Parallel performance using lost cycles analysis”, Proceedings of the 1994 conference on Supercomputing, pp. 600–609, IEEE Computer Society Press, 1994.
[36] V. S. Adve, M. K. Vernon, “Parallel program per-formance prediction using deterministic task graph analysis”, ACM Trans. Comp. Sys., vol. 22, no. 1, pp. 94–136, 2004