1
Light sheet microscopy using an Airy beam
T. Vettenburg,1, H. I. C. Dalgarno,1 J. Nylk,1,2 C. Coll Lladó,3 D. E. K. Ferrier,3 T. Čižmár,4 F. J. Gunn-Moore,2 and K. Dholakia1
1School of Physics and Astronomy, University of St. Andrews, St. Andrews, U.K. 2School of Biology, University of St. Andrews, St. Andrews, U.K. 3The Scottish Oceans Institute, Gatty Marine Laboratory, School of Biology,
University of St. Andrews, St. Andrews, U.K. 4School of Medicine, University of St. Andrews, St. Andrews, U.K.
Corresponding authors:
T. Vettenburg <[email protected]> and K. Dholakia <[email protected]>
Light sheet microscopy facilitates rapid, high contrast, volumetric imaging with minimal sample exposure. However, the rapid divergence of a traditional Gaussian light sheet restricts the field-of-view that provides innate sub-cellular resolution. We show that the accelerating Airy beam innately yields high contrast and resolution up to a ten-fold larger field-of-view. In contrast to the Bessel beam which also provides an increased field-of-view, the Airy beam’s characteristic asymmetric excitation pattern results in all fluorescence contributing positively to the contrast, enabling a step change for light sheet microscopy.
Light sheet microscopy facilitates high contrast, volumetric imaging with minimal sample exposure by using two objectives placed orthogonally to one another that perform the tasks of excitation and detection. The lateral resolution is solely dictated by the numerical aperture (NA) of the detection objective whereas the axial resolution is determined by a combination of the NA of the detection optics and the width of the generated light sheet1. To ensure optimal excitation of the sample and isotropic resolution in all three dimensions, there is a simultaneous need for extended, uniformly thin light sheets in the excitation path. The Rayleigh range of the Gaussian beam used in traditional light sheet severely restricts the uniformly illuminated field-of-view (FOV)2. Capturing additional exposures of the sample from different angles to increase the FOV, unavoidably leads to a longer irradiation time and may induce photobleaching or damage3-5.
Propagation invariant light fields such as Bessel beams can create a thinner light sheet6 but the transversal outer ring structure of the Bessel beam produces background fluorescence and precludes high axial resolution unless two-photon excitation is used7,8. Single photon Bessel beam approaches can reclaim contrast using structured illumination (SI)7,9 or confocal scanning (CS)10 but the transversal structure of the Bessel beam still unnecessarily irradiates the sample (Supplementary Note 1).
We show that a single-photon light sheet created by the transversely accelerating asymmetric Airy beam11 provides a wide FOV in which the transverse beam structure contributes positively to the imaging process with no redundancy. As with the Bessel beam, the Airy light field has a propagation invariant intensity profile and can exhibit ‘self-healing’12,13. With its curved trajectory and asymmetric extended transverse structure parallel to a relatively weak and broad main lobe, the Airy beam may not appear to be advantageous for light sheet imaging; however, both the curved profile and the side-lobes of the generated light sheet are readily accounted for by a simple and efficient deconvolution. The Airy light sheet method thus lends itself to the efficient use of the captured fluorescence. A single Airy beam light sheet scan yields high contrast and resolution over an extended FOV and provides advantages over either a Gaussian or a Bessel beam light sheet. For the case examined here of similar numerical apertures in the excitation and illumination paths, the Airy beam shows up to a ten-fold and four-fold increase in FOV compared to the single-photon Gaussian and Bessel beam light sheets respectively, whilst sustaining high resolution. It can be implemented by a straightforward modification to existing apparatus.
To compare the different light sheet modes we developed a generic light sheet microscope using a spatial light modulator (SLM) to enable the holographic formation of apertured Gaussian, Bessel, and Airy beams as desired (see Online Methods). A fast scanning acousto-optic deflector (AOD) broadened each of the focused beams along the lateral y-dimension into light sheets within the sample volume (Fig. 1 and Supplementary Fig. 1).
P
RE
-P
R
O
OF RE
A
2
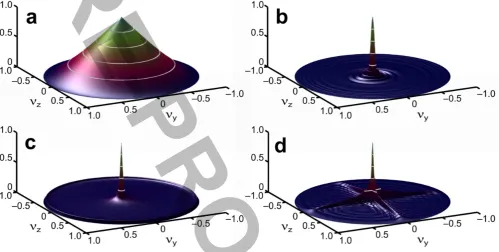
Figure 1: Airy beam light sheet microscopy. (a) The generation of a conventional apertured Gaussian, (b) a Bessel, and (c) an Airy profile. Quantitative plots of the transversal light sheet intensity distribution are shown in (d-f). (d) The transversal light sheet intensity distribution at the waist of four light sheets created with: an apertured Gaussian beam (dash-dotted black line), Bessel10 (solid blue line), Bessel5 (dotted red line), and an Airy beam (solid green line). The respective z-axis modulation transfer functions of the light sheets are shown at the waist (e) and at the plane x ≡ 25 µm (f).
We created two Bessel beams using annular apertures with different width such that the propagation invariance distance matched the required FOV (Supplementary Notes 2 and 3). We designated the beams Bessel10 and Bessel5, referring to the ratio β = w/R = 0.10 and 0.05, respectively where R is the objective back aperture radius and w is the annulus width. Bessel10 allowed us to compare the contrast and resolution for a limited FOV; while Bessel5, a closer approximation to the theoretical Bessel beam, enabled us to assess the detrimental impact on contrast and resolution when increasing the FOV by a factor of two.
The intensity cross sections (Fig. 1d) of the scanned light sheets all have an identical total z-integrated irradiance, thus all light sheets could in principle excite the same number of fluorescence photons when ignoring fluorophore saturation and damage. Such harmful side-effects are reduced for the Bessel and Airy beams as their peak irradiance is only a fraction of that of the apertured Gaussian light sheet: 22% for Bessel10, 12% for Bessel5, and 16% for the Airy beam (Supplementary Note 1). We compared the photobleaching rate of the different light sheets using time-lapse measurement of fluorescence from the gel-embedded dye Cy3 during repeated scanning and confirmed that the Bessel5 and Airy light sheets had the lowest rates of photobleaching (Supplementary Note 4).
P
RE
-P
R
O
OF RE
A
3
Figure 2: Experimental and simulated data for light sheet illumination with various beam types. (a) x−z section of the light sheet intensity. The light sheets propagate along the x-axis and are scanned with respect to the sample in the direction of the z-axis. (b) Light sheet microscopy simulated images of an artificial target closely matching the experimental parameters as specified in the Methods Section (top row) and deconvolution of the simulated images (bottom row). (c) Maximum intensity projections of fluorescent microspheres fixed in PDMS (top row) and deconvolution of the experimental data (bottom row). All images have the same scale and coordinate system in which the illumination focus is situated at x = 0. False-color coding is used for clarity of the light sheet profiles (inverted) and experimental images. Due to zeros in the MTF, deconvolution artifacts may be seen in the areas outside the theoretical FOV, marked in gray. (d-f) The trade-off between the axial resolution, illumination NA, and field-of-view: (d) the intrinsic axial resolution of the light sheet versus its NA, (e) the field-of-view versus NA, and (f) the axial resolution as a function of field-of-view. The line types used in panels (e) and (f) follow that specified in the legend of panel (d). (g) The experimentally determined full-width-at-half-maximum (FWHM) as a function of the distance from the light sheet waist.
A light sheet image scan can be understood mathematically as a convolution of the light sheet illumination with the fluorophore distribution in the sample. This makes it convenient to study the light sheet illumination process in the spatial frequency domain using the modulation transfer function (MTF), defined as the absolute value of the normalized optical transfer function (Supplementary Note 5). The MTF denotes relative image contrast as a function of spatial frequency and provides a valuable insight into the relationship between contrast and resolution of images obtained (Supplementary Note 3). Ideal imaging is achieved when the MTF is equal to one for all spatial frequencies. We compared the z-axis modulation transfer function of the beams at the waist (Fig. 1e) and 25 µm distant (Fig. 1f). The Gaussian beam had the highest contrast at the waist but this fell rapidly by x = 25 µm. Although the Bessel and the Airy beams exhibited much lower contrast at the waist they maintained their intensity cross section, and hence contrast, upon propagation. The same image sharpness seen at the light sheet waist will therefore be available over an FOV only limited by the length of the propagation invariant region.
The Bessel5 beam had the lowest contrast and highlights an important trade-off between the distance of propagation invariance and contrast for the Bessel beams (Supplementary Notes 2 and 3). Conversely, the MTF associated with the Airy beam maintained high values, even for spatial frequencies close to the diffraction limit. This is a consequence of the asymmetry of the Airy light sheet. Its optical transfer function is a function of both propagation distance and spatial frequency and the ensuing phase shift does not affect the signal-to-noise ratio (SNR). Both the image warping due to the inherent light sheet curvature and the blurring due to its side-lobes can be readily reversed with standard deconvolution techniques. Using simulations we found that an efficient one-dimensional z-axis deconvolution based on theoretical light sheets (Fig. 2a) was sufficient to recover near diffraction-limited resolution (Fig. 2b and Supplementary Note 6). We anticipate that direct measurement of the light sheet could further improve the deconvolution process.
P
RE
-P
R
O
OF RE
A
4
To experimentally characterize the FOV of all considered light sheets, we imaged a three-dimensional distribution of 1 µm diameter fluorescent microspheres fixed in poly-dimethylsiloxane (PDMS) within a capillary. With the apertured Gaussian light sheet, the fluorescent microspheres were well resolved within 8 µm of the beam waist but image contrast degraded rapidly beyond this point. The Bessel5 and Bessel10 light sheets extended the FOV to approximately ±21 µ m and ±41µm respectively, coinciding with the decline in the on-axis beam intensity (Fig. 2a). In general, the propagation distance of a Bessel beam is increased by reducing β (Supplementary Note 2). However, a reduction in β also has an adverse effect on resolution (Supplementary Note 3). Extending the FOV by a factor of two, i.e. changing from Bessel10 to Bessel5, resulted in lower axial resolution (Fig. 2c). In contrast, the FOV of the Airy beam was an order of magnitude larger than that of the apertured Gaussian beam but maintained comparable resolution; The Airy beam resolution and FOV exceeded those of the two Bessel beams (Fig. 2c).
Interestingly, the width of the main lobe of the Airy beam is typically about twice that of the Gaussian light sheet’s waist, yet the axial resolution obtained with both light sheets was comparable. This reinforces our view that, in contrast to the outer lobes of the Bessel beam, the side-lobes of the Airy beam contribute positively to the image formation.
Light sheet microscopy can improve the axial resolution of the wide field microscope by restricting the illumination to a width smaller than the depth-of-focus of the detection objective. Both the axial resolution and the field-of-view then depend upon the NA of the illumination objective and the light sheet type. We used simulations to examine the relationship between axial resolution, NA, and field-of-view for the four light sheet types. In all cases there was a trade-off between axial resolution and FOV. Increasing the NA of the illumination objective reduced the light-sheet width, thus increasing axial resolution (Fig. 2d), but this decreased the FOV (Fig. 2e). However, for most light-sheet types the intrinsic axial resolution is often large (Fig. 2f). For this reason, and in contrast to our configuration, it is important to note that a higher NA detection objective is often used to limit the depth-of-field of the detection path and increase axial resolution. The trade-off between axial resolution and FOV is far less severe for the Airy light sheet, where the intrinsic axial resolution remains smaller than 1.5 µm at the light sheet waist, in theory even for a FOV as wide as 1 mm.
To experimentally compare the resolving power of the different light sheet types we measured the full-width at half maximum (FWHM) of 50 isolated fluorescent microsphere images obtained from the sample shown in Fig. 2c. Because the fluorescence detection path in a light sheet microscope is identical to that of a wide-field microscope, similar lateral resolution could be expected but spherical aberrations induced by the air-glass interface of the square capillary resulted in a lateral FWHM of 1.9 µm±0.3 µm (std. dev.) for all four light-sheets. We also measured the axial resolution across the FOV (Fig. 2g). The FWHM achievable with the Gaussian light sheet was approximately linearly dependent on the distance, x, from the light sheet waist along the entire FOV. This dependency was reduced for the Bessel beam light sheets up to a distance inversely proportional to β, approximately 20 µm and 40 µm for Bessel10 and Bessel5, respectively, after which the FWHM increased rapidly. In comparison, the FWHM obtained with the Airy light sheet increased gradually and remained within 1.5 µm up to a distance of 100 µm from the center of the FOV.
We next compare
Half-FOV (µm) Resolution (nm) Efficiency (%) Peak Irrad./Efficiency (%)
Gaussian 8 726 99.5 100.0
Bessel10 21 1866 93.9 23.2
Bessel5 41 3883 84.7 14.7
Airy 173 865 74.3 21.6
Table 1: Comparison of various scanned light sheet types without post-excitation fluorescence filtering.
P
RE
-P
R
O
OF RE
A
5
Figure 3: Light sheet microscopy scan of a juvenile amphioxus. Volumetric images were acquired using Gaussian (a,b,g-j), Bessel (c,d,k-n) and Airy (e,f,o-r) illumination beams. F-actin is stained using Alexa Fluor 488 Phalloidin (green), and propidium iodide is used as a counterstain indicating nucleic acid material (recolored magenta). Two-dimensional sections are shown at z = 0 µm (a,c,e), and at y = 0 µm (b,d,f), for the respective beam types. Two sections along the light-sheet propagation axis (x) are shown for planes at x = –40 µm (c,g,k), and x = 0 µm (d,h,l).
The Bessel beam light sheets displayed a lower efficiency due to their broad transverse structure, yet more than 50% of the light could still be captured for a propagation invariant distance of 103 µm. Relative to the apertured Gaussian light sheet they possessed a reduced peak-irradiance leading to a potential advantage in terms of reduced photobleaching. There was a clear trade-off however between FOV and axial resolution when using a smaller annulus to generate Bessel beams with longer propagation distances.
Two different methods, structured illumination (SI) and confocal scanning (CS), have been described to remove the fluorescence arising from the Bessel beam side lobes, thus mitigating the reduction in axial resolution. For SI the sample is irradiated by multiple beams, and for CS the fluorescence from the outer lobes of the Bessel beam is blocked. A side-effect of these processes is that only a fraction of the excited fluorescence is used for imaging and thus the irradiance of the sample must be increased to achieve a comparable SNR (Supplementary Note 1). This increase in irradiation practically nullifies the reduction in peak irradiance. More than 80% of the sample is irradiated unnecessarily when using SI and over 90% of the fluorescence is rejected when using CS. The combination of Airy light sheet illumination and deconvolution discards little fluorescence, allowing sample irradiation to be kept to a minimum. Due to the high efficiency, the peak irradiance can be reduced nearly five-fold.
Further, we assessed the performance of all light sheet types on a variety of biological samples. We first examined membrane-labeled renal adenocarcinoma (ACHN) cells using an equivalent set-up where the objective lenses were both replaced with water-dipping objectives and stopped down to match the numerical apertures of the set-up used to image fluorescent microspheres. The resolution was comparable for both Gaussian and Airy light sheet modes in the lateral dimensions x and y (Supplementary Fig. 2a and b), whereas the axial resolution degraded within 10 µm of the focus for the Gaussian light sheet while the Airy beam allowed sub-cellular axial resolution for all cells (Supplementary Fig. 2c and d). For a larger sample the Gaussian focus is affected by cells in the light path (Supplementary Fig. 3a,e). Even without in situ aberration correction14,15, the Airy light sheet can obtain high resolution throughout the 80 µm FOV (Supplementary Fig. 3b,d,f). We believe this may be aided by the relative insensitivity of propagation invariant beams to optical obstacles13,16.
As an example of a large, highly scattering sample, we imaged actin and nucleic acid in a juvenile amphioxus (Fig. 3), a marine invertebrate. A gradual decrease in image brightness and sharpness was apparent for increasing x
as the light sheet penetrated the sample, and refractive index inhomogeneities precluded a sharp focus of the Gaussian light sheet. In comparison, the Bessel5 beam and Airy beam images displayed increased sharpness of the fiber-structures deep within the organism. The Bessel beam did however show a reduction in contrast and an amplification of the photon noise (Fig. 3e-h) as well as image artefacts at both ends of the propagation-invariant region (Fig. 3e,f). Visibly higher contrast was observed in the Airy light sheet images (Fig. 3i-l). Similarly, imaging of the tail of a juvenile amphioxus stained with propidium iodide using all beam types showed the highly organized
P
RE
-P
R
O
OF RE
A
6
arrangement of nuclei in the notochord, but it was only fully resolved across the whole field-of-view with the Airy beam (Supplementary Fig. 4). Finally, only the Airy beam light sheet clearly resolved fine details such as individual sarcomeres in a muscle block of a zebrafish larvae (Supplementary Fig. 5).
In contrast to the Bessel beam, the transversal intensity profile of the Airy beam can be exploited to ensure high axial resolution over an extended field-of-view without increasing the sample exposure, or increasing the number of images required. This can be readily achieved by simply introducing a cubic phase mask at an appropriate position in the optical train of a single photon light sheet microscope. The Airy beam light sheet thus presents a powerful advance towards high resolution imaging of large biological specimens with limited sample irradiation.
Acknowledgments
The project was supported by the UK Engineering and Physical Sciences Research Council, RS MacDonald Charitable Trust, Scottish Universities Life Sciences Alliance, and the St. Andrews 600th anniversary BRAINS appeal. The PhD apprenticeship of C.C. was funded by the School of Biology. The authors thank A.M. Tilston-Lunel, M.L. Torres-Mapa, Z. Allen, and A. Chatterton for their assistance with the cell culture, M. Ploschner for advice and proofreading of the manuscript, P.A. Reynolds for the fruitful discussions on the biological aspects of this study, and C. Penedo for his assistance with the photobleaching studies.
Author contributions
The Airy beam light sheet was developed by T.V. and K.D. T.V., H.I.C.D., T.Č., and J.N. conducted all the experiments. C.C. and D.E.K.F. provided and prepared the amphioxus and zebrafish samples and assisted with the imaging and interpretation. F.J.G. assisted with all the biological experiments. J.N. and T.V. performed the simulations and data processing. T.V. and K.D. wrote the manuscript with contributions from all the authors.
P
RE
-P
R
O
OF RE
A
7
Online Methods
Simulations
The light sheet for each illumination mode is calculated from the corresponding pupil-function as the vectorial point-spread function, and integrating its intensity along the y-axis. The theoretical light sheet profile is employed both for deconvolution as well as for the simulations shown in Fig. 2. The acquisition is simulated as a standard wide-field diffraction-limited detection process with Poissonian distributed noise, corresponding to a charge-coupled device (CCD) array with a well depth of 18,000 electrons. Before simulating the deconvolution, the recorded signal is quantized by an 8-bit analogue-to-digital conversion. The deconvolution procedure itself is detailed in Supplementary Note 6.
Light sheet microscopy setup
The laser beams (Coherent Verdi V6, 6W 532 nm and Spectra Physics Argon-ion 2040E, 10W, 488 nm) are passed through a single mode fiber and expanded to fill the aperture of an acousto-optical deflector (AOD, Neos AOBD 45035-3, see Supplementary Fig. 1) which creates the light sheet by scanning the laser focus along the y-axis. The scan period of 50 µs is considerably shorter than the exposure time in our experiments (10ms→50ms). The AOD aperture is re-imaged by a 2× magnifying telescope (L1 and L2) to overfill the active area of a spatial light modulator (SLM, Hamamatsu LCOS X10468-04). Instead of a static phase mask, we employed an SLM to enable rapid dynamic switching of the light sheet type. The SLM enabled us to record data sets for the various beam types with the same set-up. The SLM reflects a disk shaped area in the case of the apertured Gaussian and Airy beams. In the case of the Bessel beams the central part of the aperture is blocked and only an annular area is used. The Airy beam is created by modulating the wave front at the back aperture with a cubic polynomial function: ( + ) , where and , are the normalized Cartesian pupil coordinates aligned with the y and z-axes respectively, and is the excitation wavelength. The dimension-less parameter α dictates the propagation invariance of the Airy beam (Supplementary Note 2). Unless otherwise stated, the value of α = 7 was used as it ensures near diffraction-limited resolution across the entire FOV of our experimental set-up (Supplementary Notes 2 and 3). Importantly, the use of an SLM also permitted the elimination of residual aberrations in the system14,15, thereby ensuring that the beams closely resemble their theoretical descriptions. The active area of the SLM is imaged onto the back aperture of the excitation objective (MO1, Mitutoyo 20×/0.42, working distance 20 mm, see Supplementary Fig. 1), via a demagnifying telescope (0.5×) with a slit aperture at its focus to select the first diffraction order. The sample was mounted on an xyz piezo-stage (Mad City Labs, Nano-LP200) to allow automatic positioning with respect to the light sheet and the focal plane of the detection objective. Depending on the sample and wavelength, the power at the back aperture was set between 30 µW and 300 µW and kept constant during recording with the different light sheet types. The irradiance of the light sheet for imaging cells was typically 70 Wcm–2. Fluorescence was detected using a CCD camera (CCD1, Basler piA640-210gm) via an orthogonally mounted objective (MO2, Newport 20×/0.40) with an appropriate tube lens (TL1) and fluorescence filter. Beam characterization and alignment are aided by the auxiliary objective (MO3, Mitutoyo 50×/0.55), and camera (CCD2, Basler piA640-210gm) with an appropriate tube lens (TL2). A combination of piezo-stage translation and holographic deflection with the SLM was used to scan the fluorescent microsphere sample in 50 nm steps, while biological samples were scanned in steps of 200 nm. LabVIEW software (National Instruments) was used to interface the camera, nanostage, SLM, AOD, and lasers. An equivalent set-up was used to image biological samples water-immersed in a Petri dish. The objective lenses MO1 and MO2 were both replaced with stopped down water dipping objectives (Nikon CFI Apo 40×/0.80 DIC, working distance 3.5 mm) and image stacks were recorded with an sCMOS camera (Orca Flash 4.0, Hamamatsu).
Measurement of bleaching rate
Homogeneous test samples with a high concentration of Cy3-streptavidin (645 M, Life Technologies) were prepared using 15% polyacrylamide gel and left over night to set and limit the diffusion of the dye through the gel matrix. The fluorescence intensity was recorded as a function of time and position x in the field-of-view. Photobleaching was seen throughout the field-of-view of the camera; however, the field-of-view of the respective light sheet types (Supplementary Note 1) marked the region with the highest rate of photobleaching. The photobleaching rate was determined by integrating the fluorescence intensity over a 10 µm wide volumetric section centered at the point with
P
RE
-P
R
O
OF RE
A
8
the highest photobleaching rate. This point was generally located a few micrometers closer to the illumination objective than the light sheet waist, we attribute this to absorption along the propagation axis.
Cell culture
Renal cell adenocarcinoma (ACHN, CLS Cell Line Services) cells were grown in rotating culture flasks (CELLSPIN, Integra Biosciences) under standard conditions (37°C, 5% CO2) and in growth medium comprising Dulbecco’s Modified Eagle’s Medium (DMEM, Sigma Aldrich) for 2-3 weeks to form spheroids. The cell line was routinely tested for mycoplasma (negative).
Sample preparation
The plasma membrane of the ACHN cell spheroids was stained with an Alexa Fluor 488 conjugate of Wheat Germ Agglutinin (Alexa Fluor 488 WGA, Life Technologies) following the recommended protocol for labeling pre-fixed eukaryotic cells; the ACHN cell spheroids were fixed with 4% paraformaldehyde (PFA, Sigma Aldrich) and incubated at 37°C for 15 minutes and then washed three times in Hank’s Balanced Salt Solution (HBSS, Sigma Aldrich), WGA conjugate was then added at a concentration of 5 g/mL and the mixture incubated for 10 minutes at room temperature, the cells were washed twice with HBSS and finally suspended in HBSS. As the ACHN cell spheroids were in suspension, removal of the PFA, wash and WGA conjugate was performed by gently centrifuging (100×g) to allow the cells to form a pellet and removing the supernatant.
Tissue phantoms were prepared by mixing fluorescent microspheres (1 µm diameter, R0100, Duke Scientific) with liquid polydimethylsiloxane (PDMS, Slygard 184 Elastomer Kit, Dow Corning) and pipetted into a borosilicate square-profile capillary (Vitrotube 8250-100, Hawksley) before curing at 60°C for two hours. Additionally, the fluorescent microspheres were used as calibration probes for in situ wavefront correction 14, 15. Note that for imaging of highly turbid samples this method could be combined with the use of a deformable mirror in the detection path as recently demonstrated17.
Cell solutions were prepared for suspension by adding a liquid 1% low-melting point agarose solution (peq-GOLD, Peqlab) and gentle mixing. A small 50 µL drop of the mixture was then placed in a Petri dish and allowed to set for ten minutes.
A 17 days-post fertilization zebrafish larvae (Danio rerio, gender not determinable at age) was humanely killed by an overdose of ethyl 3-aminobenzoate methanesulphonate (MS-222, Sigma). Schedule 1 techniques are used in compliance with the Animals (Scientific Procedures) Act regulations and are authorised by the Animal Welfare and Ethics Committee of the University of St. Andrews. Both zebrafish and juvenile amphioxus (Branchiostoma lanceolatum, gender not determinable at age) were fixed in 4% (m/v) PFA in morpholinopropanesulfonic acid buffer (0.5 M NaCl, 2 mM MgSO4, 1 mM EGTA, 0.1 M morpholinopropanesulfonic acid buffer, pH 7.5) for one hour at room temperature and then washed three times in PBT (1x phosphate buffered saline solution, 0.1% Triton X-100). After peeling the amphioxus ‘skin’ off, both specimens were permeabilized in PBT for one hour at room temperature. Prior to the staining, an RNAse treatment was performed, consisting of a brief wash in 2x SSC (0.3 M NaCl, 0.03 M sodium citrate, pH 7.0), followed by incubation with 100 g/mL DNAse-free RNAse A (Promega) in 2xSSC for 20 minutes at 37°C, and three washes with 2x SSC. Non-specific binding sites were blocked with 5% normal goat serum (NGS), 1.5% bovine serum albumin (BSA), 0.1% Triton-X100 in phosphate buffered saline solution (PBS) for one hour at room temperature. To visualize actin filaments, the specimens were stained overnight at 4°C in continuous agitation, with Alexa Fluor 488 Phalloidin (Life Technologies) diluted 1:40 (v/v) in 1.5% BSA, 0.1% Triton X-100 PBS. After a brief wash in 2x SSC, a 1:1650 (v/v) dilution of propidium iodide (PI, Life Technologies) in 2x SSC was employed as nuclear counterstaining for 15 minutes at room temperature. Samples were rinsed several times in 2x SSC and embedded in 1% low-melting point agarose in a Petri dish.
P
RE
-P
R
O
OF RE
A
9
References
1. Engelbrecht, C.J. & Stelzer, E.H. Opt. Lett.31, 1477–1479 (2006). 2. Sheppard, C.J.R. Opt. Express21, 6339–6345 (2013).
3. Huisken, J. & Stainier, D.Y.R. Opt. Lett.32, 2608–2610 (2007).
4. Krzic, U., Gunther, S., Saunders, T.E., Streichan, S.J. & Hufnagel, L. Nat. Methods9, 730–733 (2012). 5. Tomer, R., Khairy, K., Amat, F. & Keller, P.J. Nat. Methods9, 755–763 (2012).
6. Durnin, J., Miceli, J.J. & Eberly, J.H. Phys. Rev. Lett.58, 1499–1501 (1987). 7. Planchon, T.A. et al. Nat. Methods8, 417-423 (2011).
8. Olarte, O.E. et al. Biomed. Opt. Express3, 1492–1505 (2012). 9. Gao, L. et al. Cell151, 1370-1385 (2012).
10. Fahrbach, F.O. & Rohrbach, A. Nat. Methods9, 223–223 (2012).
11. Siviloglou, G.A., Broky, J., Dogariu, A. & Christodoulides, D.N. Phys. Rev. Lett.99, 213901 (2007). 12. Baumgartl, J., Mazilu, M. & Dholakia, K. Nature Photon.2, 675-678 (2008).
13. Broky, J., Siviloglou, G.A., Dogariu, A. & Christodoulides, D.N. Opt. Express16, 12880–12891 (2008). 14. Čižmár, T., Mazilu, M. & Dholakia, K. Nature4, 388–394 (2010).
15. Dalgarno, H.I.C. et al. Appl. Phys. Lett.100, 191108 (2012).
16. Fahrbach, F.O., Simon, P. & Rohrbach, A. Nature Photon.4, 780–785 (2010).
17. Bourgenot, C., Saunter, C.D., Taylor, J.M., Girkin, J.M. & Love, G.D. Opt. Express 20, 13252–13261 (2012).
Competing Financial Interests
The University Court of the University of St Andrews, U.K. has filed a U.K. patent application on this intellectual property right, which is currently progressing through the international patenting process. International Publication Number: WO 2013/150273 A1, published on 10th October 2013.
P
RE
-P
R
O
OF RE
A
Light sheet microscopy using an Airy beam
T. Vettenburg,1,∗ H. I. C. Dalgarno,1 J. Nylk,1, 2 C. Coll Llad´o,3
D. E. K. Ferrier,3 T. ˇCiˇzm´ar,4 F. J. Gunn-Moore,2 and K. Dholakia1,†
1
School of Physics and Astronomy, University of St. Andrews, St. Andrews, U.K. 2School of Biology, University of St. Andrews, St. Andrews, U.K.
3The Scottish Oceans Institute, Gatty Marine Laboratory,
School of Biology, University of St. Andrews, St. Andrews, U.K. 4
School of Medicine, University of St. Andrews, St. Andrews, U.K.
Supplementary Information
Supplementary File Title
Supplementary Figure 1 Schematic of the Airy beam light sheet microscope.
Supplementary Figure 2 Lateral and axial projections of a renal adenocarcinoma cell cluster comparing the conventional Gaussian light sheet and the Airy beam light sheet.
Supplementary Figure 3 Axial slice through a 3D volumetric image of an ACHN cell spheroid.
Supplementary Figure 4 Maximum intensity projections of two sections of the tail of a juvenile amphioxus, imaged with the Gaussian, Bessel10, Bessel5, and Airy light sheet.
Supplementary Figure 5 Maximum intensity projections of zebrafish musculature.
Supplementary Note 1 Discussion of the various light-sheet microscopy variants and implementations.
Supplementary Note 2 Field-of-view as a function of the beam parameters.
Supplementary Note 3 Axial resolution as a function of the beam parameters.
Supplementary Note 4 Experimental comparison of the photobleaching rate.
Supplementary Note 5 Modulation transfer function of a light sheet.
Supplementary Note 6 Description of the deconvolution algorithm.
∗[email protected] †[email protected]
S1
P
RE
-P
R
O
OF RE
A
Supplementary Figure 1
Supplementary Figure 1. Schematic of the Airy beam light sheet microscope. The sample (Sample) is illuminated with a light sheet emanating from the excitation objective (MO1) and propagating along thex-axis, while the detection objective (MO2) and tube lens (TL1) collect fluorescence along thez-axis and form an image on an area detector (CCD1). The light sheet is created by expanding coherent light (Laser, wavelength 488nmor 532nm) to overfill the active area of a fast scanning (y-axis) acousto-optic deflector (AOD) and a spatial light modulator (SLM), reimaged using an appropriate telescope (L1-L2), and onto the back aperture of the excitation objective (MO1, telescope not shown). An auxiliary detection objective (MO3), tube lens (TL2) and detector (CCD2) were used only for the characterization of the light sheet microscope.
S2
P
RE
-P
R
O
OF RE
A
Supplementary Figure 2
Gaussian
Airy
a
b
c
d
10 0 -30 -40
-20
-10
y
(µm)
-30 0 10
-40 -20
x (µm)
-10 20
10 0 -30 -40
-20
-10
y
(µm)
-30 0 10
-40 -20
x (µm)
-10 20
30 20 -10 -20
0
10
z
(µm)
-30 0 10
-40 -20
x (µm)
-10 20
30 20 -10 -20
0
10
z
(µm)
-30 0 10
-40 -20
x (µm)
-10 20
Supplementary Figure 2. Lateral and axial projections of a renal adenocarcinoma (ACHN) cell cluster comparing the conventional Gaussian light sheet and the Airy beam light sheet. Maximum intensity projections, along thez(a,b) and along they-axis (c,d), of a cluster of plasma membrane stained (Alexa Fluor 488 WGA) renal adenocarcinoma cells, created by spin culturing the cell line. The same cluster is imaged using the conventional Gaussian light sheet (a,c), and using an Airy light sheet (b,d). Correct deconvolution along the z-axis is only possible for the volumetric image recorded using the Airy light sheet.
S3
P
RE
-P
R
O
OF RE
A
Supplementary Figure 3
z
(µm)
0 -40 20 -20 40-60 -40 -20 0 20
x
(µm)
Gaussian
Airy
a
c
e
b
d
f
z
(µm)
0 -40 20 -20 40-60 -40 -20 0 20
x
(µm)
x
(µm)
-50 -45 -40 -35 -30 -55 -30 -40 -35 -45
z
(µm)
x
(µm)
-50 -45 -40 -35 -30 -55 -30 -40 -35 -45
z
(µm)
0 10 20
x
(µm)
5 15 25
0 -10 -5 -15
z
(µm)
0 10 20
x
(µm)
5 15 25
0 -10 -5 -15
z
(µm)
Supplementary Figure 3. Axial slice through a 3D volumetric image of an ACHN cell spheroid. The cell spheroid is created by spin culturing a renal adenocarcinoma cell line, where the plasma membranes are stained with Alexa Fluor 488 WGA (see Online Methods). (a) The sample imaged using a conventional Gaussian light sheet. (b) The same sample imaged using the Airy light sheet method. To show a membrane slice far away from the light sheet waist, the y-position of the slice is chosen so to coincide with the cell membrane in the top left corner. Details of the cell membranes are shown for the conventional Gaussian (c,e), and the Airy light sheet (d,f), near the surface of the cell spheroid (c,d), and through multiple layers of cells (e,f). The cell membrane cannot be resolved without digital processing, and artifacts occur when the conventional light sheet image is deconvolved. The cell membrane can only be resolved well with the Airy light sheet method.
Supplementary Figure 4
Supplementary Figure 4. Maximum intensity projections of two sections of the tail of a juvenile amphioxus, imaged with the different light sheets. Projections along they-axis (a,c,e,g) andx-axis (b,d,f,h) of an amphioxus, stained with propidium iodide, imaged with light sheet microscope using Gaussian (a,b), Bessel10 (c,d), Bessel5, (e,f) and Airy (g,h) beam illumination. In all images the elongated nuclei of the notochord are clearly visible but these are only fully resolved over the entirety of the image using the Airy light sheet method. Additionally, maximum intensity projections along they-axis taken in an anterior position of the tail with Gaussian (i) and Airy beam (j) illumination show the notochord (elongated ordered nuclei) and the surrounding muscular tissue. The morphological differences between the notochord and the muscle are only clearly resolved with the Airy light sheet.
S5
P
RE
-P
R
O
OF RE
A
Supplementary Figure 5
Supplementary Figure 5. Maximum intensity projections of zebrafish musculature. Projections of 10µm thick slices from light sheet image stacks, centered aty= 25µm (a,d,g,j),x=−35µm (b,e,h,k), andz= 5µm (c,f,i,l), acquired using Gaussian (a,b,c), Bessel10 (d,e,f), Bessel5 (g,h,i), and Airy (j,k,l) beam illumination. Images show a section of muscle block within a juvenile zebrafish larva stained with Alexa Fluor 488 Phalloidin (green) to indicate F-actin and propidium iodide (magenta) as a nuclear counterstain. Each color channels (recorded data not saturated) is normalized to its maximum value for visibility and added. The V-shaped intermuscular septa, separating two myomeres, is visible in thez-axis projection. The dark line at
x=−30µm is attributed to the dorsal region of the myotome. Muscle fibers and their sarcomeres can only be clearly resolved in (j,l) and (k,l) respectively, when using the Airy light sheet method.
S6
P
RE
-P
R
O
OF RE
A
Supplementary Note 1: Discussion of the various light-sheet microscopy
variants and implementations
In recent years several variants of light sheet microscopy have been developed, often with the aim to improve the axial resolution whilst maintaining a useful field-of-view. Bessel beams have proven useful to illuminate the sample uniformly over the field-of-view. However, without further modification of the conventional light sheet microscope, the fluorescence background from the broad transverse structure of the Bessel beam reduces the axial resolution and contrast. The deteriorating effect of the broad transversal structure of the Bessel beam can be mitigated by relying on two-photon excitation7. This technique maintains many advantages of conventional digitally scanned light
sheet microscopy, whilst significantly improving the trade-off between axial resolution and field-of-view. However, it depends on the availability of appropriate high power laser sources and fluorescent markers with an adequate two-photon cross-section, thus limiting the ability of multi-color imaging, and the photo-stability of biological samples.
Single photon excitation Bessel beam light sheet microscopy cannot, in principle, achieve high axial resolution. Although in this paper we investigate such propagation invariant modes for the single photon case without additional post-excitation filtering, it should be noted that methods exist that borrow concepts from either structured illumi-nation microscopy (SI) or from confocal scanning microscopy (CS) to separate the fluorescence excited at the focal plane from that excited by the side lobes:
SI: Bessel beam Light Sheet Microscopy with Structured Illumination: In this method the sample is not illuminated with an orthogonal plane but with a periodic grid of Bessel beams. By translating the periodic pattern along they-axis in the plane of the light sheet, preferentially the fluorescence at the Bessel beam core is modulated. The acquisition of an image sequence allows the computation of an image with an axial resolution comparable to the core of the Bessel beam. Although the acquisition speed is reduced by a small factor, the advantage of high axial resolution over a wide field-of-view makes this an attractive method. Note however that the sample has to be irradiated multiple times per plane, and that even if only fluorescence from the Bessel beam core is used, the whole transversal structure of the Bessel beam unnecessarily irradiates the sample7,9.
CS: Confocal Scanning Light Sheet Microscopy: A hybrid between light sheet and confocal microscopy can be employed to selectively detect the fluorescence from the central maximum of the Bessel beam. Instead of scanning a spot and filtering the fluorescence with a pinhole as in confocal microscopy, a Bessel beam is scanned while a line detector preferentially detects the light emitted from fluorophores excited by the Bessel beam core18.
In contrast to a one-dimensional light sheet scan along the z-axis, a Bessel beam is thus raster-scanned along both the y- and the z-axis, and the 3D image will thus be constructed line-by-line instead of plane-by-plane. Although this would require a 2D scan to obtain a 3D image, technological advances could overcome a decrease in acquisition speed. It should however be noted that most of the energy of the Bessel beam is carried in its transversal structure and the associated fluorescence therefore discarded, so part of the sample is irradiated unnecessarily.
As with the Airy beam light sheet method, the Bessel beam methods irradiate the sample with a relatively large transverse structure. Structured illumination or confocal scanning of the Bessel beam can reclaim axial resolution by selectively rejecting fluorescence excited by its transverse structure. However, in this process the sample is still exposed to the photobleaching and potentially damaging irradiation of the transverse structure. In contrast, no fluorescence has to be rejected for the Airy beam method. The deconvolution step recombines all collected fluorescence into a high resolution volumetric image. In practice, fluorescence emitted far from the focal plane cannot be collected efficiently, so no method will be able to utilize all fluorescence emitted within the cone of acceptance of the detection objective.
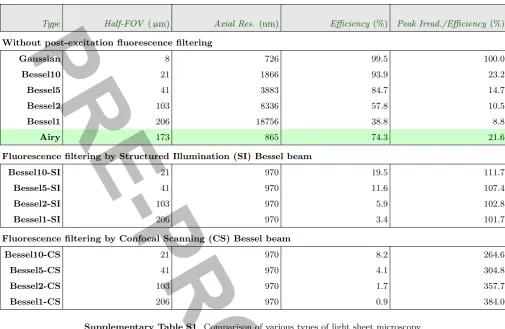
Supplementary Table S1shows a comparison of the light sheet microscopy types and variants: the conventional light sheet (Gaussian), Bessel beam light sheets (Bessel10, Bessel5, Bessel2, and Bessel1) where the number indicates the width of the annular aperture as a percentage ratio of the total aperture radius, and Airy beam light sheet (Airy). The post-fix ‘SI’ refers to the use of structured illumination to isolate the fluorescence excited at a plane with thickness comparable to the Bessel beam core of the corresponding numerical aperture and wavelength. The post-fix ‘CS’ refers to the use of confocal scanning Bessel beam light sheet microscopy to isolate the core of the Bessel beam, thus also eliminating the fluorescence of transversal structure that falls within the focal plane. The theoretical propagation invariance of all light sheets is given as calculated inSupplementary Note 2, followed by the resolution calculated numerically using the criterion inSupplementary Note 3, or the smaller core width of the Bessel beam (970 nm) in case of the structured illumination and confocal adaptation (Supplementary Note 1). The next column shows the efficiency calculated as the fraction of fluorescence, emitted within the cone of acceptance of the detection objective, that is used to form the final volumetric image. The final column shows the peak irradiance with respect to that of the apertured Gaussian light sheet and for an equal number of used photons.
S7
P
RE
-P
R
O
OF RE
A
Type Half-FOV (µm) Axial Res. (nm) Efficiency (%) Peak Irrad./Efficiency (%)
Without post-excitation fluorescence filtering
Gaussian 8 726 99.5 100.0
Bessel10 21 1866 93.9 23.2
Bessel5 41 3883 84.7 14.7
Bessel2 103 8336 57.8 10.5
Bessel1 206 18756 38.8 8.8
Airy 173 865 74.3 21.6
Fluorescence filtering by Structured Illumination (SI) Bessel beam
Bessel10-SI 21 970 19.5 111.7
Bessel5-SI 41 970 11.6 107.4
Bessel2-SI 103 970 5.9 102.8
Bessel1-SI 206 970 3.4 101.7
Fluorescence filtering by Confocal Scanning (CS) Bessel beam
Bessel10-CS 21 970 8.2 264.6
Bessel5-CS 41 970 4.1 304.8
Bessel2-CS 103 970 1.7 357.7
Bessel1-CS 206 970 0.9 384.0
Supplementary Table S1. Comparison of various types of light sheet microscopy.
Although Bessel beam illumination may not allow optimal use of the photon budget, structured Bessel beam light sheet illumination in combination with three-dimensional super-resolution image-restoration can increase the lateral (y) and axial (z) resolution beyond the diffraction limit19. To limit photo-damage due to high peak powers, instead of
[image:17.595.54.560.48.377.2]stepping a single Bessel beam to form the structured illumination, the same can be achieved with several, e.g. 7, parallel Bessel beams with proportionally lower peak intensity9. Ignoring the total sample irradiation, Supplementary Fig. S1shows image sections of a fluorescent USAF1951 test target, extended along the light sheet propagation axis (x), obtained by simulation of conventional Gaussian, super-resolution structured illumination Bessel beam (β = 0.10, 0.05, 0.02, or 0.01), and Airy beam (α= 4, see Online Methods) light sheet microscopy. The structured illumination light sheets were formed by stepping the beam with steps of 1µm, offset by three different phases perz-slice. Lateral-axial (y−z) sections are shown at the light sheet waist (x= 0), and atx= 50µm. Detector pixelation and photon noise are simulated matching the experimental conditions as described in the Online Methods. The image stacks obtained with the Bessel light sheet are further processed using the three-dimensional structured illumination super resolution algorithm19. The Airy light sheet image stacks are simply axially deconvolved with a one-dimensional
Wiener filter20. The dimensions of the largest bars at the bottom right are 10µm×2µm and the three bars are
separated by 2µm. Consecutive sets of bars are scaled by √6
2 so that the set on the top right has bars of size 5µm×1µm. The intensity of each light sheet type has been adjusted so that, before simulating photon noise, the maximum value on the detector is 80% of the maximum read-out. The intensity reduction along the propagation axis of the Bessel precludes high contrast for Bessel10-SI and Bessel5-SI atx= 50µm. Note that the image intensity is renormalized for clarity of display. The transversal structures of Bessel2 and Bessel1 irradiate a relatively wide sample volume; however, structured illumination super resolution can reclaim contrast and resolution at x= 50µm due to the larger propagation invariance. Although the Airy light sheet in simple scanning mode cannot quite resolve the same detail as the super-resolution structured illumination Bessel method, it achieves a large field-of-view with near diffraction-limited resolution whilst keeping the sample irradiation to a minimum and below that for the Bessel SR-SIM cases considered. In the example of the images shown inSupplementary Fig. S1, the total sample irradiance with respect to the conventional Gaussian light sheet was 3.1, 3.7, 5.5, and 6.6 times higher for Bessel10-SI, Bessel5-SI, Bessel2-Bessel5-SI, and Bessel1-Bessel5-SI, respectively. This increased irradiation is partially due to the multiple acquisitions acquired per frame, one for each of the three phases, and partially due to the broad transversal structure of the Bessel beam for small values ofβ. In contrast, the Airy light sheet requires only a single sample exposure perz-slice, in this
S8
P
RE
-P
R
O
OF RE
A
Gaussian Bessel5-SI
x
= 0 µm
x
= 50 µm
Airy Bessel10-SI
Bessel1-SI Bessel2-SI
x
= 0 µm
x
= 50 µm
0 10 20
z (µm)
–10
–20
y (µm)
–30 –20 –10 0 10 20 30
0 10 20
z (µm)
–10
–20 0 10 20
z (µm)
–10
–20 0 10 20
z (µm)
–10
–20
y (µm)
–30 –20 –10 0 10 20 30
y (µm)
–30 –20 –10 0 10 20 30
y (µm)
–30 –20 –10 0 10 20 30
y (µm)
–30 –20 –10 0 10 20 30
y (µm)
–30 –20 –10 0 10 20 30
Supplementary Figure S1. Comparison of conventional, structured illumination Bessel beam, and Airy beam light sheet microscopy. Lateral-axial (y−z) sections of a simulated USAF1951 test target, elongated along the light sheet propagation axis (x), are shown at the light sheet waist (x= 0), and at x= 50µm. The sample irradiation was adjusted for each light sheet type so that the maximum fluorescence signal per frame is 80% of the detector saturation. The total irradiance with respect to the Gaussian light sheet was 3.1, 3.7, 5.5, 6.6, and 1.02 times for Bessel10-SI, Bessel5-SI, Bessel2-SI, Bessel1-SI, and the Airy light sheet, respectively. Detector pixelation and photon noise are simulated matching the experimental conditions as described in the Online Methods. The image stacks obtained with the Bessel light sheet are further processed using the three-dimensional structured illumination super resolution algorithm19, while the Airy light sheet image stacks are only axially deconvolved with a one-dimensional Wiener filter20. More details can be found in Supplementary Note 6. The final image intensity is renormalized for clarity of display. The dimensions of the largest bars at the bottom right are 10µm×2µm. See note 1 for more information.
case with a total irradiance increase of 2% over that of the conventional Gaussian light sheet. Also the peak-irradiance of the stepped Bessel beam light sheet is significantly higher than that of the conventional light sheet. However, the
S9
P
RE
-P
R
O
OF RE
A
use of a diffractive grating can reduce the peak irradiance, e.g. by a factor of seven9. Even so, the peak irradiance remains higher than that of a conventional light sheet created by a cylindrical lens, respectively by a factor of 4.1, 2.7, 1.9, and 1.6 for the considered beam types. As the conventional light sheet, the Airy light sheet can be formed by a cylindrical lens. Instead of an increased peak irradiance due to scanning of the beam, the lateral intensity distribution of the Airy light sheet allows a peak irradiance reduction by approximately a factor of five with respect to the Gaussian light sheet, as already suggested by Supplementary Table S1.
It should be noted that the Airy light sheet could also benefit from various of the innovations of the Bessel beam super-resolution structured illumination approach. Albeit slower, more complex image restoration algorithms such as three-dimensional deconvolution and in particular iterative algorithms that allow a spatially variant point spread function could further improve the final image quality and reduce restoration artefacts near sharp edges in intensity. Furthermore, the peak intensity of the Airy light sheet illumination needed could be further reduced by a factor creating multiple parallel Airy beams, or even several orders of magnitude by using it in combination with a cylindrical lens. A detailed discussion is outside the scope of this paper.
S10
P
RE
-P
R
O
OF RE
A
Supplementary Note 2: Field-of-view as a function of the beam
parameters
In this note we determine the relationship between the field-of-view (FOV) and the pupil function parameters associated with different light sheet types. The FOV obtainable with the traditional apertured Gaussian light sheet,
F OVG, can be estimated from the axial extent of the diffraction-limited focal spot, which first intensity minimum
from the beam waist is found atx≈2λn/NA2. The FOV can thus be estimated as:
F OVG = 2x≈4
λn
NA2 (1)
≈40.532×1.4
0.422 µm = 17µm.
This inverse dependency on NA2 emphasizes the trade-off between axial resolution and the FOV of a light sheet microscope.
The field-of-view of the Bessel beam
In principle, the pupil function of the Bessel beam is an infinitesimally narrow annulus, and the associated intensity profile in the far field is propagation invariant over an infinite FOV. In practice the Bessel beam is often created using Durnin’s experimental setup6, which has a finite annulus width (β) to ensure sufficient light transmission. Practical
realizations of the Bessel beam remain propagation invariant over a relatively large, yet finite, distance. Note that a comparable restriction exists when employing an axicon to create the Bessel beam. The axicon produces an annular intensity distribution in the far field whereby the annulus width is determined by diffraction effects.
The Bessel beam propagates along thex-axis and its intensity profile can be written in the paraxial approximation as:
I(r;x)∝ |F {P (ur;d)}|
2
, (2)
wherer=py2+z2, u
r is the normalized radial pupil coordinate,F {·}denotes the Fourier transform, andP(ur;d)
is the pupil function incorporating defocus as a quadratic phase change with magnituded:
P(ur;d) =H(1−ur)H(ur−1 +β) exp(−2πidu2r), (3)
where H(·) denotes the Heaviside step function, and i is the imaginary unit. The amount of defocus, d, is specified in units of wavelength and is related to the distance,x, from the focal plane. When|x|is negligible compared to the focal length, the amount of defocus can be approximated as:
d=xn λ
1−p1−(NA/n)2≈ x λ
NA2
2n , (4)
wheren is the refractive index of the sample,λis the illumination wavelength, andNA is the numerical aperture of the illumination objective.
The phase difference ∆φ between the inner and outer edges of the annulus is proportional to the defocus,d, and also approximately proportional toβ forβ→0:
∆φ= 2πd(1−(1−β)2) = 2πdβ(2−β)≈4πdβ. (5) Destructive interference will occur at the Bessel beam core for ∆φ > π. We can estimate the extent of the FOV of the Bessel beam, F OVB, as the maximum range over which no destructive interference occurs by combining
equations (4) and (5): 4πxn
λ
1−p1−(NA/n)2β /π (6)
F OVB ≈
λ/n
21−p
1−(NA/n)2β
(7)
≈ 532/1.4
21−p
1−(0.42/1.4)2β
nm≈4.125µm β .
It is thus inversely proportional to the width of the annular aperture,β. The Bessel10 light sheet is thus expected to have an FOV of 41µm and that of Bessel5 will be twice that: 82µm.
S11
P
RE
-P
R
O
OF RE
A
The field-of-view of the Airy beam
It is well known that the core of the Airy beam is not stationary but rather lies on a parabolic curve21,22. An
alternative method is therefore used to study the relationship between the parameters of the Airy light sheet and the FOV.
Although alternative approaches have been proposed recently23,24, the Airy beam is typically produced via the
Fourier transform of a cubic phase modulation of the form 2πα(u3y+u3z). As for the Bessel beam, we can incorporate
the defocus in the pupil function of the Airy beam:
P(uy, uz;d) =H(1−ur) exp [2πiα(u3y+u
3
z)] exp(−2πidu
2
r). (8)
It is noted that the quadratic phase shift of the defocus can be eliminated with a change in origin in the pupil plane:
u0y=uy−d/3α (9)
αu3y−du2y=α(u0y+d/3α)3−d(u0y+d/3α)2 (10) =αu0y3+
α3(d/3α)2−2d2/3α u0y
+α(d/3α)3−d(d/3α)2 (11) and equivalently for theuz-axis. The last two terms cause a constant phase shift, and therefore have no influence on
the intensity distribution. The term
α3(d/3α)2−2d2/3α u0
y corresponds to a wavefront tilt, causing a shift of the
intensity distribution proportional to d2/3α. The quadratic dependence on the defocus parameter, d, is consistent with the well-known concept of accelerating Airy wave-packet propagation.
The far field diffraction pattern depends mainly on pupil values near the origin, (u0x, u0y)≡(0,0). Elsewhere, rapid changes in the pupil phase will cancel out due to destructive interference. Since the origin translates proportional to the defocus, d, the intensity profile of the Airy beam is expected to degrade when the stationary point is shifted outside the pupil edge. The FOV can thus be defined as the region in which the stationary point resides within the unity-radius pupil, i.e. ford <3α. Substitution of equation (4) results in the following expression for the FOV of the Airy light sheet:
F OVA= 2x=
6αλ/n
1− q
1−(NA/n)2
(12)
=α 6×0.532/1.4
1− q
1−(0.42/1.4)2
µm≈49µm×α
The FOV is thus proportional to the parameterα, and the experimental parametersα= 7 is expected to yield a FOV of 343µm. It should be stressed that due to the different approximations, no quantitative comparison of the FOV is possible using equations (7) and (12). However, our experiments confirm that the FOV obtainable with this Airy beam covers the FOV of the detector array, is considerable larger than that of the Bessel beams, and is more than an order of magnitude larger than that of the Gaussian light sheet.
S12
P
RE
-P
R
O
OF RE
A
Supplementary Note 3: Axial resolution as a function of the beam
parameters
Aided by digital deconvolution, diffraction-limited resolution can in principle be obtained for any type of light sheet and over an infinite FOV. However, the practically achievable resolution is not only determined by the NA of the light sheet but also by the signal-to-noise ratio (SNR) of the imaging process. As the MTF is proportional to the signal it provides valuable information about the practically achievable resolution. Here we use the MTF to study the practical resolution obtainable with Bessel and Airy light sheet microscopy.
The modulation transfer function (MTF) corresponding to an apertured Gaussian light sheet,M T FG(νz), is well
known and given by25:
M T FG(νz) =
2
π
arccos(νz)−νz
p
1−ν2
z
. (13)
Its MTF decreases monotonically and reaches a 5% threshold atνz= 0.88. The practical resolution of the apertured
Gaussian light sheet,rG, can thus be calculated as
rG=
λ
2·NA·νz
(14)
= λ
2·NA·0.88 =
532 nm
2·0.42·0.88 = 720 nm
Axial resolution achievable with the Bessel beam
The annulus of the Bessel beam pupil must have a finite width so that sufficient light is transmitted. We will show here that a sufficiently wide annulus is also required to guarantee an acceptable image contrast.
In the Fourier optics approximation, the MTF of the Bessel beam,M T FB(νz), can be calculated from the
autocor-relation of the pupil function. At the focal plane, the pupil function of the Bessel beam with unity intensity is given by
PB(ur) =
H(1−ur)H(ur−1 +β)
p
(2β−β2)π . (15)
For mid-range spatial frequenciesνz: β/2< νz<1−β, the MTF can be approximated using geometrical means as
M T FB(νz)≈
2
πβ(2−β)
β2
2νz
p
1−ν2
z
= β
νzπ
p
1−ν2
z(2−β)
. (16)
For most spatial frequencies the contrast provided by the Bessel beam light sheet is approximately proportional to the aperture annulus width, β, and decreases with spatial frequency. Unavoidably, the SNR will drop below a level that can be considered useful for experiments. The SNR is proportional to the MTF, yet it also depends on the characteristics of the measurement and the sample. It can be calculated that M T FB(νz) will drop below the 5%
threshold atνz= 0.36 andνz= 0.17 for the Bessel10 and the Bessel5 light sheet, respectively.
The practical resolution that can be obtained with these Bessel beam light sheets is thus:
rB=
532 nm 2·0.42·νz
= 1.759µm and 3.725µm, respectively.
A linear approximation in νz of the denominator in equation (16) permits the deduction of an approximate
rela-tionship between resolution (equation (15)) and the annulus width,β.
M T FB(νz)≈
β
(2−β)πνz
(17)
rB≈
λ
2NA
(2−β)π0.05
β (18)
≈ λπ0.05
NAβ ≈
By combining equations (7) and (18) it can be seen that the smallest resolvable detail is approximately proportional to the FOV of the Bessel beam light sheet:
rB ≈
F OVB
20.6 (19)
For optimal contrast and for resolution it is therefore important to ensure that the annulus width, β, is no smaller than that required for imaging a given FOV.
The axial resolution achievable with the Airy beam
The MTF of the Airy beam,M T FA(νz), can be determined via the autocorrelation of the normalized cubic phase
mask pupil,PA(uy, uz):
PA(uy, uz) =
H(1−ur)
√
π exp 2πiα(u 3
y+u
3
z)
. (20)
This integrand is highly oscillatory for large values ofαand can be calculated using the stationary phase approximation26, as
M T FA(νz) =
1
p
48|ανz|
, (21)
Note that forνz→0 andνz→1 the stationary phase approximation is not valid andM T FG(νz) is more accurate.
The MTF approximation decreases monotonically and it can be seen that the Airy light sheet will yield diffraction-limited resolution for values ofα <8.33. Large values ofαwould lead to a gradual reduction in resolution, albeit still with a more favorable trade-off compared to the Bessel beam light sheet. Moderate values ofαare however adequate. We verify numerically that for the value ofα= 7, which already permits more than an order of magnitude extension of the FOV, an axial resolution comparable to the diffraction limit is possible.
Both the axial resolution and the field-of-view depend upon the numerical aperture of the illumination objective and the light sheet type. In the previous subsections we analytically determined approximate relationships for the axial resolution. A more accurate estimate can be obtained numerically by calculating the vectorial point spread function for all beam types and integrating its intensity along they-axis. Fig. 2d shows the axial resolution as a function of numerical aperture (NA) for the four light sheet types considered here. It can be seen that for all types of light sheet, the smallest features can be resolved at the highest NA. Diffraction-limited resolution is achieved by the apertured Gaussian light sheet (grey dotted line). At the NA used in our experiments, 0.42, this corresponds to 726 nm. The Bessel light sheets employed, Bessel10 (solid blue line) and Bessel5 (red dashed line), can achieve potentially an axial resolution of 1.9µm and 3.9µm, respectively. Although the practical field-of-view of the Airy beam (solid green line) is larger than that of both Bessel beams, we find an axial resolution of 865 nm for the Airy light sheet, considerably below that of the Bessel light sheets.
S14