doi:10.4236/iim.2010.21006 Published Online January 2010 (http://www.scirp.org/journal/iim)
Adaptive Parallel Computation for Blind Source
Separation with Systolic Architecture
H. JEONG1, Y. KIM2, H. J. JANG3 1Department of EEE, POSTECH, Pohang, South Korea
2Digital media & Communication R&D Center, Samsung Electronics, Suwon, South Korea 3Department of Information Technology POSTECH, Pohang, South Korea
Email:{hjeong, ddda, hjj0501}@postech.ac.kr
Abstract
The purpose of Blind Source Separation (BSS) is to obtain separated sources from convolutive mixture in-puts. Among the various available BSS methods, Independent Component Analysis (ICA) is one of the rep-resentative methods. Its key idea is to repetitively update and calculate the measures. However, dealing with the measures obtained from multi-array sensors causes obstacles for real-time use. In order to solve this problem, it is necessary to convert the software implementation of BSS algorithm into the hardware archi-tecture. Through the use of hardware architecture, the BSS algorithm can efficiently work within a relatively short time. In this study, we investigate a practical method using a parallel algorithm and architecture for hardware use in a blind source separation. We design a feedback network for real-time speech signal proc-essing. The network is composed of forward and updates algorithms. The architecture of the network is sys-tolic and therefore it is suitable for parallel processing. We only have to add and connect modules for scaling. This paper covers the process from the systolic design of BSS to the hardware implementation using Xilinx FPGAs. The simulation results of our proposed implementation are also represented in the experimental sec-tion. In that section, our architecture returns satisfying results with robust qualities.
Keywords: BSS, convolutive mixtures, VLSI, field programmable gate array (FPGA)
1. Introduction
In the signal processing area, BSS is considered to be one of the fundamental problems. BSS assumes a Multi- Input-Multi-Output (MIMO) model. It is primarily based upon the principle that we can recover independent sources from mixture inputs. Among various forms of BSS, the simplest form is when mixtures are assumed to be linear instantaneous mixtures of sources [1]. In the 1980’s, Jutten and Herault [2] formalized the problem and there have been many models proposed to solve this problem [3–6].
From the many available models, this paper suggests the use of K. Torkkola’s feedback network [7–9] algo-rithm because it has the ability to deal with convolutive mixtures. For the learning algorithm, we propose T. No-mura’s extended Herault-Jutten method [10] algorithm.
By using these algorithms, the linear systolic architecture of an efficient BSS method can be designed and imple-mented in this paper. This architecture is composed of forward and updates processors. In the chip, we con-nected each processing element in a systolic manner. Therefore, we can easily scale up the architecture by adding more identical chips. Fabricated FPGA enables us to reduce the development period and verify the algo-rithms using hardware at a low cost, even though we can-not optimize the hardware implementation with FPGA when compared to Application-Specific-Integrated-Circuit (ASIC). Accordingly, we use a Very-High-speed-inte-grated-circuit-Hardware-Description-Language (VHDL) and fabricated FPGA in order to design the BSS chip.
ctions 4 and 5 show the simulation results and conclusion.
2. Backgrounds
This section provides an introduction to convolutive mixing model. Then, it focuses on K. Torkkola’s feed-back network algorithm and T. Nomura’s extended He-rault-Jutten method, which is implemented in software by Choi and Cichocki’s method [6,11].
2.1. Convolved Mixture Model
In a convolved mixture model in which a real speech signal is assumed, the acoustic environment imposes a different impulse response between each source and ar-ray sensor. Given N statistically independent speech sources s(t)=[s1(t), s2(t), . . . , sN(t)]T and M signals
measured at the array sensors x(t)=[x1(t), x2(t), . . . ,
xM(t)]T , the mixing model is represented as
, 0
(t) = n ( ) ( ), for i=1,2,...,m,.
i ij p j
p j
x h t s t p
(1)Here, {hij,p} is the room impulse response between the
jth source and the ith microphone and x
i(t) denotes the signal present at the ith microphone at time instant t. If we simplify the model to two mixture inputs of two in-dependent sources (M = 2, N = 2) in the Z domain, the model can be shown as
1 1 12 2 2 21 1 2
( ) ( ) ( ) ( ), ( ) ( ) ( ) ( ). X z S z H z S z X z H z S z S z
(2)
2.2. Feedback Network Algorithm
[7,12] suggests a feedback network algorithm as follows
, , 0
(t) = (t) L n ( ) ( ), for i, j=1,2,...,n,
i i i j p j
p j i
y x w t y t p
(3) where wij,p is the weight between yi(t) and yj(t − p). (4) is the abbreviated form of the output vector y(t).
0 1 0 1 ( ) ( ) ( ) ( ), ( ) { ( ) ( ) ( )}. L P p L P P y t x t W t y t pI W t x t W t y t p
(4)1 1 21 2 2 2 12 1
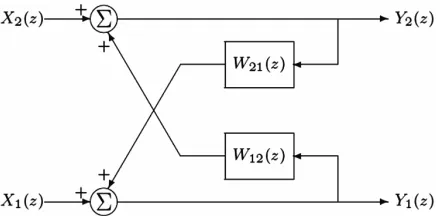
( ) ( ) ( ) ( ), ( ) ( ) ( ) ( ). Y z X z W z Y z Y z X z W z Y z
[image:2.595.315.535.79.187.2] (5)
Figure 1 and (5) represent (4) in the Z-domain. If the feedback network performs perfect separation (Y (z) = S(z)), then we can easily derive the weight from (2) and (5):
Figure 1. Feedback network for the separation of convolut-ively mixing sources
12 12 21 21
( ) ( ), ( ) ( ).
W z H z
W z H z
(6)
The existence of this solution requires H12(z) and
H21(z) to have stable inverses. If these are not fulfilled, the network is unable to achieve separation.
In [2], the Jutten-Herault algorithm suggested a
learn-ing algorithm of weight W for instantaneous mixtures.
[10] extended the Jutten-Herault algorithm and proposed the blind separation model, based upon the assumption that observable signals are convolutively mixed. The
learning algorithm updates W using the following form.
( ) ( 1) ( ( )) ( T( )),
P P t
W t W t f y t g y t p (7)
In (7), ηt is the learning rate, and f(.) and g(.) are odd symmetric functions. The update rule is based on the gradient descent method. It is easy to see that the corre-lation between f(yi(t)) and g(yj(t − p)) is removed when the learning algorithm achieves convergence. In this pa-per, we use the signum function as f(.) and the 1st order linear function as g(.) for easy hardware implementation.
2.3. The Modified Algorithm
By assuming that the speech signals are quasi-stationary, we can use the rth frame input xr(t) and the (r−1)th frame weight wr−1(t) in order to obtain the rth frame output yr(t). The rth frame weight wr(t) is also obtained from yr(t). With this logic, we can modify the forward and update process Equations (4) and (7) as follows
( ) ( ) ( 1) ( ) 0
1
( 1) ( ) ( 1)( ) ( ) 0
1
( ) ( ) ( ) ( )
( ) { ( ) ( )}
L
r r r r
p P
L
r r r t r
P P
y t x t W t y t p
I W t x t W y t p
(8)( )r ( ) (r 1)( 1) ( ( )r ( )) ( ( )r ( ))
P P t
Figure 2. Timing diagram of modified algorithm
Figure 2 represents a schematic diagram of the modi-fied algorithm.
3
.
Systolic Architecture for Feedback
Network
In this section, we will establish systolic architecture for the forward and update process. Each sub part contains overall architecture and internal architecture. The com-putational complexity is also analyzed in this section.
3.1. Systolic Architecture for Forward Processor
First, we will introduce the overall architecture of the forward process. This architecture is spatially efficient because it can accommodate more time delays with a
given limited space. The below is the cost of the forward processor fi,p(t) at time index t.
,0
, , 1 , ,0 ,
( ) 0,
( ) ( ) ( ( ) ( ))
for p=1,2,...,L. i
i p i p ij p j ij ji p i
f t
f t f t w y t p w w y t p
(10) We can combine (4) and (10) as follows.
1
1 12,0 21,0 1 12,0 2 1, 1
2 21,0 12,0 2 21,0 1 2,
( ) (1 ) { ( ) ( ) ( )},
( ) (1 ) { ( ) ( ) ( )}.
x L
x L
y t w w x t w t f t
y t w w x t w t f t
(11) Figure 3 is the systolic array architecture of the for-ward processor. This architecture calculates the PE cost with L + 1 processing elements. When p = 1, 2, ..., L, the
pth PE uses inputs y
1(t−p), y2(t−p), and fi,p−1(t) from (p−
1)th PE, and weights w
[image:3.595.195.401.575.700.2]12,p and w21,p in order to updates PE cost fi,p(t) by (10). At the end of the array p = L+1, y1(t) and y2(t) are calculated by using (11). This array is very scalable and can be easily implemented. This array al-lows us to considerably reduce computational complexity. Each PE consists of 2 adders, 2 registers, and 2 multipli-ers. The internal structure of the PE is represented in Figure 4.
Figure 3. Linear systolic array for forward processor
Figure 5. Linear systolic array for the update processor
Figure 6. The internal structure of update element
The forward process of the feedback network
algo-rithm consists of two linear arrays of (L + 1) PEs. 4L
buffers are required for output y(t) and the cost of PE
needs 2L buffers. Since each output y(t) is By bits long, a memory with O(LBy) bits is needed. In this manner, each
PE must store the partial cost of Bp bit and thus
addi-tional O(LBp) bits are needed. Therefore, we need the
total O(LBy + LBp) bits.
3.2. Systolic Architecture for the Update Processor
This part shows the architecture used for weighted up-dates. This architecture also consists of processing ele-ments with a similar operation. In the update processor,
we call the processing element Update Element (UE). If the number of outputs is two (n = 2), (7) can be written as
12, 12, 1 2 21, 21, 2 1
( ) ( 1) ( ( )) ( ),
( ) ( 1) ( ( )) ( ).
P P t
P P t
w t w t f y t y t p
w t w t f y t y t p
(12)
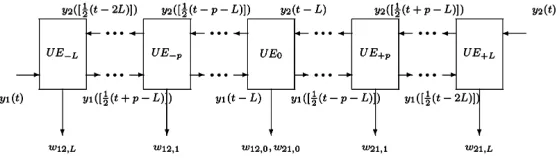
Figure 5 shows the systolic array for the update
proc-essor. In the figure, 2L + 1 UEs are connected in series
when the number of PE is L. We also define the forward
process clock and the update process clock as CLKf and
CLKu = 2*CLKf respectively. The even UEs are only active at even times. Similarly, the odd UEs are only active at odd times. The UE equation can be represented as
1 2
2 1
( ) ( 1) ( [1/ 2( )])) [1/ 2( )]), ( ) ( 1) ( [1/ 2( )])) [1/ 2( )]).
P P t
P P t
t t y t p L y t p L
t t y t p L y t p L
(13)
Here, [x] denotes the maximum integer which is not over x.
If the number of PE is L, the architecture of the update
consists of 2L + 1 UEs shown in Figure 5. We denote the
forward process clock as CLKf , and the update clock is
CLKu = 2*CLKf . At even times, only even UEs are acti- ve and the odd UEs are inactive. At odd times, the UE play the roles in a reversed way. The UE equation has the form
1 2
2 1
( ) ( 1) ( [1/ 2( )])) [1/ 2( )]), ( ) ( 1) ( [1/ 2( )])) [1/ 2( )]).
P P t
P P t
t t y t p L y t p L
t t y t p L y t p L
(14)
where [x] is the maximum integer which is not over x.
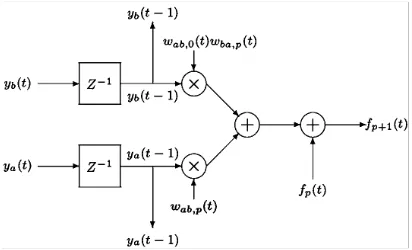
Figure 6 is the internal structure for the UE. The Pth UE receives two inputs y1(t) and y2(t), and returns the
up-Figure 6 shows the internal structure of the UE of the
feedback network. The pth UE receives tw
dated UE cost up(t) as a final result. In the figure, f() is the signum function, f(y1(t)) = sign(y1(t)).
o inputs y (t)
an
sig-feedback network algorithm uses a linear array of (2L +
1) UEs. The output y(t) and the cost of UE need 4L + 2
and 2L + 1 buffers respectively. If UE stores the partial cost of Bu bits, the total O(LBy + LBw) bits are sufficient.
[image:5.595.307.554.75.321.2]3.3. Overall Architecture
Figure 7 and Table 1 represent the whole feedback that there are two mixture puts from two independent sources. The goal of the
esigned the system for implementa-(Xilinx Virtex-II XC2V8000). The evice utilization can be seen in Table 3. We fully tested work architecture. We assume
in
architecture is to reduce the correlation between the in-puts as much as possible. In 3.3, we represent the overall feedback network algorithm. The system consists of Ini-tialization, Forward process, Update process, and Wei- ghts update. The initialization step is for setting the state suitable for the beginning of the system. At this step, all of the weights and costs of processing elements are set to zero. Through the forward process step and the update process step, all of the weights are calculated and re-loaded recursively for the separation.
4. Experiments
Using VHDL, we d tion with an FPGA d
[image:5.595.310.538.382.609.2]the chip with and without noise. In this section, we tested our method based upon a VHDL simulation. We also tes- ted the chip by extensively using ModelSim simulation
Figure 7. Overall block diagram of feedback network ar-chitecture
Figure 9. Two mixtures of speech signals
F
workigure 10. Two recovered signals using the feedback
net-Table 1. Algorithm overall of recurrent network architec-ture
(1) Initialization for
t=0 All the weights are initialized as zeros : The cost of processing elements are initialized as Wp=0 zeros : f1,p=0, f2,p=0
(2) Forward process for
T=1, For p=1,2,…,L:
2.,,,,N-1 ff1,p= f1,p-1+(w12,py2(t-p)+ w12,0 w21,py1(t-p))
2,p= f2,p-1+(w21,py1(t-p)+ w21,0 w12,py2(t-p))
y1(t)=(1- w12,0 w21,0)-1 {x1(t)+ w12,0 x2(t)+f1,L }
y2(t)=(1- w -1 + w21,0 x1(t)+f2,L }
For p=L:
21,0 w12,0) {x2(t)
(3) Update process for
T=N, N+1,…,
3N-1
2
u (t)= u ) y2([1/2(t+p-L)])
If t=even, then for p=even :
up(t)= up(t-1)-ηtφ(y1([1/2(t-p-L)])) y ([1/2(t+p-L)])
else t=odd, then for p=odd : (t-1)-η φ(y1([1/2(t-p-L)])
p p t
(4) W ights updat e e f
t=3N 12,0 21,0 0
…,L : w21,p=up(t)
or For p=-L,…,-2,-1 : w12,p=u-p(t)
or p=0 : w = w =u (t) F
For p=1,2,
Table 2. The experim NRI with noisy
mix-tu
ental results of S res
SNRI1(dB) SNRI2(dB)
Clean 2.7061 4.9678 10dB 2.6225 4.9605 5dB 2.4396 4.7541 0dB 2.3694 4.6506 -5dB 1.9594 3.9757 SNR
(signal to ratio) = 10log10(s/n)
-10dB 0.1486 3.2470
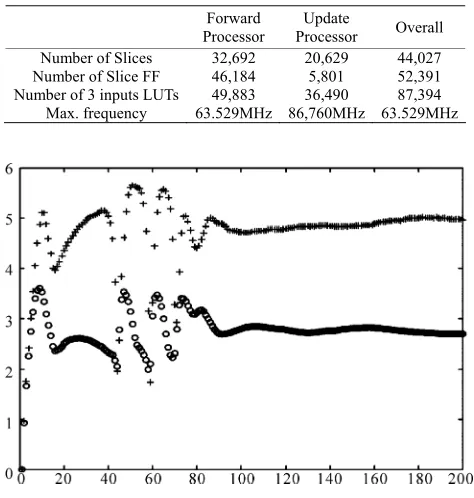
[image:5.595.57.288.444.555.2] [image:5.595.57.291.603.705.2] [image:5.595.318.535.653.720.2]T su tput implementa-tion (L=40)
Forward Processor
Update
Processor Overall
able 3. Re lts from two-inputs two-ou
Number of Slices 32,692 20,629 44,027 Number of Slice FF 46,184 5,801 52,391 Number of 3 inputs LUTs 49,883 36,490 87,394 Max. frequency 63.529MHz 86,760MHz 63.529MHz
Figure 11. The convergence of SNRI (‘o’: SNRI1, ‘+’: SNRI2)
tools. It is designed to interface with the PLX9656 PCI chip. For the parametric setup, we fixed L = 100 and ηt =
10−7. As a performance measure, we used a signal to
noise ratio improvement by Choi and Cichocki [11], as
2
10 2
{( ( ) ( )) }
10log
{( ( ) ( )) }
i i
i
i i
E x k s k SNRI
E y k s k
(15)
Figure 8 shows two different sampled speech signals,
the mixture records of s(t) and the recovered
y(t) and are shown in Figure 9 and 10
respec-vely. In this test, the experiment results are SNR
Figure 11 is the graph showing the convergence learning for the feedback network. In the f
tem seems to converge at r 100.
us hardware and
soft-are implementation differ significantly it will be diffi-le, to migrate software implementa-ons directly to hardware implementatiimplementa-ons. The
hard-ignals,” in ICNN, 1997.
“Blind separation of source, part based on neuromimetic archi-tecture,” Signal Processing, Vol. 24, pp. 1–10, 1991.
ng, Vol. 11, No. 3, pp. 204–215, 2003.
Malay Gupta, Hiroshi Sawada, and Shoji tio-Temporal FastICA Algorithms for the Blind Separation of Convolutive Mixtures,” IEEE
Trans-”, MLSP
which were used for this simulation. The received signals
x(t) are signals
ti I =1
2.7061, SNRI2 = 4.9678.
We have also tested the performance of our method in noisy environments. In Table 2, the system shows a ro-bust performance even in high SNR (above 0dB only
actions Audio, Speech and Language Processing, Vol. 15, No. 5, pp. 204–215, 2007.
). of
EURASIP Journal on Applied Signal Processing, pp. 1260–1277, 2007.
[6] M. Ounas, S. Chitroub, R. Touhami, M. C. E. Yagoub, “Digital circuit design of ICA based implementation of FPGA for real time Blind Signal Separation
igure, our
sys-
5. Conclusions
In this paper, the systolic algorithm and architecture of a feedback network have been derived and tested with VHDL code simulation. This scheme is fast and reliable since the architectures are highly regular. In addition, the processing can be done in real time. The full scale
sys-tem can be easily obtained by the number of PEs, and UEs. Our system has two inputs but we will extend it for N inputs.
Because the algorithms ed for w
cult, if not impossib ti
ware needs different algorithms for the same application in terms of performance and quality. We have presented a fast and efficient VLSI architecture and implementation of BSS. The architecture has the form of a linear systolic array using simple PEs that are connected with only neighboring PEs and thus can be easily scalable with more identical chips.
6. Acknowledgement
This work has been supported by Brain Korea 21 project and Ministry of Knowledge Economy under Human Re-sources Development Program for Convergence Robot Specialists.
7. References
[1] T. Lee, A. Bell, and R. Orglmeister, “Blind source separa-tion of real world s
[2] C. Jutten and J. Herault, I: An adaptive algorithm
[3] F. Asano, S. Ikeda, M. Ogawa, and H. Asoh, and N. Ki-tawaki, “Combined Approach of Array Processing and Independent Component Analysis for Blind Separation of Acoustic Signals,” IEEE Transactions Speech and Audio Processi
[4] S. C. Douglas, Makino, “Spa
[5] R. Aichner, H. Buchner, F. Yan and W. Kellermann, “A real-time blind source separation scheme and its applica-tion to reverberant and noisy acoustic environments,”
2008. IEEE Workshop on, October 2008.
[7] K. Torkkola, “Blind separation of convolved sources based on information maximization,” Proceedings IEEE Workshop Neural Networks for Signal Processing, pp. 423–432, 1996.
[image:6.595.54.291.105.354.2]et?” IEEE Workshop on Independent
Jutten Network
y problem,” in Proeeding In-[9] K. Torkkola, “Blind Source Separation for Audio
Sig-nal-Are we there y
Component Analysis and Blind Signal Separation, Aus-sois, France, January 1999.
[10] T. Nomura, M. Eguchi, H. Niwamoto, H. Kokubo and M. Miyamoto, “An Extension of The
Herault-to Signals Including Delays for Blind Separation,” IEEE Neurals Networks for Signal Processing, VI, pp. 443–452, 1996.
[11] S. Choi and A. Cichocki, “Adaptive blind separation of speech signals:Cocktail part
ternational Conference Speech Processing (ICSP’97), pp. 617–622, August 1997.