warwick.ac.uk/lib-publications
Manuscript version: Author’s Accepted Manuscript
The version presented in WRAP is the author’s accepted manuscript and may differ from the
published version or Version of Record.
Persistent WRAP URL:
http://wrap.warwick.ac.uk/101227
How to cite:
Please refer to published version for the most recent bibliographic citation information.
If a published version is known of, the repository item page linked to above, will contain
details on accessing it.
Copyright and reuse:
The Warwick Research Archive Portal (WRAP) makes this work by researchers of the
University of Warwick available open access under the following conditions.
Copyright © and all moral rights to the version of the paper presented here belong to the
individual author(s) and/or other copyright owners. To the extent reasonable and
practicable the material made available in WRAP has been checked for eligibility before
being made available.
Copies of full items can be used for personal research or study, educational, or not-for-profit
purposes without prior permission or charge. Provided that the authors, title and full
bibliographic details are credited, a hyperlink and/or URL is given for the original metadata
page and the content is not changed in any way.
Publisher’s statement:
Please refer to the repository item page, publisher’s statement section, for further
information.
The effect of time-between-events for sequence
interaction testing of a real-time system
Chek Pin Yang, Gunwant Dhadyalla, James Marco, Paul Jennings
WMG, The University of Warwick,Coventry, UK, CV4 7AL
Abstract—Automotive electronic control systems are expected to respond to input demands in real-time (circa: milliseconds) to ensure occupant and road user safety and comfort. System complexity and real-time computing requirements create significant challenges in proving the robustness of control systems; here robustness is the degree to which a system can function correctly in the presence of unexpected inputs. Evidence shows that faults still escape to customers incurring large warranty costs. Existing test methods can be ineffective in testing robustness with the primary focus being on requirements validation. Evidence from other industries such as IT and medical suggests faults that are difficult to find, manifest due to complex interactions and sequences of events. Whilst model based approaches are becoming more prevalent, they are still an abstraction of the real world and deal with ‘time’ at this conceptual level. This can leave some doubt on their validity for representing real-time testing. However, there is little evidence within the literature pointing to effective sequence interaction testing (SIT) within real-time test environments. The novelty of the proposed approach is a methodology for creating and running t-way input sequence interaction test suites in real-time with the real-time between input events (TBE) considered as a critical test parameter. The effect of TBE on the triggering of faults for a safety monitoring system deployed in a prototype embedded electric machine control unit is presented to demonstrate the approach. The system is tested with 2688 3-way event sequence interaction tests across a TBE range from 1 millisecond to 500 milliseconds validating the effectiveness of the approach in eliciting faults.
Keywords—Real-time testing, sequence interaction, time-between-events, robustness, hardware-in-the-loop, test optimization
I. INTRODUCTION
The continued growth in the use of electronics and software in vehicles has been predicted, where some premium vehicle have claimed to host up to 70 Electronic Control Units (ECUs), independent computing platforms, linked together by directly wired signals and communications networks. Vehicle control and customer features are delivered through 100 million lines of software code distributed between these ECUs [1, 2]. This creates a major opportunity for financial costs associated with failures including recall actions [3] and warranty returns [4]. According to the 2014 J.D. Power vehicle dependability study, customer retention for vehicle manufacturers drops from 56% to 43% if owners experience three or more problems [5].
Failures in automotive software: The natural reluctance of vehicle manufacturers to disclose failure information means that
detailed failure data are not available in the public domain. Nevertheless there is sufficient information to suggest that automotive electronics, both software and hardware, still fail. Analysis of data from the Vehicle Safety Branch of the UK Government’s Vehicle and Operator Services Agency revealed that a total of 561,860 vehicles were involved in 114 recall actions in the ten year period between January 2003 and January 2013 of which 66% were software related faults [3]. The prolific media coverage related to the case of sudden unintended acceleration of Toyota vehicles suggests that the results of investigations published by [6, 7] may not provide consistent evidence of the true root causes. This has led to questions regarding the possibility of complex electronic software or system interaction issues, termed Mandelbugs, existing; a Mandelbug being “a fault whose activation and/or error propagation are complex” [8]. These types of failure are directly related to the robustness of the system, where robustness is defined as “the degree to which a component or system can function correctly in the presence of invalid inputs or stressful environmental conditions” [9].
Interactions: The authors propose that unintended interaction effects at the input can be classed as invalid inputs. Although one can argue that unintended interactions are valid inputs as they can be possible in operation, they are not considered systematically in system design as the premise is generally only single input cases or known input sequences.
Real-time systems: Real-time systems are generally classified as hard real-time and soft real-time. Hard real-time systems have to adhere to strict timing requirements, down to an accuracy of 1 millisecond (ms) or less and are often safety critical. This is important to meet the operational aspects and response times of the environment they exist in [14, 15]. Effective test methods are needed to test the robustness of real-time embedded control systems based on the evidence of failures escaping to customers.
The paper is organized as follows. The Research Objective and related research question is defined, followed by a summary of Related Work. The Definitions section defines specific terms related to events and sequence interactions. The Methodology section describes the experimental setup and the steps from defining inputs to creating and implementing sequence interaction test suites. The Results and Discussion sections follow and a Conclusion section summarizes the results and their outcomes as well as the key contributions and proposed future research.
II. RESEARCH OBJECTIVE
As described in previous sections, there is evidence in literature to suggest event interactions cause faults. The objective of the research is therefore not to prove this. However the research takes the state of existing work on sequence interaction testing (SIT), and extends it to investigate the effect of time separation between events in elicitation of faults on embedded controller systems in real-time.
The following research question is proposed: How does the time between input events affect the elicitation faults in a real-time embedded system?
This leads to two objectives of the research:
(1) The proposal of a general approach to develop SIT test suites with TBE as a key parameter.
(2) Through a case study, demonstrate the effect of TBE on the total number of fault instances and the cross-coupling behavior between the input events for a given set of SIT.
The novelty of the proposed approach is the methodology for creating and running t-way input sequence interaction test suites in real-time with the TBE considered as a critical test parameter. The effectiveness of the approach is determined by evidence that the violation of a given system property (requirement) is due to the interactions of events in a sequence and not due to any single event effect. The methodology is validated by application to the safety monitoring system of a prototype automotive electric machine ECU in real-time operating down to a 1ms resolution. The ECU is integrated in to a real-time HIL experimental setup as described in section A.
III. RELATED WORK
A. Combinatorial interaction testing and sequence covering arrays
Combinatorial interaction testing is based on the seminal works of C.R.Rao who developed combinatorial concepts using orthogonal arrays based on Latin Squares [16]. Subsequent influential work led by Cohen et al. [10, 17] on combinatorial testing has been a catalyst in creating further research in this area with researchers such as Chee et al. [18] and Kuhn et al. [19] developing approaches to generate Sequence Covering Arrays (SCA). A SCA is an optimized array of event sequences for a given number of possible events that could occur for an event based system.
SCAs intend to optimize the number of test cases generated while giving full input coverage for the number of grouped events [19].An example of a 7-event sequence covering array for 3-way sequences from [19] is shown in Table 1 where all possible 3-way sequences are covered in only 12 tests.
TABLE 1:SEVEN-EVENT TEST SET FOR 3-WAY SEQUENCES
Research in approaches to generate SCAs focus on optimizing the number of test cases generated to ensure that each t-way sequence, where ‘t’ is the number of events for which the sequences are being tested, is achieved [19-24]. Related work carried out by Farchi et al. on the order of events within a sequence raise the challenge of managing the order of execution of events through conditional selection of possible events based on what the selected order for a given test is [25]. Farchi et al. use this as a constraint to manage the test space. Similarly Erdem et al. and Brain et al. challenge Kuhn et al.’s approach in not considering the challenge of implementing SCAs and the issue of ordering the inputs to constrain possible input sequences [26, 27]. The authors deal with the removal of illegitimate sequences and the problem of then having to consider how other sequences in the same test would have to be reconsidered. More abstract treatment of the subject relates to optimizing the bounds of the size of covering arrays (lower and upper) such as [28].
However, one of the biggest drawbacks of the SCA approach is that it doesn’t guarantee consecutiveness of those ‘t’ events as each may be separated by other events which are not part of the
Test
1 0 1 2 3 4 5 6
2 6 5 4 3 2 1 0
3 2 1 0 6 5 4 3
4 3 4 5 6 0 1 2
5 4 1 6 0 3 2 5
6 5 2 3 0 6 1 4
7 0 6 4 5 2 1 3
8 3 1 2 5 4 6 0
9 6 2 5 0 3 4 1
10 1 4 3 0 5 2 6
11 2 0 3 4 6 1 5
12 3 1 6 4 3 0 2
sequence of events being investigated. In real-time systems, especially those where the implementation of the requirements in software is not necessarily known by the system integrator or the system tester, in essence a black-box, such interactions can exist and therefore warrant consideration when building test suites.
B. Sequence testing for real-time systems
The treatment of SCAs to test actual software systems is considered by Rahman et al. who propose an approach to optimize the selection of sequence coverage and tests on a real application called Embedded Network Traffic Monitoring System [29]. This can at best be classed as a soft-real time system not demanding the level of rigor a vehicle control system may demand. Petke et al. compare the effectiveness of combinatorial interaction test suites generated by simulated annealing and greedy algorithms on a set of real software programs written in C but not for real-time systems as defined above [30]. Becci et al. proposed a robustness test methodology for input sequence variation for an automotive control systems as part of a hardware-in-the-loop (HIL) test extending the SCA approach [31]. This paper considers the use of TBEs but there is little evidence showing the effect of TBE on the extraction of faults. The paper also considers SCA ‘as-is’ without addressing the need for the consecutiveness of events.
There is generally a lack of research investigating the effects of interactions between inputs for real-time control systems in a pragmatic and systematic manner.
C. Definitions
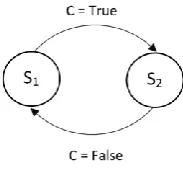
Events: An event is normally treated as the change in the state of an input that would cause the output state of the system to change. In its simplest form, referring to Fig. 1, the transition from state S1 to state S2 occurs if condition C is true, where C
[image:4.595.308.561.52.209.2]can be triggered by an input event.
Figure 1: Events and states
Time between events (TBE): The time between two events X and Y is defined as the time between event X reaching its final state, and event Y reaching its final state. In the example in Fig. 2, the time between Event 1 and Event 2 is TBE1 and the
[image:4.595.117.209.499.585.2]time between Event 2 and Event 3 is TBE2.
Figure 2: Events, sequences and time between events
Sequence of events: A sequence of t-way events, Sn is a
series of events that occur from event 1 to t with each event separated by a TBE defined for two subsequent events. The sequence always starts with a reset time, tRes which is sufficient
to allow the system to return to a stable initial state for subsequent SITs.
The example in Fig. 2 illustrates two 3-way event sequences, S1 and S2. For S1 Event 2 occurs at exactly TBE1
after Event 1 occurs and Event 3 occurs exactly TBE2 after
Event 2 occurs. Similarly for S2, Event 5 occurs exactly TBE3
after Event 4 occurs and Event 6 occurs exactly TBE4 after
Event 5 occurs.
IV. METHODOLOGY
The following section describes the methodology designed specifically for creating and implementing SIT test cases with the integration of the TBE parameter. Each event must be tested independently to ensure that it does not trigger the violation of a system property. The description of the electric machine control system test setup is provided and is used through the following steps to describe the application of the test methodology. Step 1 defines the inputs and events. Step 2 calculates all 3-way permutations of events. Step 3 creates the sequence test suite. Step 4 creates the real-time test cases ready to run. Finally step 5 runs and evaluates the tests against the properties.
A. Experimental Setup
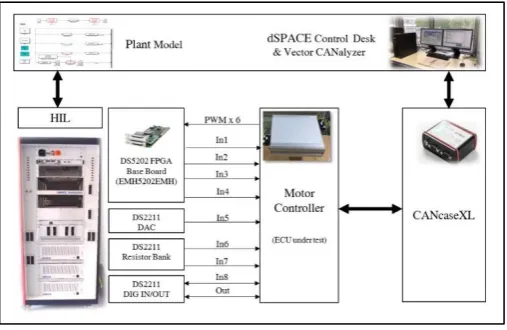
A dSPACE® HIL system is used to conduct the real-time testing of the ECU. The ECU inputs and outputs (I/O) are mapped to the I/O channels on the dSPACE® HIL rig including digital, analog and vehicle communication network connections. Sensors such as thermistors are modelled using a resistor bank and high speed signals such as the Pulse Width Modulated (PWM) signals and resolver signals are mapped through a specialized DS5202 FPGA Base Board to meet the speed and accuracy requirements.
[image:5.595.38.292.238.403.2]The ECU is connected to a Vector CANalyzer through the CANcaseXL hardware interface in order to manage the initialization and reset commands required for the experiments over the Controller Area Network (CAN) bus. The complete experimental setup is shown in Fig. 3.
Figure 3: Experimental setup
B. Step 1: Input and event definition
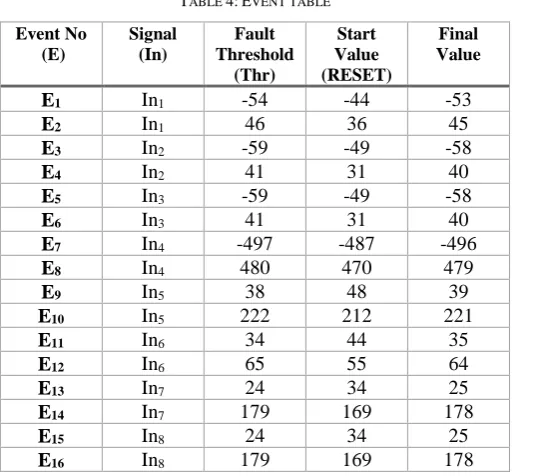
Each time one of the properties defined below is violated, a fault occurs and is recorded. The fault indication output signal (FAULT_OUT) is a hard wired common collector logic-type channel and is the only measured output signal. Input signals are evaluated against defined safety threshold values (Table 4). If an input signal goes beyond its respective threshold, the ECU must detect it and trigger the FAULT_OUT output pulling it LOW. This in turn must halt the ECU operation and disable the PWM outputs to make the system safe. The output states indicate the following:
FAULT_OUT = LOW, fault triggered
FAULT_OUT = HIGH, no fault
The property being investigated for the application is defined in terms of the FAULT_OUT output signal. FAULT_OUT = LOW if any input signal (Table 3), Inx, crosses
a defined threshold, Thrx, set for each input Inx (Table 4). The
ECU has 8 inputs and each input has two threshold values, a lower threshold and a higher threshold. Inputs In1 to In4 can be
positive or negative hence an individual threshold value is
defined for each polarity. Input In5 to In8 are always positive
and have a low threshold and a high threshold.
Properties being verified
if |Inx| ≥ |Thrx| then FAULT_OUT = LOW, for 1 ≤ x ≤ 4
if |Inx| ≤ |Thrx| then FAULT_OUT = HIGH, for 1 ≤ x ≤ 4
if Inx ≥ Thrx then FAULT_OUT = LOW, for 5 ≤ x ≤ 8 (High Thr.)
if Inx ≤ Thrx then FAULT_OUT = HIGH, for 5 ≤ x ≤ 8 (High Thr.)
if Inx ≤ Thrx then FAULT_OUT = LOW, for 5 ≤ x ≤ 8 (Low Thr.)
if Inx ≥ Thrx then FAULT_OUT = HIGH, for 5 ≤ x ≤ 8 (Low Thr.)
TABLE 3:INPUT SIGNALS
Input Signal Signal Name Signal Units
In1 AC current 1 A
In2 AC current 2 A
In3 AC current 3 A
In4 DC current A
In5 DC voltage V
In6 Temperature 1 °C
In7 Temperature 2 °C
In8 Temperature 3 °C
An event, En, where n is the nth event, occurs when an input
changes state as described previously. However, if the input values change and don’t exceed the threshold then FAULT_OUT must not be triggered.
At the beginning of each test sequence, FAULT_OUT is set to HIGH by ensuring all the input signals are well within their respective thresholds. The start values, which are the values set for each input when the system is reset at the beginning of a sequence test, and the final values are shown in the Table 4. The final values are selected to be within but close to the threshold.
C. Step 2: Calculation of all 3-way permutations of events
The standard combinatorial formula is given by equation (1)
(
𝑛
𝑘
) =
𝑛!𝑘!(𝑛−𝑘)!
(1) [image:5.595.307.561.275.388.2]
permutations per combination possible, the total number of 3-way sequences generated is 2688 for the 16 events defined in the experiments presented.
TABLE 4:EVENT TABLE
Event No (E)
Signal (In)
Fault Threshold
(Thr)
Start Value (RESET)
Final Value
E1 In1 -54 -44 -53
E2 In1 46 36 45
E3 In2 -59 -49 -58
E4 In2 41 31 40
E5 In3 -59 -49 -58
E6 In3 41 31 40
E7 In4 -497 -487 -496
E8 In4 480 470 479
E9 In5 38 48 39
E10 In5 222 212 221
E11 In6 34 44 35
E12 In6 65 55 64
E13 In7 24 34 25
E14 In7 179 169 178
E15 In8 24 34 25
E16 In8 179 169 178
D. Step 3: Creation of sequence interaction test suite
Kuhn et al [11] suggest that 50 - 97 percent of software faults could be identified by two ways interaction testing. Further evidence in the same study suggests that 3-way interaction testing could account for more than 90 percent of bugs. In order to ensure a higher possibility of detecting faults, 3-way interaction testing was selected for this study.
The sequence test matrix is created based on all the possible permutations for the 16 events defined in Table 4 and the consideration of constraints. A sample of the complete sequence test matrix is presented in Table 5. Event occurrences are shown in two consecutively dark shaded cells. For each sequence three events occur representing the 3-way SIT before the inputs are reset for the next SIT.
An additional constraint is applied to the occurrence of events to ensure that for each 3-way event sequence, the same event does not occur more than once as this would need the signal to be reset within a sequence.
E. Step 4: Create real-time test cases
Automated testing is usually performed by executing tests on a standard PC connected to the HIL system. However, this method cannot cope when greater timing precision is required e.g. if ECU interaction has to be captured and responded to with a 1ms resolution and accuracy due to the non-deterministic nature of operating systems. The dSPACE® real-time testing
solution [32] allows test suites to run on the real-time processor board of the HIL system synchronously with the plant model (model of the system being controlled) to allow all tests to run in real-time enabling the 1ms resolution and precision in controlling the TBE and tres values.
TABLE 5:TEST MATRIX SHOWING ONLY THE FIRST 6 SEQUENCES
The effect of varying TBE on the triggering of faults is the key element of the research. TBE values are selected from very small time values (1ms) to relatively large values (500ms) which cover typical timings in a real-time embedded system. Most real-time embedded systems run at 1ms clock cycles but may sample inputs from any range between 1ms and 500ms depending on the real-time operational requirements. Table 6 defines the TBE values tested for each experiment.
TABLE 6: TBE PARAMETER VALUES AGAINST EXPERIMENT (EXPT.)
The reset time is fixed at tres = 10ms for all experiments.
The FAULT_OUT output and all the inputs are logged at 1ms intervals and the measured FAULT_OUT values are compared with expected values to identify violation of the property. Allowing for a reset between sequences, a total of 10752 (2688 x 4) individual events (test cases) are created and run using an automated Python test script.
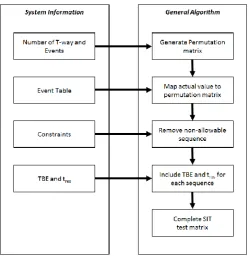
Fig. 4 shows the ‘General Algorithm’ for SIT test suite creation which is fed by the ‘System Information’ which includes parameters required for the test suite generation.
Experiment 1 2 3 4 5 6 7 8 9 10
[image:6.595.35.307.104.342.2]Figure 4: General algorithm for SIT test suite creation
V. RESULTS
[image:7.595.50.275.466.633.2]Prior to running the SITs, each individual event was tested independently to ensure that it did not violate the properties above. This is the single input event case. The assumption therefore is that if a property is violated during the SIT then it must be due to a sequence interaction effect and not due to an individual event. The results presented in this section relate to the total number of faults triggered by unique SITs against the TBE.
Figure 5: Effect of TBE on total faults triggered (log scale)
Fig. 5 shows the effects of TBE on the total faults triggered. It is observed that there is a significant increase in the number of faults as the TBE increases from 1ms to 20ms. The maximum number of faults occurs when TBE is approximately
20ms, assuming the lack of further data points to suggest the absolute peak. With TBE between 20ms and 500ms the reduction in faults triggered is significant but much more gradually than the increase given the logarithmic scale of the graph.
Other interesting observations are related to the number of faults triggered at TBE values of 5, 6, 8 and 9ms respectively. If the data points are extrapolated from 4ms to 10ms then a steady increasing trend in faults triggered would be evident. However, the number of faults for these values of TBE decreases suggesting that the hardware and software configuration of the system is less prone to interaction effects for these TBE values, although faults are still triggered.
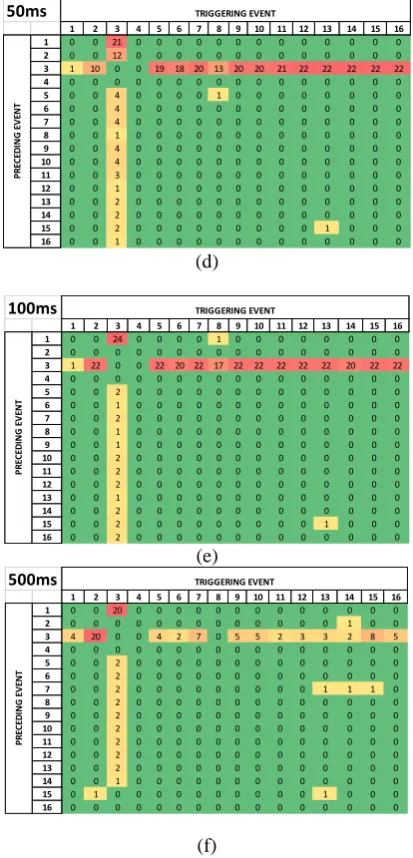
In order to evaluate the relationship between event interactions on the triggering of faults, interaction matrices are presented for different values of TBE. The matrices in Fig. 7(a) - (f) identify the occurrence of faults when two events interact. The columns represent the events which trigger the fault and the rows represent the preceding event prior to the fault being triggered. The top left corner shows the TBE value and the cumulative count of the fault being triggered is shown in each of the individual cells of the matrices.
From TBE of 1ms to 20ms, the fault is triggered by Event 3 more frequently than any other event as can be seen in Fig. 6 and Fig. 7(a) – 7(c). The total fault count increases with the same profile as the total sequence faults as can be seen in Fig. 6. The results in Fig. 7(a) - 7(c) highlighted that the faults caused by Event 3 were influenced by all other preceding events. Further analysis is needed to understand which preceding events have the most significant interaction effect, however superficial observations suggest that Event 5 and 7 have more influence than other events at lower TBE values and Event 1 has major influence at higher TBE values. Note that Event 4 is created by the same input as Event 3 and therefore mutually exclusive in terms of interactions.
Figure 6: Effect of Event 3 on total faults triggered (log scale)
[image:7.595.322.539.504.668.2]preceding event reached a peak of 241. Although Event 3 has a weak interaction effect on triggering faults caused by other events at lower TBEs, this changes as the TBE increases from 20ms to 500ms. Between these values the faults triggered by Event 3 drops significantly (Fig. 6). However the number of faults triggered by other events with Event 3 as the preceding event increases noticeably as can be seen in Fig. 6 and Fig. 7(d) – 7(f). Fig. 7(d) – 7(f) provide some indication on the most likely event that will trigger a fault after Event 3 has occurred but without any clear distinction between triggering events. The total number of faults triggered with Event 3 as the preceding event peaks at 278 at a TBE of 100ms before decreasing as TBE approaches 500ms.
[image:8.595.329.536.55.485.2](a) . (b) (c) (d) (e) (f)
Figure 7: Event Interaction effects
VI. DISCUSSION
In the results section, the key observations are presented. More subtle observations exist in the data which can warrant a second level of detailed interaction analysis. For example at higher TBEs Event 3 has less interaction effect on Event 1 and to some extend Event 8. Event 15 always precedes Event 13 to trigger one fault independent of the TBE and could be an outlier. At higher TBEs, in particular 500ms (Fig. 7(f)), there seems to be a strong influence of Event 3 and Event 2 where this influence diminishes with other events.
From the results there is clear evidence of interaction effects between input events triggering faults for the ECU under test. Although it is not the subject of this particular research, some system analysis and potential causes for fault triggering are presented.
1ms
1 2 3 4 5 6 7 8 9 10 11 12 13 14 15 16 1 0 0 18 0 0 0 0 0 0 0 0 0 0 0 0 0
2 0 0 14 0 0 0 0 0 0 0 0 0 0 0 0 0
3 0 0 0 0 0 0 0 0 0 0 0 0 1 0 0 0
4 0 0 0 0 0 0 0 0 0 0 0 0 0 0 0 0
5 0 0 11 0 0 0 0 0 0 0 0 0 0 0 0 0
6 0 0 9 0 0 0 0 0 0 0 0 0 0 0 0 0
7 0 0 13 0 0 0 0 0 0 0 0 0 0 0 0 0
8 0 0 1 0 0 0 0 0 0 0 0 0 0 0 0 0
9 0 0 10 0 0 0 0 0 0 0 0 0 0 0 0 0
10 0 0 11 0 0 0 0 0 0 0 0 0 0 0 0 0
11 0 0 14 0 0 0 0 0 0 0 0 0 0 0 0 0
12 0 0 1 0 0 0 0 0 0 0 0 0 0 0 0 0
13 0 0 10 0 0 0 0 0 0 0 0 0 0 0 0 0
14 0 0 8 0 0 0 0 0 0 0 0 0 0 0 0 0
15 0 0 14 0 0 0 0 0 0 0 0 0 1 0 0 0
16 0 0 6 0 0 0 0 0 0 0 0 0 0 0 0 0
TRIGGERING EVENT PR EC ED IN G E V EN T 10ms
1 2 3 4 5 6 7 8 9 10 11 12 13 14 15 16 1 0 0 18 0 0 0 0 0 0 0 0 0 0 0 0 0
2 0 0 10 0 0 0 0 0 0 0 0 0 0 0 0 0
3 0 1 0 0 1 0 0 0 0 0 0 0 0 2 0 0
4 0 0 0 0 0 0 0 0 0 0 0 0 0 0 0 0
5 0 0 20 0 0 0 0 0 0 0 0 0 0 0 0 0
6 0 0 6 0 0 0 0 0 0 0 0 0 0 0 0 0
7 0 0 24 0 0 0 0 0 0 0 0 0 0 0 0 0
8 0 0 1 0 0 0 0 0 0 0 0 0 0 0 0 0
9 0 0 17 0 0 0 0 0 0 0 0 0 0 0 0 0
10 0 0 20 0 0 0 0 0 0 0 0 0 0 0 0 0
11 0 0 15 0 0 0 0 0 0 0 0 0 0 0 0 0
12 0 0 18 0 0 0 0 0 0 0 0 0 0 0 0 0
13 0 0 20 0 0 0 0 0 0 0 0 0 0 0 0 0
14 0 0 12 0 0 0 0 0 0 0 0 0 0 0 0 0
15 0 0 16 0 0 0 0 0 0 0 0 0 1 0 0 0
16 0 0 15 0 0 0 0 0 0 0 0 0 0 0 0 0
PR EC ED IN G E V EN T TRIGGERING EVENT 20ms
1 2 3 4 5 6 7 8 9 10 11 12 13 14 15 16 1 0 0 13 0 0 0 0 0 0 0 0 0 0 0 0 0
2 0 0 22 0 0 0 0 0 0 0 0 0 0 0 0 0
3 4 1 0 0 0 0 1 0 1 8 9 8 10 9 12 10
4 0 0 0 0 0 0 0 0 0 0 0 0 0 0 0 0
5 0 0 24 0 0 0 0 0 0 0 0 0 0 0 0 0
6 0 0 23 0 0 0 0 0 0 0 0 0 0 0 0 0
7 0 0 22 0 0 0 0 0 0 0 0 0 0 0 0 0
8 0 0 18 0 0 0 0 0 0 0 0 0 0 0 0 0
9 0 0 23 0 0 0 0 0 0 0 0 0 0 0 0 0
10 0 0 16 0 0 0 0 0 0 0 0 0 0 0 0 0
11 0 0 15 0 0 0 0 0 0 0 0 0 0 0 0 0
12 0 0 13 0 0 0 0 0 0 0 0 0 0 0 0 0
13 0 0 13 0 0 0 0 0 0 0 0 0 0 0 0 0
14 0 0 11 0 0 0 0 0 0 0 0 0 0 0 0 0
15 0 0 12 0 0 0 0 0 0 0 0 0 1 0 0 0
16 0 0 13 0 0 0 0 0 0 0 0 0 0 0 0 0
TRIGGERING EVENT PR EC ED IN G E V EN T 50ms
1 2 3 4 5 6 7 8 9 10 11 12 13 14 15 16 1 0 0 21 0 0 0 0 0 0 0 0 0 0 0 0 0
2 0 0 12 0 0 0 0 0 0 0 0 0 0 0 0 0
3 1 10 0 0 19 18 20 13 20 20 21 22 22 22 22 22
4 0 0 0 0 0 0 0 0 0 0 0 0 0 0 0 0
5 0 0 4 0 0 0 0 1 0 0 0 0 0 0 0 0
6 0 0 4 0 0 0 0 0 0 0 0 0 0 0 0 0
7 0 0 4 0 0 0 0 0 0 0 0 0 0 0 0 0
8 0 0 1 0 0 0 0 0 0 0 0 0 0 0 0 0
9 0 0 4 0 0 0 0 0 0 0 0 0 0 0 0 0
10 0 0 4 0 0 0 0 0 0 0 0 0 0 0 0 0
11 0 0 3 0 0 0 0 0 0 0 0 0 0 0 0 0
12 0 0 1 0 0 0 0 0 0 0 0 0 0 0 0 0
13 0 0 2 0 0 0 0 0 0 0 0 0 0 0 0 0
14 0 0 2 0 0 0 0 0 0 0 0 0 0 0 0 0
15 0 0 2 0 0 0 0 0 0 0 0 0 1 0 0 0
16 0 0 1 0 0 0 0 0 0 0 0 0 0 0 0 0
TRIGGERING EVENT PR EC ED IN G E V EN T 100ms
1 2 3 4 5 6 7 8 9 10 11 12 13 14 15 16 1 0 0 24 0 0 0 0 1 0 0 0 0 0 0 0 0
2 0 0 0 0 0 0 0 0 0 0 0 0 0 0 0 0
3 1 22 0 0 22 20 22 17 22 22 22 22 22 20 22 22
4 0 0 0 0 0 0 0 0 0 0 0 0 0 0 0 0
5 0 0 2 0 0 0 0 0 0 0 0 0 0 0 0 0
6 0 0 1 0 0 0 0 0 0 0 0 0 0 0 0 0
7 0 0 2 0 0 0 0 0 0 0 0 0 0 0 0 0
8 0 0 1 0 0 0 0 0 0 0 0 0 0 0 0 0
9 0 0 1 0 0 0 0 0 0 0 0 0 0 0 0 0
10 0 0 2 0 0 0 0 0 0 0 0 0 0 0 0 0
11 0 0 2 0 0 0 0 0 0 0 0 0 0 0 0 0
12 0 0 2 0 0 0 0 0 0 0 0 0 0 0 0 0
13 0 0 1 0 0 0 0 0 0 0 0 0 0 0 0 0
14 0 0 2 0 0 0 0 0 0 0 0 0 0 0 0 0
15 0 0 2 0 0 0 0 0 0 0 0 0 1 0 0 0
16 0 0 2 0 0 0 0 0 0 0 0 0 0 0 0 0
TRIGGERING EVENT PR EC ED IN G E V EN T 500ms
1 2 3 4 5 6 7 8 9 10 11 12 13 14 15 16 1 0 0 20 0 0 0 0 0 0 0 0 0 0 0 0 0
2 0 0 0 0 0 0 0 0 0 0 0 0 0 1 0 0
3 4 20 0 0 4 2 7 0 5 5 2 3 3 2 8 5
4 0 0 0 0 0 0 0 0 0 0 0 0 0 0 0 0
5 0 0 2 0 0 0 0 0 0 0 0 0 0 0 0 0
6 0 0 2 0 0 0 0 0 0 0 0 0 0 0 0 0
7 0 0 2 0 0 0 0 0 0 0 0 0 1 1 1 0
8 0 0 2 0 0 0 0 0 0 0 0 0 0 0 0 0
9 0 0 2 0 0 0 0 0 0 0 0 0 0 0 0 0
10 0 0 2 0 0 0 0 0 0 0 0 0 0 0 0 0
11 0 0 2 0 0 0 0 0 0 0 0 0 0 0 0 0
12 0 0 2 0 0 0 0 0 0 0 0 0 0 0 0 0
13 0 0 2 0 0 0 0 0 0 0 0 0 0 0 0 0
14 0 0 1 0 0 0 0 0 0 0 0 0 0 0 0 0
15 0 1 0 0 0 0 0 0 0 0 0 0 1 0 0 0
16 0 0 0 0 0 0 0 0 0 0 0 0 0 0 0 0
In the case of the application tested, the most significant interaction effect was related to one input signal (In2 – AC
current). The input In2 is linked to an analog to digital converter
(ADC) port on the ECU where the scaling is such that a voltage reading of -10V to +10V equates to a current value of -616A to +616A respectively. Evaluating the interaction between Event 3 and Event 1 at higher TBEs, as the equivalent AC current at In2 steps from an initial value of -49A to a final value -58A, the
equivalent AC current at In1 steps from -44A to -53A. Further
analysis of the threshold values from Table 4 indicates that the threshold values for In1 is different to the threshold values of
the other AC current inputs In2 and In3. This may suggest a
difference in either the input circuitry or component tolerances between the inputs which could manifest in subtle variations causing a transient effect on triggering signals causing them to exceed the threshold.
Some key learning from the research are discussed here. (1) Assumptions about lower values TBE (e.g. 1ms – 10ms) teasing out more faults than higher values (e.g. 20ms – 500ms) are not necessarily valid. It may be true for some systems but it can’t be generalized. When designing SIT test suites, a range of TBEs should be considered. (2) The interaction effects for a given input can be bidirectional i.e. an event can interact with another event to trigger faults and also be interacted with to trigger faults. (3) Different levels of analysis are needed to understand interaction effects. If effectiveness is considered as a measure of the total number of faults generated by a test suite then a high level fault count may indicate the most effective TBE (e.g. 20ms in Fig. 5) and can be a good start for detailed system interrogation. However detailed interaction analysis can help in focusing test effort around different TBE values for fault localization (e.g. 100ms in Fig. 6).
The work successfully demonstrated the effectiveness of the proposed approach in identifying faults due to sequence interactions with TBE as a key parameter in a real-time environment. The authors are unable to claim that the proposed approach is more effective than any other existing approaches, only in as much as suggesting that the approach is relevant and necessary. It is acknowledged that an interesting route for further effectiveness evaluation could include studies comparing the approach with SCA and other randomized testing approaches as part of future research.
VII.CONCLUSION
The effectiveness of the research in answering the question, “How does the time between input events (TBE) affect the elicitation of faults in a real-time embedded system?” is concluded in this section.
The effect of input interactions on real-time systems is an important area of work, and equally important is how the pragmatic testing of such interactions has to be conducted. Through this research a methodology for conducting real-time SIT is proposed. Building on previous work 3-way event
sequence permutations beyond the SCA approach is presented and solves the challenge coverage of the consecutiveness of events, something that the SCA approach is not designed to cover. This is an important aspect for testing a real-time system. Real-time testing of a safety control function of a prototype electric machine ECU was used to demonstrate the effectiveness of the approach in finding faults where the fault output is triggered due to input event sequence interactions. For the experiment conducted, TBE values ranging from 1ms to 500ms were selected and for each TBE 2688 3-way input sequence interaction tests were generated. A minimum of 169 (TBE 500ms) and maximum of 431 (TBE 20ms) fault trigger instances were detected.
The research has demonstrated that the TBE for a given event sequence is significant in eliciting faults in an embedded control system in a real-time test environment. The values of TBE selected can have different interaction effects i.e. the direction of influence of one input on another input can change for different TBEs. Therefore consideration of a range of TBE values in designing SITs is important.
Interesting areas to explore further include evaluating the effectiveness of using a non-fixed value of TBE for a SIT test suite exploring approaches for how these values can be generated. This can be influenced by the results of fixed TBE testing as presented, to guide the selection of the most influential TBE values as a means of optimizing sequence ordering. The effectiveness of the approach needs to be further investigated on a broader set of requirements and potentially more importantly from an industrial context, on different embedded systems. One of the assumptions made was 3-way interaction testing is sufficient to identify more than 90% of faults based on previous research. There is a need to understand whether pair wise SIT is sufficient to identify sequence interaction related faults. Future work will be conducted to find out precisely how effective the proposed approach by comparing with other approaches in a pragmatic and systematic manner.
ACKNOWLEDGMENT
WMG is part of the High Value Manufacturing (HVM) Catapult Centre. This work has been undertaken within the HVM Catapult Centre.
REFERENCES
[1] J. Mössinger, "Software in automotive systems," IEEE software, no. 2, pp. 92-94, 2010.
[2] R. N. Charette. (2009) This car runs on code. IEEE Spectrum. 3.
[3] V. S. B. VOSA. (2013, 08/12/13). Vehicle Recalls Data. Available:
http://www.dft.gov.uk/vosa/apps/recalls/default.asp
[4] WarrantyDirect. (2014, 13/11/2014). Manufacturer ratings electrical. Available:
[5] J.D.Power. (2015, 22/04/2015). 2015 U.S. Vehicle Dependability Study Results | J.D. Power. Available:
http://autos.jdpower.com/content/study- auto/I0X6eMP/2015-u-s-vehicle-dependability-study-results.htm
[6] D. C. Smith, "Overview of NHTSA and Its Activities Related to Unintended Acceleration and Vehicle Electronics," NHTSA Associate Administrator of Enforcement, presentation to the National Academy of Sciences
- http://onlinepubs.trb.org/onlinepubs/UA/100630DOTSlid esSmith.pdf2010, Available:
http://onlinepubs.trb.org/onlinepubs/UA/100630DOTSlides Smith.pdf, Accessed on: 12/03/2015.
[7] NHTSA, "Technical Assessment of Toyota Electronic Throttle Control (ETC) Systems," US Department of Transport - National Highway Traffic Safety Administration,
http://www.nhtsa.gov/staticfiles/nvs/pdf/NHTSA_report_ex ecsum.pdf2011, Available:
http://www.nhtsa.gov/staticfiles/nvs/pdf/NHTSA_report_ex ecsum.pdf, Accessed on: 12/03/2015.
[8] M. Grottke and K. S. Trivedi, "A classification of software faults," Journal of Reliability Engineering Association of Japan, vol. 27, no. 7, pp. 425-438, 2005.
[9] C. C. IEEE Standards, IEEE Computer Society., E. Institute of Electrical and Electronics, I. S. Board, and I. American National Standards, "IEEE standard glossary of software engineering terminology," (in English), IEEE Std 610.12-1990, p. 83 p., 1990.
[10] D. M. Cohen, S. R. Dalal, J. Parelius, and G. C. Patton, "The combinatorial design approach to automatic test generation," Software, IEEE, vol. 13, no. 5, pp. 83-88, 1996.
[11] R. Kuhn, R. Kacker, Y. Lei, and J. Hunter, "Combinatorial software testing," IEEE Computer, vol. 42, no. 8, pp. 94-96, 20/05/2008 2009.
[12] D. R. Wallace and D. R. Kuhn, "Failure modes in medical device software: an analysis of 15 years of recall data," International Journal of Reliability, Quality and Safety Engineering, vol. 8, no. 04, pp. 351-371, 2001.
[13] D. R. Kuhn and V. Okum, "Pseudo-exhaustive testing for software," in Software Engineering Workshop, 2006. SEW'06. 30th Annual IEEE/NASA, 2006, pp. 153-158: IEEE.
[14] R. Oshana and M. Kraeling, Software Engineering for Embedded Systems: Methods, Practical Techniques, and Applications. United States of America: Newnes, 2013, p. 1150.
[15] H. Kopetz, Real-time systems: design principles for distributed embedded applications. Springer, 2011. [16] C. R. Rao, "Factorial experiments derivable from
combinatorial arrangements of arrays," Supplement to the Journal of the Royal Statistical Society, pp. 128-139, 1947. [17] D. M. Cohen, S. R. Dalal, M. L. Fredman, and G. C.
Patton, "The AETG system: An approach to testing based on combinatorial design," IEEE Transactions on Software Engineering, vol. 23, no. 7, pp. 437-444, 1997.
[18] Y. M. Chee, C. J. Colbourn, D. Horsley, and J. Zhou, "Sequence covering arrays," SIAM Journal on Discrete Mathematics, vol. 27, no. 4, pp. 1844-1861, 2013. [19] D. R. Kuhn, J. M. Higdon, J. F. Lawrence, R. N. Kacker,
and Y. Lei, "Combinatorial methods for event sequence
testing," in 2012 IEEE Fifth International Conference on Software Testing, Verification and Validation (ICST), 2012, pp. 601-609: IEEE.
[20] C. J. Colbourn, "Combinatorial aspects of covering arrays," Le Matematiche (Catania), vol. 58, no. 121-167, pp. 0-10, 2004.
[21] R. C. Bryce, C. J. Colbourn, and M. B. Cohen, "A framework of greedy methods for constructing interaction test suites," in Proceedings of the 27th international conference on Software engineering, 2005, pp. 146-155: ACM.
[22] C. J. Colbourn and J. H. Dinitz, Handbook of
Combinatorial Designs. Chapman & Hall/CRC, London, 2007.
[23] K. Sarkar and C. J. Colbourn, "Two-stage algorithms for covering array construction," arXiv preprint
arXiv:1606.06730, 2016.
[24] K. Sarkar and C. J. Colbourn, "Upper bounds on the size of covering arrays," arXiv preprint arXiv:1603.07809, 2016. [25] E. Farchi, I. Segall, R. Tzoref-Brill, and A. Zlotnick,
"Combinatorial testing with order requirements," in Software Testing, Verification and Validation Workshops (ICSTW), 2014 IEEE Seventh International Conference on, 2014, pp. 118-127: IEEE.
[26] E. Erdem, K. Inoue, J. Oetsch, J. Pührer, H. Tompits, and C. Yılmaz, "Answer-set programming as a new approach to event-sequence testing," International Conference on Advances in System Testing and Validation Lifecycle, 2011. [27] M. Brain et al., "Event-sequence testing using answer-set
programming," International Journal on Advances in Software Volume 5, Number 3 & 4, 2012, 2012.
[28] O. Margalit, "Better bounds for event sequencing testing," in Software Testing, Verification and Validation Workshops (ICSTW), 2013 IEEE Sixth International Conference on, 2013, pp. 281-284: IEEE.
[29] M. Rahman, R. R. Othman, R. B. Ahmad, and M. M. Rahman, "Event Driven Input Sequence T-way Test Strategy Using Simulated Annealing," in Intelligent Systems, Modelling and Simulation (ISMS), 2014 5th International Conference on, 2014, pp. 663-667: IEEE. [30] J. Petke, M. B. Cohen, M. Harman, and S. Yoo, "Practical
combinatorial interaction testing: Empirical findings on efficiency and early fault detection," IEEE Transactions on Software Engineering, vol. 41, no. 9, pp. 901-924, 2015. [31] G. Becci, G. Dhadyalla, A. Mouzakitis, and J. Marco,
"Robustness Testing of Real-Time Automotive Systems Using Sequence Covering Arrays," SAE Int. J. Passeng. Cars – Electron. Electr. Syst., no. 6(1), pp. 287-293, 2013. [32] dSPACE. (2017, 29/10/2017). Real-Time Testing.
Available:
https://www.dspace.com/en/inc/home/products/sw/test_aut omation_software/automated_test_execution_in_re.cfm
CONTACT INFORMATION
Dr Chek Pin Yang, WMG, The University of Warwick [email protected]