METHOD DEVELOPMENT AND VALIDATION OF GLIMEPIRIDE IN
TABLET DOSAGE FORM BY RP-HPLC METHOD
A. Chowdeswari1, B. Sivagami*1, R. Sireesha1, R. Chandrasekar2 and M. Niranjan
Babu2
1
Department of Pharmaceutical Analysis, Seven Hills College of Pharmacy.
2
Department of Pharmacognosy, Seven Hills College of Pharmacy.
Venkataramapuram, Tirupati-517561, Andhra Pradesh, India.
ABSTRACT
A simple, precise, rapid, newer, specific and accurate method has been
made for the estimation of Glimepiride in formulation by RP – HPLC
method. Standard substance was dissolved in Methanol and this
solution was scanned in the UV region from 200-400nm range. Spectra
was recorded and the spectrum shows that λmax of Glimepiride was 228
nm. Reverse phase chromatographic technique was selected by using
C18 column with 150 x 4.6 mm i.d. and 5 µm particle s i z e as a
stationary phase with Acetonitrile : Disodium hydrogen o- phosphate
(70 : 30, v / v, pH 4) was selected as mobile phase for the analysis.
Mobile phase flow rate was maintained at 1.0 ml / min. 228 nm was
selected as detection wavelength. The developed method was validated
in terms of accuracy, precision, specificity, system suitability, linearity,
and robustness, limit of detection and limit of quantification. With the
optimized chromatographic conditions, the drug was linear in the concentration range of
20-120 µg/ ml. The correlation coefficient was found to be 0.9991. The developed method was
validated in terms of accuracy, precision, linearity, limit of detection, limit of quantification,
robustness and stability. The proposed method can be used for the routine estimation of drugs
in pharmaceutical dosage forms.
KEYWORDS: Glimepiride, Method Validation, RP-HPLC, Stability.
Volume 7, Issue 14, 788-799. Research Article ISSN 2277– 7105
Article Received on 30 May 2018,
Revised on 20 June 2018, Accepted on 10 July 2018
DOI: 10.20959/wjpr201814-12869
*Corresponding Author
B. Sivagami
Department of
Pharmaceutical Analysis,
Seven Hills College of
Pharmacy,
Venkataramapuram,
Tirupati-517561, Andhra
INTRODUCTION
Glimepiride, like glyburide and glipizide, is a "second-generation" sulfonylurea agent.
Glimepiride is used with diet to lower blood glucose by increasing the secretion of insulin
from pancreas and increasing the sensitivity of peripheral tissues to insulin. Chemically
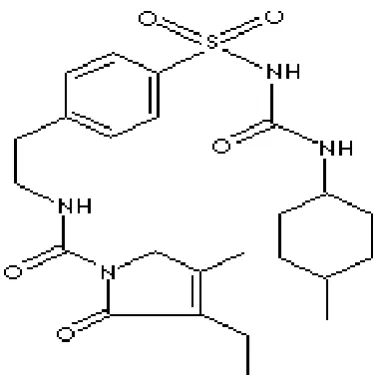
glimipride is known as 3-ethyl-4-methyl-2-oxo-N-(2-{4-[({[(1r,4r)-4-methylcyclohexyl]-C
hydroxycarbonimidoyl}amino)sulfonyl]
[image:2.595.203.391.225.413.2]phenyl}ethyl)-2,5-dihydro-1H-pyrrole-1-carboximidic acid.
Figure No. 1: Structure of Glimepiride.
The mechanism of action of glimepiride in lowering blood glucose appears to be dependent
on stimulating the release of insulin from functioning pancreatic beta cells, and increasing
sensitivity of peripheral tissues to insulin. Glimepiride likely binds to ATP-sensitive
potassium channel receptors on the pancreatic cell surface, reducing potassium conductance
and causing depolarization of the membrane. Membrane depolarization stimulates calcium
ion influx through voltage-sensitive calcium channels. This increase in intracellular calcium
ion concentration induces the secretion of insulin.
The are many methods developed for glimepiride by UV and HPLC methods in API and
combination drugs. This method seems to be economic than other methods. The main aim of
this method is to develop a new method and validate Glimepiride in tablet dosage forms.[1,5]
MATERIALS AND METHODS
Apparatus and software
The liquid chromatographic system consisted of following components: Shimadzu HPLC
/VIS detector SPD-20A (VP series) and Hamilton syringe (705 NR, 20 µL).
Chromatographic analysis was performed using Chromtech N-2000 software on a
phenomenex luna C-18 column with 150 x 4.6 mm i.d. and 5 µm particle s i z e .
Chemicals and Reagents
Glimepiride working standard (99.3%), Di sodium hydrogen ortho-phosphate, ortho
phosphoric acid, Glacial acetic acid, salicylic acid, methanol and acetonitrile all the
chemicals were of analytical grade obtained from Sigma Aldrich Mumbai Pvt ltd.
Method Development
Preparation of mobile phase
Accurately 0.14 g of Di sodium hydrogen ortho-phosphate was weighed and dissolved in 500
ml of HPLC water. The solution was sonicated for 5 min to dissolve the buffer completely.
Then the pH was adjusted to 4 using ortho phosphoric acid. This solution was filtered through
Millipore vaccume filter (0.22 µm). From this 300 ml of buffer solution was mixed with 700
ml of Acetonitrile and shake well. Finally the solution was sonicatedfor 15 min.
Preparation of Stock solution
A stock solution of Glimepiride was prepared by accurately weighing 25 mg of drug,
transferring to 25 ml volumetric flask, dissolving in 25 ml of mobile phase and sonicated for
5min. Appropriate aliquot of this solution was further diluted to 100 ml with mobile phase to
obtain final standard solution of 100 µg / ml of Glimepiride and the resultant solution was
filtered through Whatman filter paper.
Preparation of Standard stock solution
Standard stock solution was prepared by dissolving accurately weighed 100 mg pure drug in
100 ml of diluents. This will become 1000 mcg / ml solution, which was taken as stock
solution.
Selection of the Chromatographic method
A RP C-18 column equilibrated with mobile phase Acetonitrile: Disodium hydrogen o
phosphate (70: 30, v / v, pH 4) was used. Mobile phase flow rate was maintained at 1.0 ml /
min. Detection wavelength 228 nm was selected by scanning standard drug over a wide range
of wavelength 200 nm to 400 nm in U.V Spectroscopy. The sample was injected through 20
Preparation of Mobile Phase
Required weight of buffer with molarity 0.002M was taken and is dissolved in 100 ml of
HPLC Grade water. Sonicate the solution for 10 min. and adjust the pH to 4 using
orthophosphoric acid and filter the solution using vacuum filter and add it to reagent bottle.
To this solution add acetonitrile. Mix well and sonicate the mixture for 20 min. The ratio of
the mobile phase (ACN: Buffer) was kept as 70:30.
RESULTS AND DISCUSSIONS
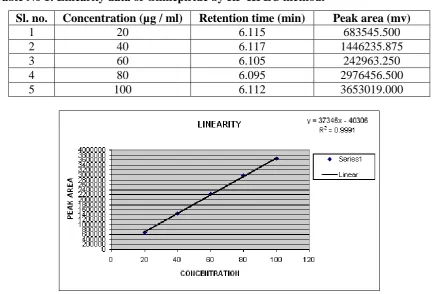
Linearity
Appropriate aliquots of standard Glimepiride stock solutions (100 µg / ml) were taken in
different 10 ml volumetric flask and resultant solution was diluted up to the mark with mobile
phase to obtain final concentration of 20-120 µg / ml. These solutions were injected into
chromatographic system. The chromatograms were obtained and peak area was determined
[image:4.595.78.515.379.673.2]for each concentration of drug solution the data are given in table 1.
Table No 1: Linearity data of Glimepiride by RP-HPLC method.
Sl. no. Concentration (µg / ml) Retention time (min) Peak area (mv)
1 20 6.115 683545.500
2 40 6.117 1446235.875
3 60 6.105 242963.250
4 80 6.095 2976456.500
5 100 6.112 3653019.000
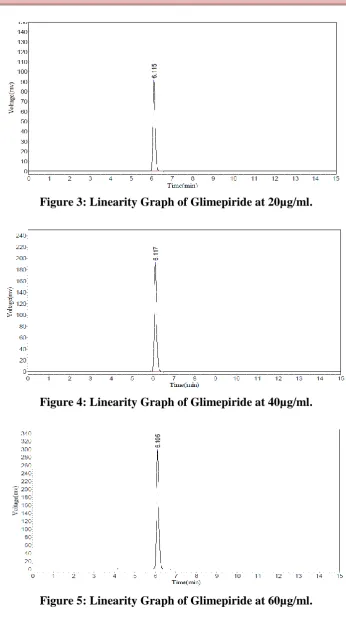
Figure 3: Linearity Graph of Glimepiride at 20µg/ml.
Figure 4: Linearity Graph of Glimepiride at 40µg/ml.
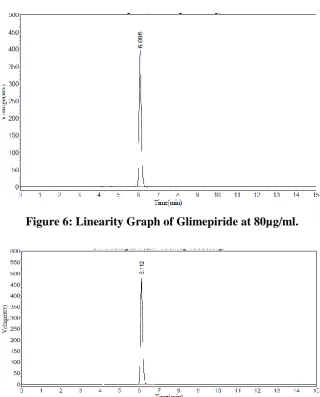
[image:5.595.128.467.342.620.2]Figure 6: Linearity Graph of Glimepiride at 80µg/ml.
Figure 7: Linearity Graph of Glimepiride at 100µg/ml.
Precision
System Precision (Injection repeatability) was measured by using six replicates of the same
band containing 1000 ng pure Glimepiride and % RSD of the replicate injections was
calculated. The precision of the method was determined by spotting six replicates of the
sample solution of Glimepiride such that each band containing 1000 ng of Glimepiride and %
RSD of the replicate injections was calculated. Both the system precision and method
precision were subjected to intra-day and inter-day variation. The results of the system
Table No 2: Precision results for Glimepiride.
Sl. no. Concentration (µg / ml) Retention time (min) Intraday precision (Area)
1 60 6.125 2263635.75
2 60 6.107 2270039.25
3 60 6.107 2269668
4 60 6.1 2255107.75
5 60 6.098 2248836.25
Mean 6.1074 2261457.4
Std. Dev 0.010644247 9292.722865
%RSD. 0.174 0.41
Accuracy
The accuracy of the method was determined by use of standard additions at three different
levels, i.e. multiple-level recovery studies. Sample stock solution of Glimepiride was
prepared, 80%, 100% and120% of the standard drug solution was added to the solution, and
the recovery [%] was determined. Values were found to be within the limits. The results are
[image:7.595.73.522.393.661.2]shown in Table 3.
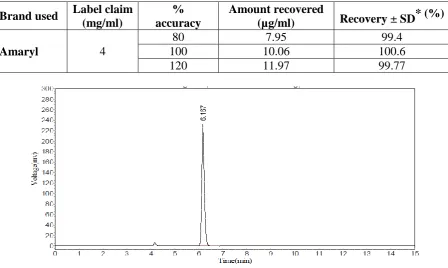
Table No 3: Accuracy results for Glimepiride.
Brand used Label claim
(mg/ml)
% accuracy
Amount recovered
(µg/ml) Recovery ± SD* (%)
Amaryl 4
80 7.95 99.4
100 10.06 100.6
120 11.97 99.77
Figure 9: Accuracy Graph of Glimepiride at 100%.
Figure 10: Accuracy Graph of Glimepiride at 120%.
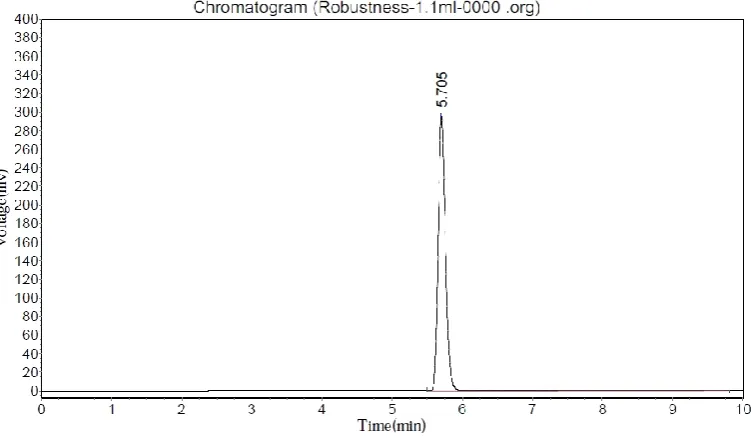
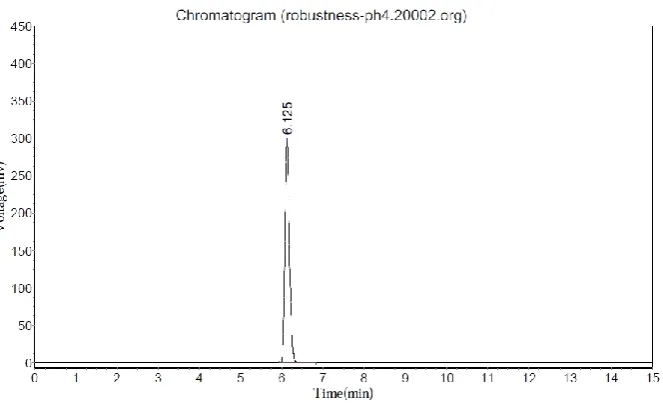
Robustness
Robustness is a measure of capacity of a method to remain unaffected by small but deliberate
variations in the method conditions, and is indications of the reliability of the method. A
method is robust, if it is unaffected by small changes in operating conditions. To determine
the robustness of this method, the experimental conditions were deliberately altered at three
different levels and retention time and chromatographic response were evaluated. One factor
at a time was changed to study the effect. Variation of mobile phase ratio (68:32 v / v). The
variation in mobile phase pH by ± 0.2 units (pH 4.2). The results are given in table 4.
Table No 4: Robustness studies of Glimepiride.
Sl No Parameters Std. Area Area % RSD
Change in Flow Rate
1 0.9ml 2255108 2257357 0.07051
2 1.1ml 2255108 2252833 0.07135
Change In pH
1 3.8 2255108 2249356 0.18057
Figure 11: Robustness graph of Glimepiride at 0.9 ml flow rate.
[image:9.595.106.482.357.576.2]Figure 13: Robustness graph of Glimepiride at 3.8 pH.
Figure 14: Robustness graph of Glimepiride at 4.2 pH.
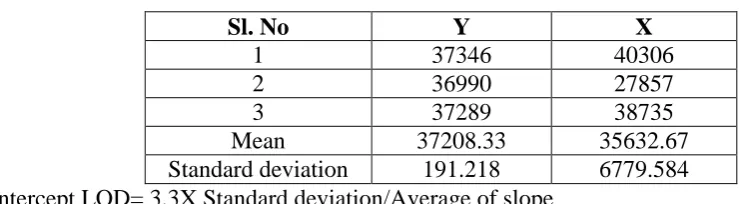
Limit of Detection
Limit of detection is determined by the analysis of samples with known concentrations of
analyte and by establishing the minimum level at which the analyte can be reliably detected.
The Limit of detection was found to be 500ng for Glimepiride the results of LOD were
[image:10.595.124.456.355.558.2]Table 5: LOD of Glimepiride.
Sl. No Y X
1 37346 40306
2 36990 27857
3 37289 38735
Mean 37208.33 35632.67
Standard deviation 191.218 6779.584 Intercept LOD= 3.3X Standard deviation/Average of slope
LOD = 3.3 X 6779.584/37208.3
=0.60 ng/ml.
Limit of Quantitation
Limit of quantitation is determined by the analysis of samples with known concentrations of
analyte and by establishing the minimum level at which the analyte can be reliably
Quantitate. The LOQ can also be calculate based on the LOD strength (500 ng / ml, standard
solution), the LOD values were multiplied by three times to get LOQ.
Table 6: LOQ of Glimepiride.
Sl. No X Y
1 37346 40306
2 36990 27857
3 37289 38735
Mean 37208.33 35632.67
Standard deviation 191.218 6779.584 Intercept LOQ = 10 X Std. Dev. of intercept/ Avg. of slope
LOQ = 10 X 6779.584/ 37208.33
= 1.822 ng/ml
Degradation Studies
Standards and degraded samples are injected and calculated the percentage of drug degraded
in solution by applying different conditions like acid, alkali, and oxidative, photolytic,
thermal and neutral analysis.
Table 7: Stress Degradation results of Glimepiride.
Sl.No Stressed area Area % degradation
1 Acid hydrolysis 2936539 61.60 2 Alkali hydrolysis 2098402.5 72.56 3 Oxidative stress 559065.5 92.68
4 Water stress 487979 93.61
CONCLUSION
In the present study, an attempt was made to provide a newer, simple, sensitive, precise,
accurate stability and low cost HPLC method for the effective quantitative determination of
Glimepiride as an active pharmaceutical ingredient as well as in pharmaceutical preparations
without the interferences of other constituent in the formulations. The method is rugged and
robust as observed from insignificant variation in the results of analysis on changes in mobile
phase composition ratio and analysis being performed by different analysts and on different
days respectively. In all the above cases the recovery is found to be within the limit of 99%.
Hence it is concluded that the assay method is found to be valid in terms of reliability,
precision and accuracy, suitable for chemist-to-chemist and day-to-day for routine analysis as
well as for stability analysis.
REFERENCES
1. Vinay Pandit, Roopa S. Pai, Kshama Devi, Gurinder Singh, Satya Narayana, and Sarasija
Suresh Development and validation of the liquid chromatographic method for
simultaneous estimation of metformin, pioglitazone, and glimepiride in pharmaceutical
dosage forms Pharm Methods., 2012; 3(1): 9–13.
2. K. Neelima, Y. Rajendra Prasad Analytical Method Development and Validation of
Metformin, Voglibose, Glimepiride in Bulk and Combined Tablet DosageForm by
Gradient RP-HPLC Pharmaceutical Methods, 2014; 5(1): 27-33.
3. Magda Mohamed Ibrahim. Development and Validation of a RP-HPLC Method For The
Simultaneous Determination of Carvedilol, Glimepiride or Glibenclamide In Binary
Combinations; And Its Application For In Vitro - Interaction Studies. Indo American
Journal of Pharm Research, 2015; 5(08): 2791-2802.
4. Gadapa Nirupa, and Upendra M. Tripathi RP-HPLC Analytical Method Development and
Validation for Simultaneous Estimation of Three Drugs: Glimepiride, Pioglitazone, and
Metformin and Its Pharmaceutical Dosage Forms Journal of Chemistry, 2013; 1-8.
5. M. Suchritra, D. Sunitha, C. Parthiban, B. Siddartha, C. Madhavi, Methid Development
and Validation of Metformin, Glimipride and Pioglitazone in Tablet Dosage form by