Dr. Usha Rani N.*, Saroja N., Jhansi Rani CH
Maharajah’s College of Pharmacy, Vizianagaram, Andhrapradesh, India.
ABSTRACT
A simple, specific and precise reverse phase high performance liquid chromatographic method was developed and validated for simultaneous estimation of Atenolol and Indapamide in tablets. Quantification was achieved by using an Eclipse XDB plus C18 column (4.6 x 150nm, 5 µm particle size). The mobile phase consisted of a mixture of acetonitrile and water in the ratio of 60:40 v/v at a flow rate of 1.2 ml/min. The retention times of Atenolol and Indapamide were found to be 1.00 min and 2.057 min respectively. The developed method was validated as per ICH Guidelines for linearity, accuracy, precision, detection limit, quantification limit, robustness,
rudggedness, specificity and system suitability. The percentage recoveries for both of the drugs from the tablets were found to be 100.2 % and 99.99 % respectively. The method may successfully be employed for the simultaneous determination of Atenolol and Indapamide in pharmaceutical tablet dosage forms.
KEYWORDS: Atenolol, Indapamide, RP-HPLC; tablets.
INTRODUCTION
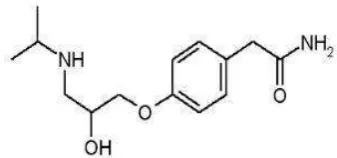
Atenolol (ATN), 2-(4-{2- hydroxyl-3-[(Propan-2-yl) amino] propoxy} phenyl) acetamide (Fig. 1), is a white crystalline powder with molecular formula is C14H22N2O3. It is commonly used as antihypertensive agent. Atenolol competes with sympathomimetic neurotransmitters such as catecholamines for binding at β1- adrenergic receptors in the heart and vascular smooth muscle, inhibiting sympathetic stimulation which results in a reduction in resting heart rate, cardiac output, systolic and diastolic blood pressure, and reflex orthostatic hypotension.[1]
*Correspondence for
Author
Dr. Usharani N.
Maharajah’s College of
Pharmacy, Vizianagaram,
Andhrapradesh, India. Article Received on 24 Sept 2015,
Fig. 1: Chemical structure of Atenolol
[image:2.595.212.381.75.154.2]Indapamide (IND), chemically 4-chloro-N-(2-methyl-2,3-dihydro-1H-indol-1-yl)-3-sulfomylbenzamide (Fig. 2) is a white crystalline powder having molecular formula C16H16ClN3O3S. It is commonly used in hypertension and as a diuretic. [2]
Fig. 2: Chemical structure of Indapamide
The literature survey revealed that very few RP-HPLC [3-8] andspectroscopic methods [9] were reported for the simultaneous estimation of Atenolol and Indapamde in formulations. The authors now propose a new validated, sensitive and reproducible HPLC method for simultaneous determination of Atenolol and Indapamide. The applicability of this method in determining the drugs in commercial dosage forms were also studied.
MATERIALS AND METHODS Materials
Standard Atenolol and Indapamide were obtained from Yarrow chem. Products, Mumbai, India. Commercial formulation, ATEN-D was purchased from the local market. Each tablet contains 50 mg of Atenolol and 2.5 mg of Indapamide. Other materials required were HPLC grade water and acetonitrile.
Instrumentation
analytical separation. The mobile phase consisted of a mixture of acetonitrile and water in the ratio of 60:40 v/v with an isocratic elution program. The flow rate was adjusted to 1.2 ml/min and the injection volume was set at 20 μl with a detection wavelength of 235 nm.
Preparation of Standard solutions
Atenolol stock solution: 50 mg of Atenolol was accurately weighed and dissolved in 10ml of the mobile phase. After sonication for 15 min, the volume was made upto 50 ml with the mobile phase to get 1 mg/ ml solution.
Atenololworking standardsolutions:The Atenolol stock solution was diluted suitably with mobile phase to get the working standard solutions of concentrations ranging from 10 to 50 μg/ml. 20 μl of each of the dilutions was injected 5 times into the column and the
chromatograms were recorded.
Indapamide stock solution: 2.5 mg of Indapmide was weighed accurately and dissolved in 10 ml of the mobile phase. After sonication for 15 min, the volume was made up to the mark with sufficient volume of mobile phase in a 50 ml volumetric flask to get a 50 μg/ml solution.
Indapamide working standard solutions: The Indapamide stock solution was diluted suitably with mobile phase to get the working standard solutions of concentrations ranging from 10 to 50 μg/ml. 20 μl of each of the dilutions was injected 5 times into the column and
the chromatograms were recorded.
Preparation of mixed standard stock solution: Atenolol (100 mg) and Indapamide (Equivalent to 5 mg of Indapamide) were weighed accurately into a 100 ml volumetric flask, dissolved in 20ml of diluent, sonicated for 15 min and the volume was finally made up with the mobile phase.
Preparation of mixed working standard solutions: 1mlof the mixed stock solution was taken in a 10 ml volumetric flask and made upto volume with the mobile phase to get a concentration 5 μg/ml of Indapamide and 100 μg/ml of Atenolol. 20 μl of this solution was
Fig. 3: Typical chromatogram for Atenolol and Indapamide RESULTS AND DISCUSSION
The analytical method was validated with respect to parameters such as linearity, accuracy, precision, limit of detection (LOD), limit of quantification (LOQ) robustness, ruggedness and specificity as per ICH guidelines.
Method validation
The analytical method was developed and validated according to ICH guidelines. Analytical variable parameters such as linearity, precision, accuracy, specificity, and system suitability were tested using the optimized chromatographic conditions and instruments.
System suitability parameters
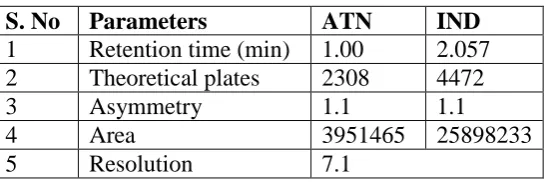
Five replicates of mixed working standard solutions were injected and the parameters like theoretical plate number (N), tailing factor (K) and resolution are calculated to check the system suitability. The results are presented in Table 1.
Table 1: System suitability test results.
S. No Parameters ATN IND
1 Retention time (min) 1.00 2.057 2 Theoretical plates 2308 4472
3 Asymmetry 1.1 1.1
4 Area 3951465 25898233
5 Resolution 7.1
[image:4.595.163.440.580.671.2]solutions were injected and the chromatograms were recorded. A good linear relationship (R2= 0.999 for Atenolol and R2= 0.999 for Indapamide was observed between the concentrations of the drugs and their corresponding peak areas. The results of linearity studies are shown in Table 2.
Table 2: Linearity study data for Atenolol and Indapamide.
S.No. Drugs Slope Intercept Correlation coefficient
1 ATN 13070 10258 0.999
2 IND 85327 99987 0.999
Accuracy
The accuracy studies were performed on 80 %, 100 % and 120 % of the analytical method target concentrations of Atenolol and Indapamide. Standard and sample preparations were injected into HPLC system and three determinants for each concentration level were obtained. The percentage recoveries of Atenolol and Indapamide were calculated using standard at the same concentration at each concentration level. The results are presented in Table 3.
Table 3: Recovery study data for Atenolol and Indapamide S.No. Drug %Recovery %RSD
1 ATN 100.1 0.11
2 IND 99.76 0.38
Precision
System Precision: System precision of the proposed method was checked by injecting five replicate preparations of the standard drug solutions of Atenolol (100 μg/ml) and Indapamide (5 μg/ml). The corresponding peak areas were measured and % RSD calculated.
Method Precision: The method precision study was performed for five replicate sample preparations of marketed formulation containing Atenolol (100 μg/ml) and Indapamide (5 μg/ml). The corresponding peak areas were measured and % RSD calculated as exhibited in
Table 4: System and Method Precision of the proposed method Drug Spiked level (µg/ml)
(n=5)
System precision Method precision
S.D %RSD S.D %RSD
ATN 30 660.5 0.016 914.30 0.023
IND 30 9111.90 0.03 10192.6 0.04
Limit of detection (LOD) and Limit of quantification (LOQ)
LOD and LOQ of the proposed method were calculated as 3.3∂/S and 10∂/S, respectively as per ICH guidelines, where ∂ is the standard deviation of the response and S is the slope of the
[image:6.595.48.549.448.594.2]calibration plot. The results are presented in Table 5.
Table 5: Sensitivity of the proposed method
Drug LOD (µg/ml) LOQ (µg/ml) ATN 0.2680 0.8123
IND 0.3021 0.9156
Robustness
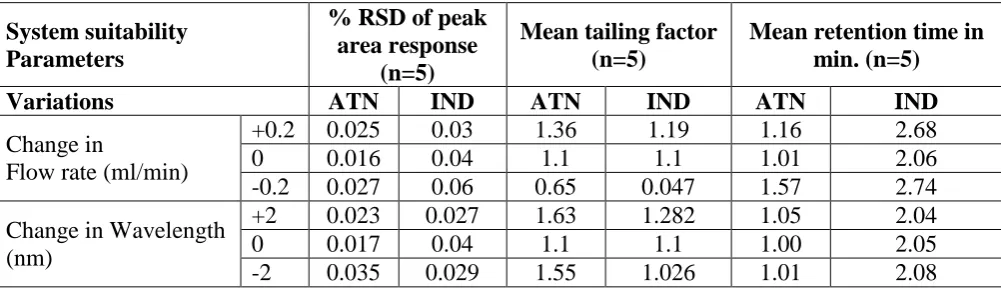
Robustness of the developed analytical method was tested by evaluating the affect of small variations in analytical method parameters such as change in flow rate of 1.2 ml/min by ±0.2 ml/min and change in wavelength by ±2 nm. The results are shown in Table 6.
Table 6: Robustness study data for Atenolol and Indapamide System suitability
Parameters
% RSD of peak area response
(n=5)
Mean tailing factor (n=5)
Mean retention time in min. (n=5)
Variations ATN IND ATN IND ATN IND
Change in
Flow rate (ml/min)
+0.2 0.025 0.03 1.36 1.19 1.16 2.68
0 0.016 0.04 1.1 1.1 1.01 2.06
-0.2 0.027 0.06 0.65 0.047 1.57 2.74 Change in Wavelength
(nm)
+2 0.023 0.027 1.63 1.282 1.05 2.04
0 0.017 0.04 1.1 1.1 1.00 2.05
-2 0.035 0.029 1.55 1.026 1.01 2.08
Ruggedness
Specificity
The specificity of the proposed method was determined to check whether there is any interference due to presence of excipients, impurities or other components with the retention time of analytical peaks. The HPLC chromatograms were recorded for the drug-matrix (mixture of the drug and excipient) which showed almost no interfering peaks within retention time ranges indicating that the method is quite specific.
Application of the proposed method to commercial formulation
Twenty tablets were weighed accurately and crushed to fine powder. Each tablet contains 50 mg of Atenolol and 2.5 mg of Indapamide. A quantity of powder equivalent to 50 mg of Atenolol and 2.5 mg of Indapamide was weighed and dissolved in 25 ml of the mobile phase in a 50 ml volumetric flask. The volume was made up to give a concentration of 1000 μg/ml of Atenolol and 50 μg/ml of Indapamide. The solution was filtered through 0.45 μ nylon membrane filter. From this filtrate, different dilutions ranging from 10-50 μg/ml of Atenolol & 10-50 μg/ml of Indapamide were prepared in 10 ml volumetric flasks with the mobile phase. 20 μl of each of these solutions were injected 5 times and the chromatograms were
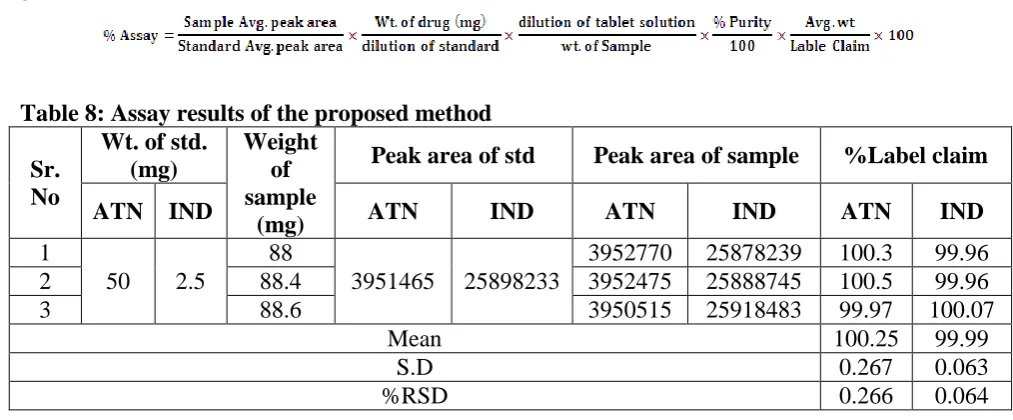
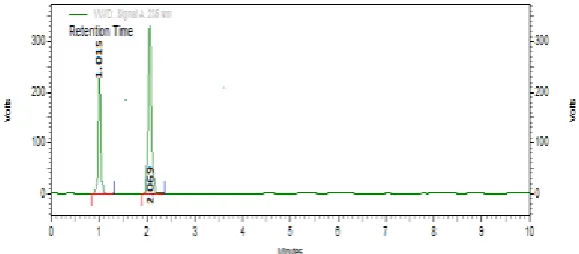
[image:7.595.117.458.89.151.2]recorded. Typical chromatogram obtained for the commercial formulation is presented in Fig. 4. The amount of Atenolol and Indapamide present in each tablet formulation (Table 8) was calculated by comparing the peak area of the tablet solution with that of standard using the given formula:
Table 8: Assay results of the proposed method Sr.
No
Wt. of std. (mg)
Weight of sample
(mg)
Peak area of std Peak area of sample %Label claim
ATN IND ATN IND ATN IND ATN IND
1
50 2.5
88 3952770 25878239 100.3 99.96
2 88.4 3951465 25898233 3952475 25888745 100.5 99.96
3 88.6 3950515 25918483 99.97 100.07
Mean 100.25 99.99
S.D 0.267 0.063
[image:7.595.62.569.564.774.2]Fig. 4: Typical HPLC chromatogram corresponding to marketed formulation of Atenolol and Indapamide
CONCLUSION
The proposed RP-HPLC method is found to be simple, sensitive, reproducible, less time consuming and is applicable for analysis of Atenolol and Indapamide in bulk and in tablet dosage forms. The validation of the developed method for the required parameters as per ICH guidelines showed that all the parameters were within the acceptance criteria. The proposed method was applied for the simultaneous determination of Atenolol and Indapamide in marketed tablet dosage form. The assay results confirmed with the label claim of the formulation. It can be concluded that the proposed HPLC method is sufficiently sensitive and reproducible for simultaneous estimation of Atenolol and Indapamide in tablet dosage forms.
ACKNOWLEDGMENT
The authors express sincere thanks to Yarrow chem. products, Mumbai, India for providing standard samples and Maharajah’s college of Pharmacy for providing necessary facilities for the study.
REFERENCES
1. Indian Pharmacopeia, Government of India, Ministry of health and welfare, the Indian pharmacopeia commission, Ghaziabad, 2007; 2: 749-750.
2. British pharmacopeia, the department of health, The stationary office on behalf of the medicine and health productsregulatory agency (MHRA), London, 2010; 158-159: 898-900.
[image:8.595.152.442.78.205.2]determination of Atenolol and Indapamide in marketed tablet formulation (ATEN-D). Asian Journal of Research in Chemistry, 2012; 5(3): 405-408.
6. Pawar prachi V, Gaikwad preeti D, Bankar vidhyadhar H, Pawar sunil P. Development and validation of RP-HPLC method for simultaneous estimation of Atenolol and Indapamide in pharmaceutical dosage form. International journal of Research in Ayurveda and Pharmacy, 2011; 2(3): 918-923.
7. Ashutosh B, Praveen K, Yogendr B, Chandra sekhar T. Development and validation of RP-HPLC method for simultaneous estimation of Atenolol and Indapamide in combined dosage form. International Journal of Pharmaceutical Sciences Letters, 2013; 3(3): 213-218.
8. Baheti KG, Shah N, Shaikh S. Ion- pairing reverse –phase high performance liquid chromatography method for simultaneous estimation of Atenolol and Indapamide in bulk and combined dosage form. Indian Journal of Pharmaceutical sciences, 2012; 74(3): 271-274.