Introduction
The Tektronix Real-Time Spectrum Analyzer (RTSA) provides a variety of triggering, capture, and analysis capabilities that greatly simplify the task of thoroughly characterizing RF devices that employ analog or digital modulation techniques. Real-time tools like the frequency mask trigger, seamless capture, and
RTSA technology are especially valuable for engineers working with modern communication signals that are often transient in nature.
This technical brief examines several measurement challenges involved with modulation analysis for RF communications signals and the comprehensive set of tools that the Tektronix RTSA provides to address
Modulation Analysis for Transient RF Signals
signals. Whether searching for phase hits on a high capacity data link with a residual bit error floor of 10-12, or trying to capture an elusive packet collision in a WLAN combo device, it is imperative to have equipment that can reliably detect and trigger on transient RF signals.
Transient RF signals have long posed a difficult meas-urement problem. Trying to trigger the acquisition of an RF signal using traditional time domain voltage and power levels, though useful for some cases, can be fraught with problems in low Signal to Noise (SNR) environments or in the presence of other strong signals.
impairments than traditional analysis tools provide. The Real-Time Spectrum Analyzer Tektronix has designed the RTSA to address the measurement challenges associated with dynamic RF signals such as transmissions using variable modulation types and bursted communications packets. The fundamental concept of real-time spectrum analysis is the ability to trigger on an RF signal, seam-lessly capture it into memory, and analyze it in multiple domains. This makes it possible to reliably detect and characterize RF signals that change over time.
This technical brief contains the following examples: – Troubleshooting complex 3G cellular wireless
devices and systems.
– Locating interference in combo devices that implement multiple standards such as 802.11a/b/g, 3G, and Bluetooth.
– Integrating and debugging advanced software defined radio systems.
– Characterizing unwanted modulation in RF communication systems.
– Detecting microphonics and phase-hits in local oscillators that impact overall system performance.
Figure 1 shows a simplified block diagram of Tektronix Real-Time Spectrum Analyzer. The RF front-end can be tuned from DC to 8 GHz, and the input signal is down-converted to a fixed IF. The signal is then filtered, digitized by the ADC, and passed to the DSP engine that manages the instrument’s triggering, memory, and analysis functions. While many elements of this block diagram and acquisition process are similar to those of the traditional VSA architecture also
shown in Figure 1, the RTSA is optimized to deliver real-time triggering, seamless signal capture, and time-correlated multi-domain analysis. In addition, advancements in ADC technology enable a conversion with high dynamic range and low noise, allowing the RTSA to make traditional frequency domain measure-ments that equal or surpass the basic RF performance of many swept spectrum analyzers.
Real-Time Spectrum Analyzer Vector Signal Analyzer
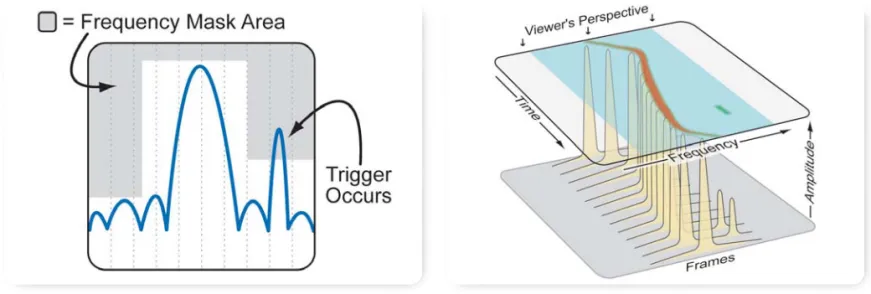
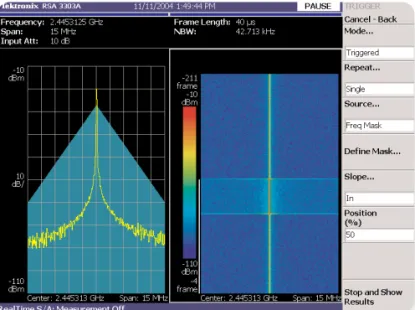
One important capability of the RTSA is the patented frequency mask trigger, which allows the user to trigger an acquisition based on specific events in the frequency domain. As illustrated in Figure 2, a mask is drawn to define the set of conditions within the analyzer’s real-time bandwidth that will generate the trigger event.
Unlike other signal analyzers that use IF power alone to trigger a signal recording, the frequency mask trigger allows the user to selectively trigger on signals that may be far below the peak amplitude of the entire spectrum. Spurious signals that appear below the main carrier power can then be used to trigger the
analyzer. In addition, the RTSA is the only instrument that can trigger on transient spectral events with a very high probability of intercept.
Once the signal is captured, it is also important to provide signal analysis capabilities and display signal traits in a manner that makes it easy to rapidly gain diagnostic insights. The spectrogram, for example, is an intuitive display of how the frequency and power level of a signal changes over time. As illustrated in Figure 3, the horizontal axis represents frequency, the vertical axis represents time, and amplitude is represented by the color of the trace.
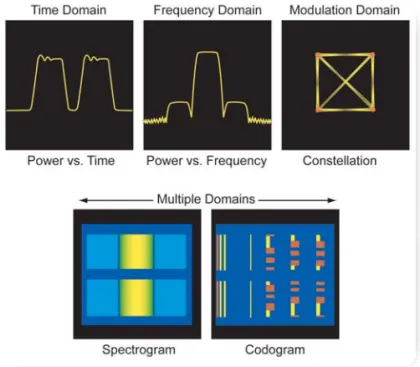
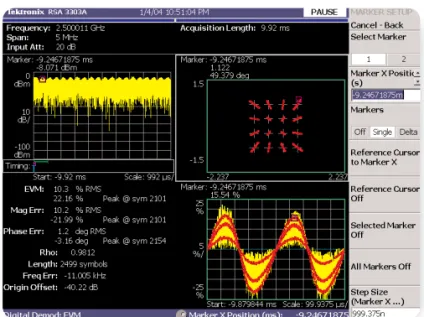
Multi-domain analysis is another way in which the RTSA provides engineers with a flexible set of analysis tools that can be used to thoroughly characterize the behavior of a modulated signal. Figure 4 show several of the displays available on the RTSA, including power vs. frequency (spectrum), spectrum vs. time (spectrogram), power vs. time, symbol constellations (vector diagrams), power vs. spreading code (code domain power), and code domain power vs. time (codogram). The advantage of having so many different time-synchronized analysis domains is that each provides a unique perspective on the signal being analyzed. The broader the perspective derived from a single measurement, the greater the depth of analysis insight and the more rapid the diagnosis. Time pressured engineers and program managers appreciate the value of rapidly diagnosing problems. A crucial element of multi-domain analysis is precise time correlation between events in different domains. Seeing a transient in the power versus time domain and precisely correlating it with an event in the spec-trum display can provide a great deal more diagnostic information, and by providing correlated markers that can be used simultaneously in multiple measurement windows, the RTSA allows the engineer to build certainty of the signal impairment’s causation. This reduces the time to diagnostic insight and improves the reliability of a correct diagnosis.
We have reviewed some of the unique capabilities of the real-time spectrum analyzer and their diagnostic value. Now let us take a brief look at a few measurement examples to illustrate how this technology can be applied to solve various real-world modulation problems.
Figure 4.A few examples of time-correlated multi-domain measurements on the RTSA.
Cellular Wireless Measurements
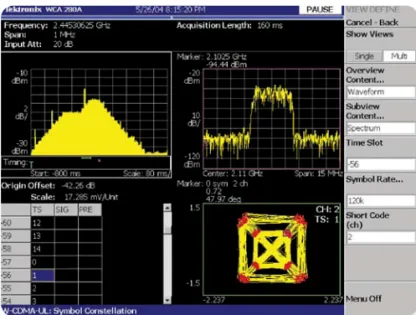
The time-correlated multi-domain analysis of the RTSA has many applications in the cellular industry. A variety of analysis options are available for testing cellular standards, including GSM/EDGE, W-CDMA, HSDPA, cdma2000, 1xEV-DO, and TD-SCDMA. This technology has many powerful advantages when it comes to diagnosing circuit issues. Take for example a W-CDMA constellation that is exhibiting poor Error Vector Magnitude (EVM) while under closed loop power control, as in Figure 5. The time correlated multi-domain analysis ability enhances the certainty of the diagnosis that the high EVM is a direct result of the spikes in the power ramp. Using markers, the spikes can be correlated to the symbols in the constellation that are exhibiting high EVM.
Experienced engineers understand the value of confirming a diagnostic hypothesis with more than one measurement. The multi-domain approach allows verification of the hypothesis, before ripping apart circuitry to affect a fix. It is usually better to be sure that the high EVM is coming from a power control problem than to assume the causality and be wrong. GSM measurements also benefit from the certainty of time-correlated markers. Understanding exactly which transmission packet represents which EVM measurement is helpful in many diagnostic situations.
Let us now look at how to extend the time correlated multi-domain analysis beyond the RTSA to minimize integration time.
Figure 5.W-CDMA power control behavior. The constellation display in the lower right shows error due to a power spike shown in the power vs. time display in the upper left.
Figure 6.Spectrogram, EVM, constellation, and phase error of a hopping GSM signal.
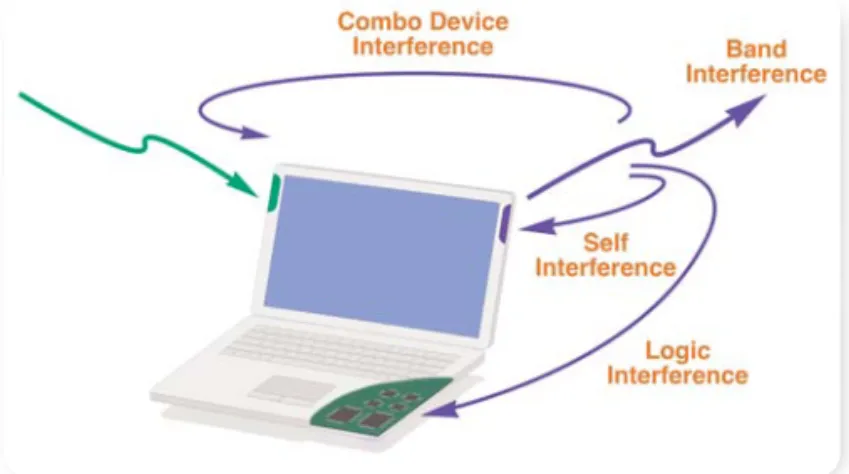
WLAN Combo Device Interference The enhanced connectivity and performance of combining WLAN with other wireless links such as 3G cellular standards and Bluetooth are rapidly making the ‘combo device’ a popular design choice. Combo devices incorporate multiple communications protocols into a single physical package, often using shared RF and DSP components.
Unfortunately, when combining multiple wireless systems into a single device, the potential for interference is great.
WLAN and Bluetooth packet collisions in a laptop computer for example, can be particularly trouble-some. This well-known problem arises because WLAN and Bluetooth signals share the same frequency band. Worse yet, microwave ovens also operate in that same band. The close physical proximity of a Bluetooth transmitter to a WLAN receiver can easily create interference large enough to jam the WLAN. The mechanism of receiver jamming is often difficult to determine.
The asynchronous nature of these RF packet signals makes capturing and analysis of the interference difficult. Searching long, randomly captured records for packet collisions can be time consuming. Compounding the problem, some modern Media Access Controllers (MACs) can be set up so packet transmission times are coordinated between WLAN and Bluetooth. This necessitates an RF validation to assure proper functionality.
The frequency mask trigger makes it easy to understand these elusive events. To observe packet collisions or microwave oven interference, a frequency mask is set up to exclude the narrower of the two signals. When a signal penetrates the mask, the analyzer triggers and reliably captures the interferer as shown in Figure 8. Such triggering ability is useful both in the development laboratory, for optimizing data throughput by
coordinating MAC timing, and in the field, where interference issues can hamper successful technology deployments.
Figure 7.Modes of combo device interference.
Figure 8.Collisions between Bluetooth, WLAN, and microwave oven captured with frequency mask trigger and spectrogram.
Once we have triggered on the signal and captured it into memory, the multi-domain analysis capability of the RTSA can be used to thoroughly characterize and troubleshoot problems. In Figure 9, the RTSA automat-ically detects the modulation type of each burst (CCK 11M, OFDM 24M, or OFDM 54M) and shows plots of power vs. time, power vs. frequency, numerical EVM results, and a constellation display. Figure 10 shows another view of the same signal with spectrogram, EVM vs. time, numerical EVM results, and a constellation display. This in-depth analysis capability makes it easy to find and diagnose problems in the combo device.
Software Defined Radio Integration The Software Defined Radio (SDR) is a popular approach that is being adopted in many military and commercial systems. With logic speeds now supporting the widest bandwidth signals, nearly all new wireless designs opt for the SDR approach, whose benefits include circuit stability, digital precision, and manufacturing repeatability.
Unfortunately, the SDR radio is not all software, and might be more aptly named the software-defined modem. Most SDRs still incorporate a great deal of analog hardware. Converting the base-band digital signal defined in software to a high frequency, high power microwave signal still requires dedicated special purpose analog hardware. Interfacing the general purpose DSP hardware to the dedicated special purpose RF hardware can be a difficult task. Why is the integration of software and hardware so likely to become a problem?
The answer lies partly in the challenge of gaining clear diagnostic insight into a broad range of potential issues. Real-world problems like software bugs, stuck bits, overflow errors, timing issues, analog interference and linearity can baffle the engineer during
system integration. Figure 9.Multi-domain analysis of 802.11g signal shows variations in
power level for a series of bursts and the constellation display and spectrum of a single CCK burst.
Figure 10.Multi-domain analysis of 802.11g signal reveals higher EVM and spectral containment issues during CCK bursts.
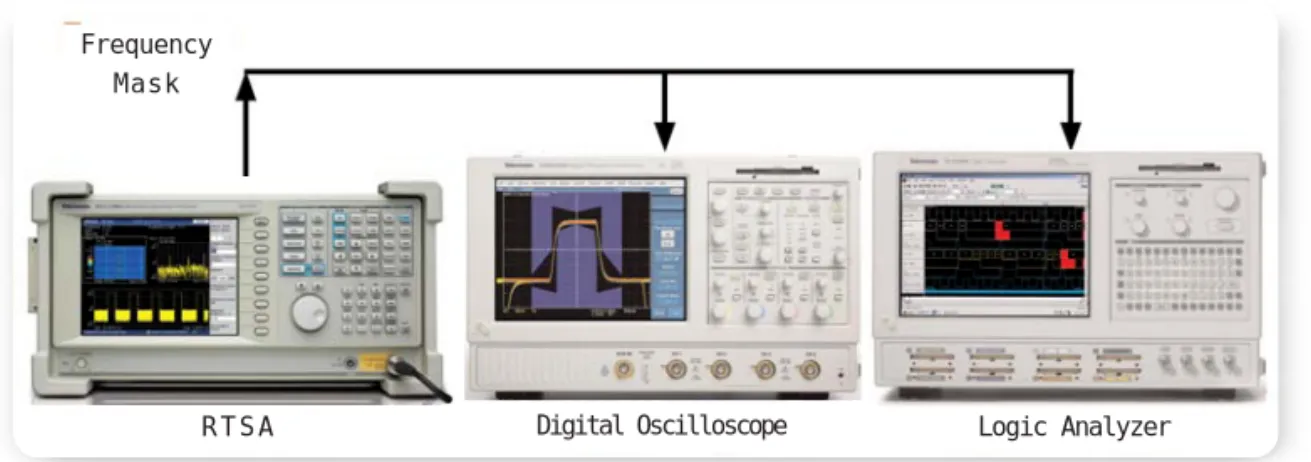
The form of the information changes greatly as it proceeds through the SDR. The information goes from “binary numbers in a DSP chip” to an analog base-band signal, and then it is up converted to a high frequency, high power RF signal in the transmitter. The reverse process occurs in the receiver. Each different form of the information requires different analysis equipment to diagnose issues. DSP performance is analyzed with a logic analyzer, base-band performance is analyzed with an oscilloscope and RF physical layer performance is analyzed with an RTSA.
The challenges of rapidly diagnosing and addressing the integration issues of an SDR have never been
Fortunately, the frequency mask trigger offers a new approach to rapidly providing engineers with the troubleshooting insights necessary for a speedy integration. RF packet signals must be coordinated with base-band and digital logic information to validate designs. Precise time correlation of digital, base-band and RF measurements removes uncertainty and provides engineers with more reliable insights into the causality of signal problems.
Using the frequency mask trigger, a digital oscilloscope and a logic analyzer, spectral events can be time correlated for RF, base-band and DSP troubleshooting. The RTSA’s frequency mask trigger can initiate a data Figure 11.The frequency mask trigger is used to time correlate other instruments.
Figure 12.RTSA, TDS, TLA screenshots.
Logic Analyzer Digital Oscilloscope
R T S A Frequency
In the example in Figure 13, a frequency mask was used to cause the RTSA to trigger on RF bursts with sidebands that did not meet system requirements. Based on the seamless capture of several consecutive bursts, it is evident that the EVM of the burst that violated the spectral mask is much higher than the EVM of the other transmitted bursts.
In turn, the trigger output of the RTSA can be used to simultaneously trigger a high-speed oscilloscope and logic analyzer. Thus the oscilloscope provides base-band signal information and the logic analyzer provides DSP algorithm information at the precise moment the RF anomaly occurs. This complete time correlated multi-domain picture of the SDR allows diagnosis of complex real-world problems with certainty. Unwanted Modulation
Another a significant problem for many RF systems is unwanted modulation becoming coupled into the primary signal. In a real-world device, the practical issues with preventing undesirable interactions between signals can consume a significant percentage of the total product development time.
Time correlated multi-domain analysis is often the best way to positively identify whether the desired modulation is being corrupted by an unwanted signal. Take for example a 16 QAM signal with an undesirable Amplitude Modulation (AM) component. If we compare the power versus time, constellation diagram and EVM versus time, all clearly show an unintentional sinusoidal AM component.
The clarity of insight into the unwanted impairment can only be gained by using time-synchronous information from all three domains. For instance, a constellation diagram shows an AM component, but it takes the EVM versus time display domain to show that it is a sinusoidal interferer that is causing the unwanted modulation.
Similarly, Figure 15 shows an FSK signal that is not cleanly transmitting the desired modulation. Using the frequency versus time display, the impairment is clearly viewed, and from the overshoot and ringing it is clear the signal is not being adequately filtered. Placing markers on events in the spectrogram moves the analysis window from burst to burst, and the time-correlated domains can be used to confirm that the Figure 13.Measuring BPSK constellation and EVM of the problematic
burst after triggering on its frequency sidebands.
Microphonics and Phase-Hits
Digital wireless data links often are susceptible to bursts of data errors from internal components that exhibit microphonics or phase-hits.
Microphonics are the transformation of mechanical or audio energy into electrical signals, similar to an audio microphone. Very short electrical wavelengths make it relatively easy to modulate RF and microwave signals by small changes in mechanical length. Thus audio vibrations can be translated into unwanted modulation. Many high frequency components exhibit this phenomenon, with oscillators being among the most troublesome.
Similar to microphonic sensitivity, phase-hits are an abrupt, unintentional change in the phase of the microwave signal. There are a variety of physical phenomena that can create a phase hit.
Microphonics and phase-hit transients, usually on the local oscillator, can create long error bursts that are difficult to remove with forward error correction (FEC).
microphonic and phase-hit transients. Encrypted data links and highly bandwidth-efficient modulations do not tolerate microphonic error bursts well either. In general, these unwanted signal transients plague systems that carry high data rates with slow re-synchronization times.
Microphonics and phase hits can be generated from unusual interactions between wireless links and their environment. Equipment door slams, the afternoon freight train rolling by, aircraft vibration, voice pickup and rockets have all been known to create microphonic disturbances. Similarly, thermal expansion, piezoelectric effect and phase state changes, among others, have been known to create phase-hits. These transient phenomena can be exceedingly difficult to identify in many systems and can bring project progress and production to a halt quickly.
To identify the source of these unwanted modulation transients, test equipment needs the special ability to watch the signal spectrum, possibly for long periods of time, and trigger on the rare event to capture it into Figure 15.FSK signal requiring additional filtering to smooth out
frequency transitions and provide better spectral containment.
Middle East, Asia and North Africa +41 52 675 3777
The Netherlands 090 02 021797
Norway 800 16098
People’s Republic of China 86 (10) 6235 1230
Poland +41 52 675 3777
Portugal 80 08 12370
Republic of Korea 82 (2) 528-5299
Russia, CIS & The Baltics 7 095 775 1064
South Africa +27 11 254 8360
Spain (+34) 901 988 054
Sweden 020 08 80371
Switzerland +41 52 675 3777
Taiwan 886 (2) 2722-9622
United Kingdom & Eire +44 (0) 1344 392400
USA 1 (800) 426-2200
USA (Export Sales) 1 (503) 627-1916 For other areas contact Tektronix, Inc. at: 1 (503) 627-7111 Updated November 3, 2004
For Further Information
Tektronix maintains a comprehensive, constantly expanding collection of application notes, technical briefs and other resources to help engineers working on the cutting edge of technology. Please visit www.tektronix.com
Copyright © 2004, Tektronix, Inc. All rights reserved. Tektronix products are covered by U.S. and foreign patents, issued and pending. Information in this publication supersedes that in all previously published material. Specification and price change privileges reserved. TEKTRONIX and TEK are registered trademarks of Tektronix, Inc. All other trade names referenced are the service marks, trademarks or registered trademarks of their respective companies.
11/04 FLG/BT 37W-18401-0