MIDDLE SCHOOL TEACHERS’ PERCEPTIONS OF STUDENTS’ ABILITY AS PREDICTORS OF HIGH SCHOOL HONORS COURSE ENROLLMENT AMONG AFRICAN
AMERICAN YOUTH
Katherine Aidan Perkins
A thesis submitted to the University of North Carolina at Chapel Hill in partial fulfillment of the requirements for the degree of Master of Arts in Psychology and Neuroscience.
Chapel Hill 2015
ii © 2015
iii ABSTRACT
Katherine Aidan Perkins: Middle School Teachers’ Perceptions of Students’ Ability as Predictors of High School Honors Course Enrollment among African American Youth
(Under the direction of Beth Kurtz-Costes)
Teachers’ expectations are related to students’ subsequent academic achievement, a phenomenon known as teacher expectancy effects. I examined the relationships between teachers’ perceptions of students’ ability, as well as expectations for students’ educational attainment, and students’ high school honors math course enrollment among 382 African
iv
TABLE OF CONTENTS
LIST OF TABLES...………v
LIST OF FIGURES...……….vi
INTRODUCTION…...………1
Advanced Math Course Opportunities………...…2
Teacher Perceptions and Black Students’ Enrollment in Advanced Math Courses…...4
Gender Differences in Teacher Perceptions of Math Ability……….………....6
The Current Study……..………...8
METHOD………...………...9
Participants…..………...……….9
Measures….………..10
Procedure.………….….………..…….11
RESULTS………13
DISCUSSION………..16
The Accuracy of Teacher Perceptions……….……….16
Gender Differences in Teacher Expectations…….………..18
Individual-Environment Fit and Teacher Recognition….…...………20
TABLES……….………...21
v
vi
LIST OF TABLES
Table 1- Number of Honors Math Courses in High School,
Teacher Perceptions, and Teacher Expectations for Boys and Girls……….20
Table 2- Regression Predicting Honors Math Course Enrollment
From Seventh Grade Math Teachers’ Perceptions of Students’ Ability…………21
Table 3- Regression Predicting Honors Math Course Enrollment Using
Grade 10 Math Teachers’ Perceptions of Students’ Math Ability……….22
Table 4- Regression Predicting Honors Math Course Enrollment
from Grade 7 Math Teachers’ Educational Attainment Expectations………23
Table 5- Regression Predicting Students’ Honors Math Course Enrollment
vii
LIST OF FIGURES
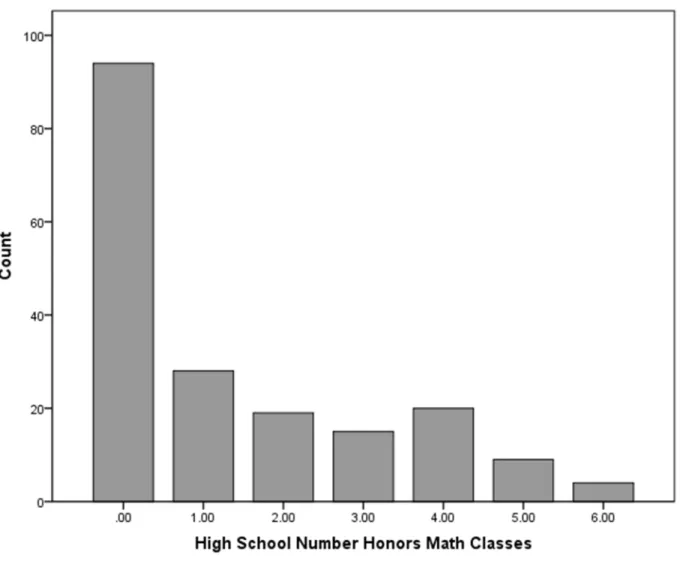
Figure 1- Frequency Distribution for the Number of Honors Math
1
INTRODUCTION
According to a survey conducted by the National Center for Education Statistics (NCES, 2009), European American and Asian American students are at least twice as likely as African American students to take math classes in high school that are considered academically rigorous. Beginning as early as elementary school, the practice of academic tracking in the United States is one factor that limits students from reaching rigorous courses in their high school years. African American high school students are significantly less likely than European American students to be in a college math track (Ballon, 2008). These disparities are reflected in postsecondary success. For example, in a statewide longitudinal study conducted in Florida beginning when students were in the eighth grade, Honors and AP course enrollment during high school was linked to enrollment in and completion of a 4-year-college education (Long, Conger, & Iatarola, 2012).
Mathematics course taking in particular is a strong predictor of postsecondary
educational attainment, as students who enroll and do well in AP and honors math courses in high school are more likely to graduate from college and to pursue careers in science,
technology, engineering, or mathematics than students who do not take such courses (Burdman, 2000; Chen 2009). Many factors have been identified as influences on students’ course
enrollment choices, including students’ expectancies for success and subjective value of a
2
students’ intent to pursue math (Good, Rattan, & Dweck, 2012). Teachers are in a position to foster and support the development of each of these factors to an extent. The focus of the current investigation is an exploration of the relationship between teachers’ ability perceptions and educational attainment expectations of their students and students’ high school advanced mathematics course enrollment among African American youth.
Advanced Math Course Opportunities
Within the educational system in the United States, elementary and middle schools are often points of differentiation for students in mathematics, with some students enrolling in tracks that will lead them to advanced courses, such as calculus, while others may take tracks focused on specific occupational knowledge, and others still may be placed in remedial or slower-paced courses. Tracking criteria vary by school, and some schools do not have formally named tracking systems, but upward mobility is usually difficult if not impossible by the high school years. State high school graduation requirements vary, but most states have some provision for an
occupational track, on which students may complete Algebra 1 or Geometry as the highest level of math by Grade 12; a core track on which students complete at least one course above Algebra II by Grade 12; and an advanced track on which students will complete studies in calculus by Grade 12 (Center for Public Education, 2013). Taking algebra in the eighth grade or earlier is positively associated with high school honors math tracking (Ballon, 2008).
3
units of math, and 94% have reached at least pre-calculus and taken an average of three total AP courses (Adelman, 2006). Content and performance standards for these courses are widely variable and by no means equivalent to any kind of standardized “high” level (Barth & Haycock, 2004). Schools have some discretion in classifying courses as “Honors” or “AP.” These
designations serve as an imperfect proxy for course rigor.
Teachers recommend students to math tracks, although parents and students may weigh in on such decisions. School-specific tracking criteria distinctions have been made between the use of “objective” criteria (e.g., achievement and aptitude test scores) and “subjective” criteria such as teacher, parent, or peer nominations. Barab and Plucker (2005) argue that ability is not possessed, but part of an individual-environment transaction. High scores on both “objective” and “subjective” criteria would indicate optimal conditions under which students may actualize their potential. Teachers may recognize a low-performing student as motivated and a good fit for advanced coursework ahead and may alternatively see a high achieving student as lacking in the motivation needed to flourish in a more advanced course. Baldwin (2002) points out that the identification of giftedness requires an understanding of cultural diversity and programming that is inclusive of students of all races, ethnic groups, and family backgrounds. Black boys who begin high school on a high math track take fewer math courses in subsequent years and are more likely to drop to a lower track than White students, even when their test scores indicate they are academically prepared (Riegle-Crumb, 2006). Teachers may be more or less “accurate” in their predictions depending upon whether or not they accurately predict
4
lower in achievement and as higher in aggression than Black boys who did not demonstrate such movement. Such cultural biases may result in fewer referrals to rigorous courses for these
students, compared to students who express dominant culture movement styles.
Teacher Perceptions and Black Students’ Enrollment in Advanced Math Courses
Much research has examined student competence and performance in relation to math course enrollment and success. Recently, researchers have found that these factors are indirectly related to students’ math identities, through associations with interest and recognition (Cribbs, Hazari, & Sadler, 2015). Recognition is conceptualized as how students perceive others view them in math (Cribbs et al., 2015). Respected adult influences in a student’s life are in a prominent position to provided math recognition. Middle school teachers provide direct math recognition in classrooms, and influencing students’ math identities in middle school may proximally influence high school math course enrollment.
Personal relevance and positive math attitudes are also related to students’ enrollment in advanced math courses (Davis-Keane, 2005; Maltese & Tai, 2011). Students who found utility in math courses and their imagined future roles were more likely to concentrate on STEM domains in high school than students who viewed math as less useful (Maltese & Tai, 2011). The
aforementioned research suggests that students who establish a mathematics identity in high school are more likely to pursue math and carry those skills forward into postsecondary education. Because teachers work with students directly, they are called upon to make recommendations for advanced course enrollment. Both formally and informally, teachers’ perceptions of students can be critical for student success.
Teachers’ beliefs about their students’ ability to succeed are related to students’
5
Harber, 2005; Rosenthal, 2010; Tennenbaum & Ruck, 2007). Effect sizes are generally small but consistent. The relationship between teacher perceptions and student achievement is
bi-directional, making it difficult to isolate and measure the effects of teachers’ expectancies on student academic outcomes in a substantive and qualitative manner. Students’ prior achievement and class performance influence teachers’ perceptions, but teachers’ own stereotypes and
prejudices also influence students’ achievement progress (Ambady, Shih, Kim, & Pittinsky, 2001; Jussim, Eccles, & Madon, 1996; Reyna, 2008). Investigating the correlates of these expectancy effects conditional on prior success in math may help researchers, principals, and teachers identify goals for fostering the development of math skills for students from
underrepresented backgrounds.
6
Teacher expectations are deemed to create a self-fulfilling prophesy only if a student’s actual achievement is changed. A review on teacher expectancy effects by Jussim and Harber (2005) highlights that stigmatized social groups in particular may experience self-fulfilling prophecies. Overall teacher expectancy effect sizes are d = .1 to .2, while effect sizes among African American students range d = .4 to .6 (Jussim, Eccles, & Madon, 1996). Follow up analyses revealed that differences in teachers’ perceptions of groups mirrored actual group differences in achievement (Madon, Jussim, Keiper, Eccles, Smith, & Palumbo, 1998). Jussim and Harber (2005) conclude that expectancy effects tend to be small and tend to dissipate over time.
The mechanisms through which teachers’ expectations and perceptions may be communicated to students on a day to day basis have been studied through observational
methods. A recent meta-analysis revealed that teacher behaviors differ according to student race, with teachers directing more positive speech to European American students than toward African American students (Tenenbaum & Ruck, 2007). Even though teachers’ negative speech was generally equal across racial groups, a lower frequency of positive statements may influence students’ perceptions of their own ability and belonging in an advanced math class, as well as their investment in the coursework. The effects of teachers’ perceptions and expectations may be subtle and unintentional but ubiquitous in students’ educational experiences and of great
consequence while students are making enrollment decisions. Given the evidence for differential teacher expectancy effects, teachers’ beliefs and perceptions are implicated in relation to African American students’ advanced course enrollment.
7
Teachers’ perceptions of students show stereotyped patterns. Data from a national longitudinal study of students from kindergarten through Grade 5 indicate that teachers tend to rate boys as better at math than girls after accounting for both achievement and classroom behavior (Robinson-Cimpian, Lubienski, Ganley & Copur-Gencturk, 2014). However, in a nationally representative study of high school students, Reigle-Crumb and Humphries (2012) found different results in teachers’ biases at the intersection of race and gender. Students on three separate math tracks were rated by teachers as being in a class that ranged from “too easy” for the student to “too difficult” for the student. Disparities in teacher perceptions of ability tended to favor European American males over minority students of both genders, with teachers tending to believe that math is easier for European American males than other groups. When controlling for prior achievement, teachers’ ratings of European American males were better than for European American females at all math levels. These gender effects disappeared among African American and Hispanic students, though members self-identified as such were far less likely to be in the advanced math track (Reigle-Crumb & Humphries, 2012).
8
perceptions of boys and of girls, as well as the extent to which teachers’ perceptions were linked to subsequent math course enrollment for both boys and girls.
The Current Study
The present study was guided by two goals. The first goal was to examine teachers’ perceptions of students’ ability and expectations for student educational attainment as predictors of students’ subsequent enrollment in high school honors math courses. I tested the hypothesis that teachers’ expectations and perceptions would significantly predict later course enrollment above and beyond students’ prior math achievement. This hypothesis is consistent with research on teacher expectancy effects and with research suggesting that student-perceived adult
9 METHOD
Participants
Data for the current study were drawn from the Youth Identity Project, a longitudinal study focused on the development of achievement motivation among African American youth. The project began when students were in Grade 5, with additional waves of data collected in Grades 7, 10, and 12. Families were recruited from 7 urban, majority-Black elementary schools (60-97% Black student population) in the southeast United States. Fifth grade data were
collected in three cohorts, in the 2002-2003, 2003-2004, and 2004-2005 school years. Data for the present study were drawn from Wave 2, at which time students were attending 17 urban or suburban middle schools (ranging 27-98% Black student population), and from Wave 3, at which time students were attending 21 urban or suburban high schools (27-93% Black student
population). High school transcripts were collected from schools after Wave 4.
10
parent income. Average income was $30,000-40,000 for Grade 5 participants compared to $40,000-50,000 at Grade 12, F(2, 84) = 9.96, p < .05. Average parent education for the entire sample was some technical school beyond high school and did not differ for students retained compared to students in Grade 5.
Wave 2 included 61 teachers, reporting 1 to 37 years of experience teaching, and Wave 3 included 72 teachers (40 women, 32 men) reporting 1 to 34 years of experience. Thirty-five percent of students had math teachers reporting three or fewer years of teaching experience when they were in Grade 7, and 29% of students had math teachers reporting three or fewer years of teaching when they were in Grade 10. In both Grades 7 and 10, 39% of students had math teachers who self-identified as Black or African American, 59% of students had teachers who identified as White or European American, and 2% of students had teachers who self-identified as any other race.
Measures
Teachers’ perceptions of students’ ability. Math teachers rated each student’s
competence in mathematics compared to other students in the same age group on two items (“In Math this student is:”; “In terms of smartness/general intelligence, this student is:”). Response options ranged from 1 (far below average) to 7 (far above average). A third item was included in the calculation of teachers’ perceptions on a scale from 1= very difficult, 4=average to 7= very easy (“This student finds math:”). The average of the three responses was calculated to create a single score to reflect teachers’ perceptions of each student’s math competence. Alpha
reliabilities for this scale in the present sample were .90 at Wave 2 and .95 at Wave 3. Teacher’s educational attainment expectations. Math teachers’ expectations for
11
this student to go in school?” Response options were: 1 = some high school, 2 = finish high school, 3 = some college, 4 = finish community college, 5 = finish a 4-year degree, 6 = master’s degree, 7 = doctoral degree. Comparable single-item measures are frequently used to assess parental educational attainment expectations (e.g. MADICS; Eccles, 1997).
Students’ enrollment in high school honors math courses. The summer after students
graduated from high school, participating schools provided high school transcripts of
participating students to the research team. These transcripts were used to identify the number of honors (e.g., Honors Algebra), Advanced Placement (e.g., AP Calculus), and International Baccalaureate (e.g., Mathematics HL) math courses students enrolled in and completed during their high school years. Student grades were also collected for data analyses.
Students’ math achievement. Because students’ concurrent academic achievement is
an established correlate of teacher expectations for students’ future attainment, students’ Grade 7 and Grade 10 end-of-year math grades were obtained from middle school and high school
transcripts and were included as covariates in the analyses. When students took more than one math course in a given year, the grades, which were on a scale from zero to 100, were averaged.
Parent Education. Parent education was included as a covariate, as an established
correlate of student enrollment in advanced courses. For the 301 student participants at Wave 2, 258 parents responded to survey measures. Parents reported their level of education completed at the time of the survey on a 9-point scale (1 = less than high school; 9 = doctoral degree such as PhD, MD, or JD).
Procedure
12
parent permission was required for participation. Students returned signed permission forms to the research team through the school. Parents were given the option to decline participation, consent to participate and for their child to participate, or consent for their child to participate without participating themselves. In addition to permitting their children to complete survey measures, parents were also given the option to allow or decline access to the research team for transcript records for their child. Students assented and parents gave permission in each wave of the study. In Grades 7 and 10, students provided the names of their math teachers. Teachers were contacted by the research team and provided informed consent for their participation.
13 RESULTS
Separate multiple regression models were estimated to test the relationships between teachers’ perceptions of students’ ability within the domain of mathematics in Grade 7 and Grade 10 and subsequent high school honors math course enrollment. Similar multiple regression models were estimated to test the relationship between teachers’ educational attainment
expectations of students in Grade 7 and Grade 10 and students’ high school honors math course enrollment. The number of honors, AP, and IB math courses that students took in high school was used as the dependent variable in these analyses. Students had graduated from high school when transcript records were obtained, and therefore course information included data from students’ four completed years of high school. The range of honors course enrollment was zero to six courses. A frequency distribution is displayed in Figure 1 and a summary of means and standard deviations appears in Table 1.
Teachers’ Perceptions of Students’ Math Ability and Students’ Subsequent Math Course
Enrollment
14
The model predicting high school honors math course enrollment was significant for the regression using Grade 7 math teacher perceptions F(2, 81) = 12.83, p < .001 (see Table 2). Grade 7 math grades and Grade 7 math teachers’ perceptions were significantly related to honors math course enrollment in high school. The Gender by Teacher Perception interaction was not significant, indicating that Grade 7 teachers’ perceptions were equally important for boys’ and for girls’ honors math course enrollment. For the regression using Grade 10 math teacher perceptions, the overall model predicting high school honors math course enrollment was significant, F(2, 85) = 7.07, p < .001 (see Table 3). However, the only significant predictor variable was Grade 10 math grades.
Teachers’ Educational Attainment Expectations and Students’ Course Enrollment
Multivariate regression analyses were run to test hypotheses regarding the relationship between the teachers’ educational expectations and students’ honors math course enrollment in high school. The model was significant for the model using Grade 7 math teachers’ expectations F(2, 79) = 14.64, p < .001 (see Table 4). Middle school math grades were a significant predictor of high school honors math course enrollment, as well as seventh grade teachers’ educational attainment expectations, explaining 45% of the variance in honors math course enrollment. The overall model predicting high school honors math course enrollment was also significant for the model using Grade 10 math teacher expectations F(2, 85) = 7.06, p < .001 (see Table 5). High school teachers’ expectations and high school grades were significant predictors of high school honors course enrollment. No significant Gender by Teacher Expectation interaction was present.
15
however, gender differences approached significance, favoring girls. If students were enrolled in multiple math courses in a single year, grades attained in a single year were averaged. Boys and girls did not differ in the number of honors math courses taken in high school. Contrary to expectations, neither middle school nor high school math teachers’ perceptions of students’ math competence differed by student gender; however, math teachers’ expectations for educational attainment were significantly higher for girls than for boys in both Grade 7 and Grade 10, F(1,252) = 5.62, p =.02 and F(1,252) = 7.70, p =.001.
Summary
16
DISCUSSION
The purpose of this study was to investigate the relationship between math teachers’ perceptions of students’ ability and African American students’ math course taking in high school. Drawing upon the literature on teacher expectancy effects, I hypothesized that teachers’ perceptions of students’ ability and educational expectations for students would significantly predict high school honors math course enrollment above and beyond prior student achievement among African American youth. This hypothesis was supported for Grade 7 teachers’
perceptions of ability and for both Grade 7 and Grade 10 teachers’ educational attainment expectations. Teachers’ perceptions of students’ math ability did not differ for girls compared to boys, although teachers held higher educational expectations for girls than for boys in both Grade 7 and Grade 10. No gender differences were found in the strength of the relationship between teacher perceptions and subsequent math course enrollment. These results raise
questions about the accuracy of teachers’ perceptions as well as effects of teachers’ perceptions on student motivation on a micro-level. Students make small decisions each day reciprocally influenced by the ways in which teachers communicate their own expectations and perceptions. Findings related to gender differences and future directions for research will also be discussed.
The Accuracy of Teacher Perceptions
17
ability; another interpretation is that teachers may accurately predict student-environment fit for success. The findings presented here are correlational, and further research is needed to
investigate the mechanisms through which teachers’ perceptions and expectations could causally influence student motivation and behaviors, including their choices about advanced course enrollment.
Black boys are least likely of all race and gender groups to take advanced placement (AP) courses for which they are academically qualified. Only about 25% of Black boys who are qualified to take an AP course actually enroll in the relevant course offered at their school (College Board, 2014). Teachers’ knowledge of a student’s social group is related to teacher’s perceptions, which is in turn related to teachers’ recommendations for advanced course
18
Research examining the intersection of student identities, specifically race, gender, and socioeconomic status, indicates that fostering students’ strengths requires identifying diverse types of social and cultural capital (Strayhorn, 2010). For example, Strayhorn (2010) found that pre-college outreach programs and involvement in leadership activities in high school was highly related to African American boys’ academic success in college. The effects were greatest for boys from a low SES background. Schools may better ensure student success by recognizing and addressing diverse needs and strengths of students from many backgrounds.
Gender Differences in Teacher Expectations
No gender differences in the relationship between teachers’ perceptions and later honors math course enrollment were found, indicating that both boys’ and girls’ decisions are
comparably related to teachers’ perceptions. Teachers also had comparable views of girls’ and boys’ math ability, contrary to the gender discrepancy held in educational expectations. The implications of this finding raise questions about teachers’ reasoning regarding ratings of student ability and educational expectations. Shedding light on why teachers see their students as equally capable in math yet rate girls as more likely to advance farther in school than boys would be an important future direction to pursue to uncover the causes and consequences of gendered expectations among teachers of African American students. The present study did not focus on teachers’ perceptions of verbal abilities, which may contribute to the gendered difference in attainment expectations that favor girls.
19
problem are a particularly concerning barrier to academic success. Research indicates teachers tend to misunderstand or misinterpret Black boys’ classroom behaviors, indicating fewer competencies and more stereotypically negative qualities for Black students than for White students (Pigott & Cowen, 2000). Classroom emotional expression related to coping is another potentially important narrative index related to academic success. For example, teachers tend to negatively frame Black boys’ anger (Thomas, Coard, Stevenson, Bentley, & Zamel, 2009). Long-term teacher expectation effects may compound educational disparities. Just as the effects of teachers’ expectations may perpetuate disparities, teachers’ high expectations could have a positive effect for students. Further qualitative and quantitative work would be beneficial to understanding why and how these expectations are shaped, from the perspectives of both
students and teachers. Understanding these factors could help illuminate the mechanisms related to achievement motivation consequences such as course enrollment.
In spite of the gender discrepancy in teachers’ expectations for educational attainment, boys and girls enrolled in a comparable number of honors math courses in high school, and math course grades were not significantly different for boys and girls in Grade 7 or Grade 10. These results are contrary to national norms showing that African American girls outperform African American boys on many academic indices (NCES, 2009). Further research is needed to
understand the conditions under which disparities occur to a greater or lesser extent. Students in this study were enrolled in 17 urban and suburban schools. Although I was not able to run
20
Individual-Environment Fit and Teacher Recognition
Individual differences in students’ responses to differential treatment are also important to consider as a mechanism through which teachers’ expectations are related to student
achievement. Among middle school students, prior research indicates that how students perceive that their parents and teachers view them in relation to math influences their math competence and performance (Cribbs, Hazari, & Sadler, 2015). Teacher recognition may manifest as positive feedback, while students’ perceptions and attitudes toward that feedback influences their
21 Table 1
Number of Honors Math Courses in High School, Teacher Perceptions, and Teacher
Expectations for Boys and Girls
Boys Girls
Variable Mean (SD) Mean (SD)
Number of Honors Math Courses 1.37 (1.94) 1.38 (1.65)
Grade 7 Teacher Perceptions 4.23 (1.31) 4.23 (1.37)
Grade 7 Teacher Expectations* 3.59 (1.82) 4.11 (1.69)
Grade 10 Teacher Perceptions 3.66 (1.41) 3.94 (1.31)
Grade 10 Teacher Expectations** 3.39 (1.63) 3.98 (1.42)
Grade 7 Math Grades 75.07 (12.73) 81.92 (10.34)
Grade 10 Math Grades 73.07 (12.73) 76.97 (11.81)
Parent Education 5.39 (2.21) 5.44 (2.03)
22 Table 2
Regression Predicting Honors Math Course Enrollment From Seventh Grade Math Teachers’ Perceptions of Students’ Ability (N = 99)
Variable B SE B β
Grade 7 Math Teacher’s Perception .55 .16 .43**
Grade 7 Math Grade .06 .02 .33**
Gender .99 1.20 .27
Grade 7 Teacher Perception x Gender -.29 .26 -.39
Parent Education
R2 = .45
.02 .06 .03
23 Table 3
Regression Predicting Honors Math Course Enrollment Using Grade 10 Math Teachers’ Perceptions of Students’ Math Ability (N = 124)
Variable B SE B β
Grade 10 Math Teacher Perception .16 .19 .11
Grade 10 Math Grade .08 .02 .41**
Gender -1.09 1.17 -.28
Grade 10 Teacher Perception x Gender .28 .28 .30
Parent Education .02 .06 .03
R2 = .299
24
Regression Predicting Honors Math Course Enrollment from Grade 7 Math Teachers’ Educational Attainment Expectations (N=87)
Variable B SE B β
Grade 7 Math Teacher’s Educational Expectation for Student
.48 .12 .39**
Grade 7 Math Grade .07 .02 .36**
Child Gender .08 .36 .02
Grade 7 math teacher expectation x gender
-.07 .18 -.04
Parent Education .004 .06 .007
R2 = .49
25 Table 5
Regression Predicting Students’ Honors Math Course Enrollment Using Grade 10 Teachers’ Educational Attainment Expectations (N=107)
Variable B SE B β
Grade 10 Math Teacher’s Educational Expectation for Student
.51 .16 .37**
Grade 10 Math Grade .07 .02 .34**
Gender .12 .36 .03
Grade 10 math teacher expectation by gender
-.03 .25 -.01
Parent Education .002 .06 .004
R2 = .37
26
27
REFERENCES
Adelman, C. (2006). The toolbox revisited: Paths to degree completion from high school through
college. Washington, DC: Government Printing Office; US Department of Education,
Institute for Education Sciences.
Ambady, N., Shih, M., Kim, A., & Pittinsky, T. L. (2001). Stereotype susceptibility in children: Effects of identity activation on quantitative performance. Psychological Science, 12(5), 385-390.
Baldwin, A. Y. (2002). Culturally diverse students who are gifted. Exceptionality, 10, 139-147. Ballón, E. G. (2008). Racial differences in high school math track assignment. Journal of Latinos
and Education, 7(4), 272-287.
Barth, P., & Haycock, K. (2004). A core curriculum for all students. Double the Numbers:
Increasing Postsecondary Credentials for Underrepresented Youth, 35-45.
Bleeker, M. M., & Jacobs, J. E. (2004). Achievement in math and science: Do mothers' beliefs matter 12 years later?. Journal of Educational Psychology, 96(1), 97.
Bouchey, H. A., & Harter, S. (2005). Reflected appraisals, academic self-perceptions, and math/science performance during early adolescence. Journal of Educational Psychology, 97(4), 673.
Burdman, P. (2000). Extra credit, extra criticism. Black Issues in Higher Education, 17(18), 28-33.
Center for Public Education (2013). Detail on mathematics graduation requirements from public high schools, by state. (2013, June 12). Retrieved September 1, 2015, from
http://www.centerforpubliceducation.org.
Chen, X. (2009). Students who study science, technology, engineering, and mathematics (STEM) in postsecondary education. Stats in Brief (NCES 2009-161). Washington, DC: U.S. Department of Education.
College Board (2014). Ten years of advanced placement exam data show significant gains in access and success; Areas for improvement. Retrieved from
https://www.collegeboard.org/releases/ 2014/class-2013-advanced-placement-results-announced.
Cribbs, J. D., Hazari, Z., Sonnert, G., & Sadler, P. M. (2015). Establishing an explanatory model for mathematics identity. Child Development.
Davis-Kean, P. E. (2005). The influence of parent education and family income on child achievement: the indirect role of parental expectations and the home
28
Evans, A. B., Copping, K. E., Rowley, S. J., & Kurtz-Costes, B. (2011). Academic self-concept in Black adolescents: Do race and gender stereotypes matter?. Self and Identity, 10(2), 263-277.
Ferguson, R. F. (2003). Teachers' perceptions and expectations and the black-white test score gap. Urban Education, 38(4), 460-507.
Glock, S., Krolak-Schwerdt, S., & Pit-ten Cate, I. M. (2014). Are school placement
recommendations accurate? The effect of students’ ethnicity on teachers’ judgments and recognition memory. European Journal of Psychology of Education, 1-20.
Good, C., Rattan, A., & Dweck, C. S. (2012). Why do women opt out? Sense of belonging and women's representation in mathematics. Journal of Personality and Social
Psychology, 102(4), 700.
Jussim, L., Eccles, J., & Madon, S. (1996). Social perception, social stereotypes, and teacher expectations: Accuracy and the quest for the powerful self-fulfilling prophecy. Advances
in Experimental Social Psychology, 28, 281-388.
Jussim, L., & Harber, K. D. (2005). Teacher expectations and self-fulfilling prophecies: Knowns and unknowns, resolved and unresolved controversies. Personality and Social
Psychology Review, 9(2), 131-155.
Kurtz-Costes, B., Rowley, S. J., Harris-Britt, A., & Woods, T. A. (2008). Gender stereotypes about mathematics and science and self-perceptions of ability in late childhood and early adolescence. Merrill-Palmer Quarterly, 54(3), 386-409.
Kesner, J. E. (2002). The personal side of teaching: Perceptions of teacher-child relationships. Journal of Early Education and Family Review, 9(5), 29-40.
La Vonne, I. N., Audrey, D. M., Webb-Johnson, G., & Bridgest, S. T. (2003). The effects of African American movement styles on teachers' perceptions and reactions. The Journal of Special Education, 37(1), 49-57.
Long, M. C., Iatarola, P., & Conger, D. (2009). Explaining gaps in readiness for college-level math: The role of high school courses. Education, 4(1), 1-33.
Madon, S. J., Jussim, L., Keiper, S., Eccles, J., Smith, A., & Palumbo, P. (1998). The accuracy and power of sex, social class and ethnic stereotypes: Naturalistic studies in person perception. Personality and Social Psychology Bulletin, 24, 1304-1318.
29
Martinez, M., & Bray, J. (2002). All over the Map: State Policies To Improve the High School. National Alliance for the American High School, c/o The Institute for Educational Leadership, 1001 Connecticut Avenue NW, Suite 310, Washington, DC 20036.
Matthews, J. S., Kizzie, K. T., Rowley, S. J., & Cortina, K. (2010). African Americans and boys: Understanding the literacy gap, tracing academic trajectories, and evaluating the role of learning-related skills. Journal of Educational Psychology, 102(3), 757.
McKown, C., & Weinstein, R. S. (2008). Teacher expectations, classroom context, and the achievement gap. Journal of School Psychology, 46(3), 235-261.
Passolunghi, M. C., Ferreira, T. I. R., & Tomasetto, C. (2014). Math–gender stereotypes and math-related beliefs in childhood and early adolescence. Learning and Individual Differences, 34, 70-76.
Plucker, J. A., & Barab, S. A. (2005). The importance of contexts in theories of giftedness. Conceptions of Giftedness, 201-216.
Raudenbush, S. W. (1984). Magnitude of teacher expectancy effects on pupil IQ as a function of the credibility of expectancy inductions: A synthesis of findings from 18 experiments.
Journal of Educational Psychology, 76, 85-97.
Reyna, C. (2008). Ian is intelligent but Leshaun is lazy: Antecedents and consequences of attributional stereotypes in the classroom. European Journal of Psychology of Education, 23(4), 439-458.
Riegle-Crumb, C. (2006). The path through math: Course sequences and academic performance at the intersection of race-ethnicity and gender. American Journal of Education, 113(1), 101–122.
Riegle-Crumb, C., & Humphries, M. (2012). Exploring bias in math teachers’ perceptions of students’ ability by gender and race/ethnicity. Gender & Society, 0891243211434614. Robinson-Cimpian, J. P., Lubienski, S. T., Ganley, C. M., & Copur-Gencturk, Y. (2014).
Teachers’ perceptions of students’ mathematics proficiency may exacerbate early gender gaps in achievement. Developmental Psychology, 50(4), 1262.
Rosenthal, R. (2010). Pygmalion effect. Corsini Encyclopedia of Psychology.
Rowley, S. J., Kurtz‐Costes, B., Mistry, R., & Feagans, L. (2007). Social status as a predictor of race and gender stereotypes in late childhood and early adolescence. Social
Development, 16(1), 150-168.
30
academic lives of Black boys. Advances in Child Development and Behavior, 47, 301-332.
Rudman, L. A., & Glick, P. (2001). Prescriptive gender stereotypes and backlash toward agentic women. Journal of social issues, 57(4), 743-762.
Steele, C. M. (1997). A threat in the air: How stereotypes shape intellectual identity and performance. American Psychologist, 52(6), 613.
Strayhorn, T. L. (2010). When race and gender collide: Social and cultural capital's influence on the academic achievement of African American and Latino males. The Review of Higher Education, 33(3), 307-332.
Tang, Joyce. 1997. Evidence for and against the “double penalty”: Thesis in the science and engineering fields. Population Research and Policy Review, 16, 337-62.
Tenenbaum, H. R., & Ruck, M. D. (2007). Are teachers' expectations different for racial
minority than for European American students? A meta-analysis. Journal of Educational Psychology, 99(2), 253.
Van den Bergh, L., Denessen, E., Hornstra, L., Voeten, M., & Holland, R. W. (2010). The implicit prejudiced attitudes of teachers relations to teacher expectations and the ethnic achievement gap. American Educational Research Journal, 47(2), 497-527.
Vanneman, A., Hamilton, L., Anderson, J. B., & Rahman, T. (2009). Achievement gaps: How Black and White students in public schools perform in mathematics and reading on the
national assessment of educational progress (NCES 2009–455). Washington, DC: U. S.
Department of Education.