Implementation and Analysis of Combined Machine
Learning Method for Intrusion Detection System
Bisyron Wahyudi
1, Kalamullah Ramli
2, and Hendri Murfi
31,2
Department of Electrical Engineering, Faculty of Engineering, Universitas Indonesia, Indonesia
3
Department of Mathematics, Faculty of Science, Universitas Indonesia, Indonesia
Abstract—As one of the security components in Network Security Monitoring System, Intrusion Detection System (IDS) is implemented by many organizations in their networks to detect and address the impact of network attacks. Many machine-learning methods have been widely developed and applied in the IDS. Selection of appropriate methods is necessary to improve the detection accuracy in the application of machine-learning in IDS. In this research, we proposed an IDS that we developed based on machine learning approach. We use 28 features subset without content features of Knowledge Data Discovery (KDD) dataset to build machine learning model and are most likely to be applied for the IDS in the real network. The machine learning model based on this 28 features subset achieves 99.9% accuracy for both two-class and multiclass classification. From our experiments using the IDS, we have developed good performance in detecting attacks on real networks.
Keywords— intrusion detection system, preprocessing, feature selection, model selection,
1
Introduction
In the last few decades, information and computer technology with interconnected internet services has become increasingly important in everyday human life. Various ways of network security have been researched and developed to protect information assets and computer network infrastructure. One technique that is often used in network security is Intrusion Detection System (IDS) [1]. Currently, detection mechanism in IDS is divided into two types, i.e., misuse and anomaly detection [2]. Misuse detection is a technique of detecting attacks based on a familiar signature pattern. Whereas anomaly detection is a technique to detect attacks based on anomaly conditions that occur in the network compared to the normal state of the network conditions that have been determined [3]. One technique used in anomaly detection is the use of Machine Learning method, in recognizing network behavior.
The most commonly used conventional IDS today is signature-based (misuse detection). This type of IDS requires much human intervention ranging from identifying attacks, creating signature attacks, and storing these signatures into the database so that it can be used to detect such attacks in the future. As more and more types of new attacks appear on the internet the heavier the human task to keep the system always to be able to detect new types of attacks, which must always update the database with new types of attacks that appear. This results in zero-day conditions, where a new type of attack cannot be detected and infiltrated into the internal network and result in damage to the system [3]. This incident can occur because the new attack signature has not been stored in the database so that new attacks coming into the network are not recognized.
The tasks that human must perform in maintaining the novelty of this signatures database can be achieved more efficiently by applying machine-learning approach. With the machine-learning approach, we only need to provide a set of network data with various conditions suitable for the processed system with a machine-learning algorithm so that found a model that can be used to recognize normal and abnormal network traffic. Furthermore, this machine-learning model that has been built can be used to detect attacks more efficiently and reliably, without having to update the attack database often.
Several studies were conducted to develop machine learning based IDS. Most of the studies were conducted using publicly available datasets such as KDDCUP or NSL-KDD dataset. The use of such datasets for IDS development can result in good machine learning models, but often cannot be implemented on real networks. Some features of these datasets cannot be simply extracted from real network traffic. In this study, we performed an analysis to select features of the KDD dataset that were most likely to be used in developing machine-learning based IDS.
Although there have been many academic studies that reveal the potential of anomaly detection approach better in detecting new types of attacks, until now the widely used commercial/industrial IDS products are signature based (misuse detection). There are still some obstacles in the implementation of anomaly detection technique with machine learning method into the real network, that is a wrong selection of data features and inappropriate method usage [4].
Increasing number of attacks that threaten data security on internet encourage the use of encryption in data communications on the internet. As more and more human needs are turning to digital, a large number of digital services and applications use encryption as the primary method of securing data communications on the internet [5]. Available data show that encrypted Internet traffic increased by 90% per year [6]. NSS Labs predicts that by 2019, 75% of internet traffic will be encrypted [7].
More and more internet services are heavily dependent on encryption mechanisms to ensure their safety. Even encryption technology is also used by Internet crime actors to avoid detection and to secure their malicious activities. The large use of encryption technology in data communications on the internet has resulted in increasingly difficult network security monitoring work. The attack detection system can no longer assume that all data packets on the network can be extracted and investigated easily to detect anomaly within the network traffic [8,9].
use of such datasets for IDS development can result in good machine-learning models with high accuracy, but often cannot be implemented on real networks. Some features of this KDD dataset cannot be easily extracted from actual network traffic. In this study, we analyze to select features of the KDD dataset that are most likely to be used in developing machine learning based IDS and can be implemented in real networks.
The paper is structured as follows: Works related to our research are reviewed in Section 2. Section 3 introduces the methodology of this research in developing machine-learning model based IDS. Experiment and analysis are presented in Section 4. Section 5, concludes this paper.
2
Related Works
In recent year researchers have carried out many researches to develop anomaly-based IDS system using machine learning approach. In contrast to misuse-based intrusion detection that checks for signatures contained in the network packet header, anomaly-based IDS extracts the network data packets to obtain network features/attributes that can be used to detect attacks using machine learning approach. Several machine learning algorithms have been proposed by many researchers. To develop a good machine learning method, some techniques and mechanism need to be implemented in a combination, such as the use of feature and model selection as well as parameter tuning to get the optimal result.
A new method that combines several methods for detecting attacks is proposed by J. Lekha, and Padmavathi Ganapathi. [10] In their research they used improved CART technique for misuse detection and extreme learning machine (ELM) algorithm for anomaly detection. In the misuse detection model, the traffic pattern is classified into the known and unknown attack. Anomaly detection model classifies the not known attack as normal data set and unknown attack to improve the performance of normal traffic behavior. From the experimental results, the method offered by using the NSL-KDD dataset shows that the hybrid intrusion detection method proposed can improve performance in detecting attacks regarding training time, testing time, false positive ratio and detection ratio. The proposed method detects the known attacks and unknown attacks with a ratio of 99.8 % and 52% respectively.
Mohammed A. Ambusaidi et al. proposed the use of Flexible Mutual Information (FMI) based algorithms to perform feature selection capable of handling linear and non-linear dependent features. The selection features are then applied to the Least Square Support Vector Machine (LSSVM) based attack detection method. To test the proposed technique several different datasets namely KDD Cup 99, NSL-KDD and Kyoto 2006+ dataset is used. From the experiment results obtained the best accuracy results using KDDCUP 99 dataset with 21 features selected [11].
Chaouki Khammassi, Saoussen Krichen applies the wrapper approach to selecting the best feature portion of the genetic algorithm as a search strategy and logistic regression as a learning algorithm. The selection features were then processed using the three decision tree classifiers, i.e., C4.5, Random Forest (RF), and Naive Bayes Tree (NBTree), and the dataset used was 10% KDD99 datasets and the UNSW-NB15 dataset. The experimental results obtained were 99.90%, 99.8%, and 0.105% false alarm rate (FAR) with an
18 features subset on the KDD99 dataset. The results obtained for UNSW-NB15 provide the lowest FAR with 6.39% with a subset of 20 features [12].
M.R. Gauthama Raman et al. proposed the use of Hypergraph based Genetic Algorithm (HG-GA) for parameter setting and feature selection in the Support Vector Machine (SVM). The HG-GA-based algorithm is used to accelerate the search for optimal global solutions and used weighted objective functions to maintain a trade-off between maximizing detection rates and minimizing false alarm rates, along with the optimal number of features. To evaluate the proposed method, the NSL-KDD dataset is used, by comparing the use of all 41 features dataset and features subset obtained from the HG-GA method. The experimental results show that the HG-GA SVM method gives better accuracy and less processing time [13].
In a study conducted by Akashdeep, Ishfaq Manzoor, Neeraj Kumar, in the early stages of feature selection by ranking feature based on information gain and correlation. Furthermore, to do the classification used method of a neural network using back-propagation learning. At the time of this learning process used five different subsets of the KDD99 dataset. The subset of KDD'99 datasets is grouped based on information gain and correlation. The experimental results indicate the selection of features to reduce the number of features used in building the model gives results with better accuracy and performance of the classifier [14].
In their research Sumaiya Thaseen Ikram, Aswani Kumar Cherukuri used SVM method to build IDS based machine learning. In their research, they used SVM multiclass to detect intrusion. To get the best result in SVM multiclass, the parameter of C and gamma on RBF kernel function were tuned to get optimal SVM model. For feature selection, important features are ranked according to a set of rules based on performance using chi-squared analysis, and the best feature subset was selected for use in model development. Development and testing of models conducted using the NSL-KDD dataset. The experimental results show the multiclass SVM with the best-selected features and the proper setting of C and gamma parameters gives the most optimum results [15].
Prashant Kushwaha, Himanshu Buckchash, and Balasubramanian Raman perform development of machine learning based IDS by using KDD'99 dataset. To select the best feature, filter based techniques feature selection was carried out namely: correlation, gain ratio and Mutual Information. Some machine learning methods are tested in the learning process to choose the best model. The result SVM has shown the best performance among all other classifiers. Mutual Information based filter proved out to be more effective in comparison with other features selection techniques [16].
3
Proposed Method
3.1 Methodology
1. Data preprocessing: transform, rescale, and normalize the NSL-KDD dataset
2. Feature selection: rank the feature score and select the most relevant features, and remove unselected features from the dataset.
3. Model selection: tune the appropriate parameters of the model using an NSL-KDD dataset with selected features.
4. Model evaluation: estimate the performance of the model using NSL-KDD dataset and 10%KDDCUP dataset.
5. Save the final model obtained from model development in the file to be implemented on IDS.
Figure 1 Model Development
Figure 2 Intrusion DetectionSimulation
The steps in Intrusion Detection Simulation are as follows: 1. Capture/sniff network traffic and save to file in pcap
format.
2. Extract pcap file to obtain the network features based on KDD dataset format.
3. Detect intrusion from the pcap with KDD dataset format using the final model from the model development.
4. Classify the network traffic as normal or abnormal then display and save the result.
3.2 Dataset
The most publicly available and comprehensive dataset that is widely used in research and development of machine learning based IDS is the KDDCUP'99 dataset. The KDDCUP'99 dataset developed by MIT Lincoln Labs provides a standard dataset generated from simulations in military network environments and by encompassing various intrusions [17]. The dataset also provides network features that can be used to build and evaluate the machine learning based attack detection model.
The classification of the attacks types provided in the KDDCUP'99 dataset is first grouped into two types of connections, i.e., normal and attack connection. Furthermore, the attack connections are grouped again in 4 types of attack, that is:
DoS (Denial of Service): a type of attack aimed at shutting down network services by flooding networks with certain data packets.
Probe: is a type of attack intended to conduct surveillance and look for weakness information from a particular network address.
R2L (Remote to Local): a type of attack that is performed to access a particular network address remotely illegally.
U2R (User to Root): the type of attack that is performed to escalate user privileges to higher privileges such as superuser.
From 4 types of these attacks, each is divided into several sub-types of attacks. The complete attack classification is summarized in Table 1.
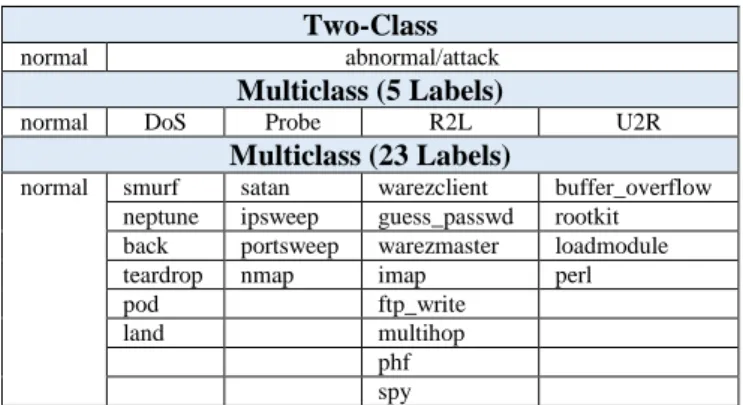
Table 1 Network Traffic Classification Two-Class
normal abnormal/attack
Multiclass (5 Labels)
normal DoS Probe R2L U2R
Multiclass (23 Labels)
normal smurf satan warezclient buffer_overflow
neptune ipsweep guess_passwd rootkit
back portsweep warezmaster loadmodule
teardrop nmap imap perl
pod ftp_write
land multihop
phf spy
The data features provided in the KDDCUP'99 dataset consists of 4 types of features as given in Table 2-5.
outcome of machine learning to become biased [18]. To fix the weaknesses found in the KDDCUP'99 dataset, then the NSL-KDD dataset is offered. The data structure and classification of attacks in the NSL-KDD dataset remain the same as KDDCUP'99, with structural improvements and eliminating duplicate records in the dataset.
In our research, we decided to use the NSL-KDD dataset with the consideration that the data is still representative to simulate the real network and it has been improved so that it can produce better non-biased learning models due to duplicate data. NSL-KDD data consists of training data and test data, each of which is stored in 2 separate files. For testing purposes in this research, we also prepare test data taken from 10% dataset KDDCUP'99.
Table 2 Basic features of individual TCP connections
No Feature Name Description Type
1 duration length (number of seconds) of the connection
continuous 2 protocol_type type of the protocol, e.g., tcp,
udp, etc.
discrete 3 service network service on the
destination, e.g., http, telnet, etc.
discrete
4 src_bytes number of data bytes from source to destination
continuous 5 dst_bytes number of data bytes from
destination to source
continuous 6 flag normal or error status of the
connection
discrete 7 land 1 if connection is from/to the
same host/port; 0 otherwise
discrete 8 wrong_fragment number of ‘wrong’ fragments continuous 9 urgent number of urgent packets continuous Table 3 Content features within a connection suggested by
domain expert knowledge
No Feature Name Description Type
10 hot number of ‘hot’ indicators continuous
11 num_failed_logins number of failed login
attempts continuous
12 logged_in 1 if successfully logged in;
0 otherwise discrete
13 num_compromised number of compromised conditions
continuous 14 root_shell 1 if root shell is obtained;
0 otherwise
discrete 15 su_attempted 1 if ‘su root’ command
attempted; 0 otherwise
discrete 16 num_root number of ‘root’ accesses continuous 17 num_file_creations number of file creation
operations
continuous 18 num_shells number of shell prompts continuous 19 num_access_files number of operations on
access control files
continuous 20 num_outbound_cmds number of outbound
commands in an ftp session
continuous
21 is_hot_login 1 if the login belongs to
the ‘hot’ list; 0 otherwise discrete 22 is_guest_login 1 if the login is a ‘guest’
login; 0 otherwise
discrete
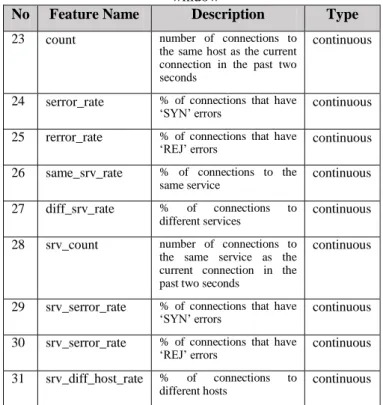
Table 4 Traffic features computed using a two-second time window
No Feature Name Description Type
23 count number of connections to the same host as the current connection in the past two seconds
continuous
24 serror_rate % of connections that have
‘SYN’ errors continuous
25 rerror_rate % of connections that have
‘REJ’ errors continuous
26 same_srv_rate % of connections to the same service
continuous 27 diff_srv_rate % of connections to
different services
continuous 28 srv_count number of connections to
the same service as the current connection in the past two seconds
continuous
29 srv_serror_rate % of connections that have
‘SYN’ errors continuous
30 srv_serror_rate % of connections that have
‘REJ’ errors continuous
31 srv_diff_host_rate % of connections to different hosts
continuous
Table 5 Traffic features computed using the previous 100 connections
No Feature Name Description Type
32 dst_host_count count of
destination host
continuous
33 dst_host_srv_count count of
destination host service
continuous
34 dst_host_same_srv_rate same service rate for destination host
continuous
45 dst_host_diff_srv_rate difference service rate for destination host
continuous
36 dst_host_same_src_port_rate same source port
rate for
destination host
continuous
37 dst_host_srv_diff_host_rate difference host
rate for
destination host service
continuous
38 dst_host_serror_rate % ‘SYN’ errors of destination host
continuous
39 dst_host_srv_serror_rate % ‘SYN’ errors of destination host service
continuous
40 dst_host_rerror_rate % ‘REJ’ errors of destination host
continuous
41 dst_host_srv_rerror_rate % ‘REJ’ errors of destination host service
continuous
development, including features selection and model selection. While data testing is used to evaluate learning outcomes of each model. The model learning outcomes will also be evaluated using test data taken from the 10% dataset of KDDCUP'99.
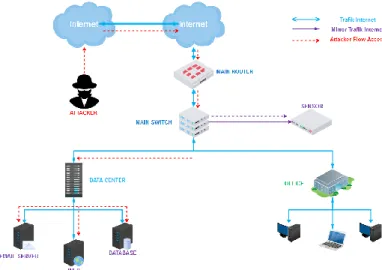
For the proof of concept of our proposed method, we also set up a dataset that is captured from a real network. The data packet captured from the real network is stored in the file in pcap format. Furthermore, this pcap file is extracted to get the appropriate features and stored in the format of the KDD dataset structure format. An overview of the network packet capture system topology as presented in Figure 3.
Figure 3 Network Capture Topology
To simulate attack data packets in this simulation system, we used some attack tools as follows:
DoS : HOIC, Slowloris Scanner : Uniscan, nmap Bruteforce: Burp Suite, Intruder
The real-time capture dataset in KDD format is then used to test the model already developed to detect whether it is normal or attack network traffic.
To perform real-time network data extraction as well as from pcap files to network features that correspond to the KDD structure we follow the explanation of the KDD dataset [16] and explanation of Lee & Stolfo in their work [18]. Based on the available references we can only extract the features subsets: basic features (1-9), time based traffic features (23-31) and connection based traffic features (23-(23-31), while for content features (10-22) we cannot extract it because there is no documentation explaining how to determine the value in the content features. In the explanations described in KDD [17] and Lee & Stolfo [19], the content features are determined by the domain expert knowledge without explaining how to determine the value. From the results of our observations we also found that the value of the content features is related to certain systems/applications in the simulation performed by MIT Lincoln Labs so that these content features are not suitable to be generally applied to other systems/applications. From the development of the internet, network system today also found that most of the network traffic on the internet is currently encrypted, making it difficult to get the content features. [20]
3.3 Data Preprocessing
The learning algorithm in machine-learning has a close bond with certain data types and structures so that its performance is strongly influenced by the data available. Most machine-learning methods are developed based on certain assumptions regarding the type and structure of the data being processed. To get the best results in building classification model, data preparation is required to meet the criteria required by the machine learning method that we use. Using inappropriate data with the machine-learning method will result in a poor model that cannot provide the correct predictions [21]. The data preprocessing in this research include transformation, scaling, standardization, and normalization. Data transformation is process to change the original data type into the data type required by the machine learning method. Scaling is carried out to adjust the value of all data features so that it is on the same scale. Standardization of data features is performed to adjust the feature value so that it follows the Gaussian distribution of having a mean value of 0 and standard deviation 1, which is particularly useful for machine learning methods which assume that the processed data follow the Gaussian distribution.
3.4 Feature Selection
Feature selection is the process of selecting features in our data that contribute to the prediction or output variables we expect. The data are available for the classification model sometimes not necessarily appropriate to the implementation in real work. For these reasons, we need to select the features to determine the most relevant features and by the implementation in a real application.
There are several methods to perform feature selection. In general, Isabelle Guyon and Andre Elisseeff [22] categorize as follows:
1. Filter Methods that is selecting features using statistical measurements. Each feature is scored based on statistical calculations; then the threshold is specified to decide the features to be included in model formation.
2. Wrapper Methods, which is looking for the most optimal combination of features by evaluating some combination of features and calculating the score based on the model accuracy.
3. Embedded Methods, which is choosing features when building a model, for example using regularization algorithm.
4. Ad-hoc feature selection, which is choosing features based on domain expert knowledge.
Then the features ware ranked by its score, and features with a high score were selected. The main goal in this phase is to select features which provide high quality and practical training data for the selected classifier algorithm. Then, the classifier is trained with the new data with selected features subset, and finally, the intrusion detection model is built. Feature selection with wrapper approach involves evaluation of features through checking the accuracy of the models learned from different subsets of features. In this method, we implement a meta estimator that fits some subsets and compute features of importance. The feature subset, which leads to the best model of learning, is selected. The feature selection with the wrapper approach resulted from the fact that the combination of the features and the characteristics of the main features of the study. [23]
Univariate feature selection works by selecting the best features based on univariate statistical tests, in this work we use chi-square. Univariate feature selection determines the strength of the relationship between the feature and the response variable by examining each feature individually. Chi-square is used for assessing two kinds of comparing: tests of independence and tests of goodness of fit. In feature selection, a test of independence is assessed by chi-square and estimate whether the class is independent of a feature [24].
3.5 Model Selection
In the model selection, some learning algorithms were observed, and the model gives the best accuracy results were selected. To get the best results from each model of the learning algorithm, we optimize the parameters of each model before the learning process. In this work, we tuned the parameters with grid search and cross-validation method. The grid search method is to look for combinations of parameters that provide the best learning outcomes, by trying different combinations of parameters in the learning algorithm. Cross-validation is the process of training learners using one set of data and testing it using a different set. In our research we used 5-fold cross-validation, i.e., the dataset is divided into five subsets: 4 subsets for learning and one subset for testing [25].
In the selection model, the learning process is conducted using four different methods, i.e., Naïve Bayes, Neural network, K-NN, and SVM. Each of these methods was evaluated using training dataset that has been prepared to conduct learning and the features subset that have been selected in the features selection process. The models obtained from learning process then were tested using testing dataset, i.e., NSL-KDD test dataset and 10% and 20% of 10% KDDCUP dataset. The results of accuracy and timing of each model were compared and analyzed to determine the best model to be used in the next process.
3.6 Model Evaluation
To evaluate the model, we measured the performance of the classifier in classifying the data correctly. Generally, performance measurement of a classification model is conducted by using confusion matrix. The confusion matrix is a table that records the number of original class label data and predicted class label. By comparing the amount of the original class label data and the predicted class label, we can
get the number of correct predictions and the number of false predictions.
From the number data of correct predictions and false predictions are then used to calculate the accuracy, error rate, etc. of the classification, using commonly used formulas, one of which is from [26], as follows:
True Positives (TP) - Is a correctly predicted positive value, that is the value of the actual class, and the predicted class value is equally positive.
True Negatives (TN) - Is a correctly predicted negative value, that is the value of the actual class, and the predicted class value are equally negative.
False Positive (FP) - Is an incorrectly predicted positive value, that is a class value that is positive, but the value of the prediction class is negative.
False Negative (FN) - Is an incorrectly predicted negative value, that is a class value that is negative, but the value of the prediction class is positive.
Accuracy - Accuracy is the most intuitive measure of performance, and this is just a precisely predicted observation ratio for total observation.
Accuracy = TP + TN / TP + FP + FN + TN
Precision - Precision is a predictably positive predictor ratio to total positive observation predictions.
Precision = TP / TP + FP
Recall (Sensitivity) - Recall is a well-predicted positive observation ratio for all observations in the actual class - yes.
Recall = TP / TP + FN
F1 Score - The F1 score is the weighted average of Precision and Recall. Therefore, this score takes false positives and false negatives into account.
F1 Score = 2 * (Recall * Precision) / (Recall + Precision)
4
Experiment and Analysis
In this research, we divided the work into 2 phases: Model Development Phase and Simulation Phase. In Model Development Phase we experimented to produce machine learning model which will be implemented in real IDS. In Simulation Phase, we conducted a simulation to test the machine learning model that has been developed in a system that detects attacks from the real network.
4.1 Experiment Setup
In running the experiment in this research, we utilized computer facilities for data processing with the following specifications:
Processor: 2,5 GHz Intel Core i5 Memory: 8 GB 1600 MHz DDR3 Operating System: Ubuntu 17.10
For data processing with machine learning, we used Python programming language with machine learning tools Scikit-learn [27].
4.2 Model Development Phase
attacks on real networks. The model development phase includes the process of data preparation, features selection, model selection, and model evaluation.
Data used in this phase were training data from NSL-KDD and test data from NSL-KDD and 10% and 20% of 10%KDDCUP'99. The description of the dataset is given in Table 6.
Table 6 Dataset Description
Data Total Normal Dos Probe R2L U2R
NSL Train 125.972 67.342 45.927 11.656 995 52
NSL Test 18.793 9.711 5.740 1.106 2.199 37
10% KDD10%
49.402 9.751 39.139 388 123 1
20% KDD10%
98.804 19.577 78.196 797 228 6
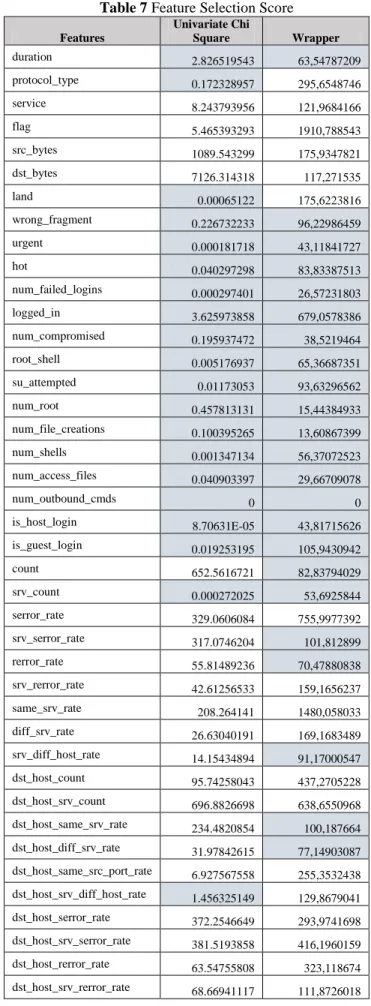
In the features selection process, we performed two methods of feature importance with wrapper approach and univariate chi-square. The results of each feature selection method are as presented in Table 7. In this table the shaded cells are features with lower score, and may be removed.
From the result of some feature selection methods, we choose the features that produce the best model and enable to be implemented in real IDS. As the final decision of features selection, we use domain expert knowledge consideration related to its implementation in the real network. Based on the description of KDDCUP'99 [17] and NSL-KDD [28] it is known that content features subset (number 10-22) from Table 3, the data is obtained based on expert knowledge domain. From our analysis and observation, we get that the data on this features subset was obtained from certain applications and cannot be generalized. Furthermore, the trend of current internet applications that data on these features is encrypted it is difficult to get these features data from real network packets. Based on these considerations, in this study, we remove the content feature (number 10-22). Further, we compared the learning accuracy and performance of the model with 41 features and with 28 features.
Based on features score ranking, then 19 best features of the wrapper approach and 21 best features of univariate chi-square were tested using the SVM classifier. The tests with the SVM classifier were performed to compare the accuracy results with all 41 features dataset, 21 features subset, and 19 features subset. In this test, we also used a subset of 28 features that are the result of feature reduction of a total of 41 KDD features without content features (10-22) based on domain expert knowledge. The accuracy results from each features subset can be seen in Table 8.
From the accuracy of each features subset in Table 8, it can be seen that a subset with 28 features provides the best accuracy results, thus in the selection of our model we use the 28 features subset.
In the model selection stage, we use a dataset with 28 features (without content features). Some of the learning algorithms we evaluated are SVM, Naïve Bayes, KNN, and Neural Network. We conducted learning the process for classification of two-class (normal and attack) and multiclass (normal, DoS, Probe, R2L, and U2R). The result of prediction for each learning algorithm for classification of two-class presented in Table 9, and for classification of multiclass presented in Table 10. Comparison of accuracy each learning algorithm for classification of two-class
presented in Figure 4, and for classification of multiclass presented in Figure 5.
Table 7 Feature Selection Score Features
Univariate Chi
Square Wrapper
duration 2.826519543 63,54787209
protocol_type 0.172328957 295,6548746
service 8.243793956 121,9684166
flag 5.465393293 1910,788543
src_bytes 1089.543299 175,9347821
dst_bytes 7126.314318 117,271535
land 0.00065122 175,6223816
wrong_fragment 0.226732233 96,22986459
urgent 0.000181718 43,11841727
hot 0.040297298 83,83387513
num_failed_logins 0.000297401 26,57231803
logged_in 3.625973858 679,0578386
num_compromised 0.195937472 38,5219464
root_shell 0.005176937 65,36687351
su_attempted 0.01173053 93,63296562
num_root 0.457813131 15,44384933
num_file_creations 0.100395265 13,60867399
num_shells 0.001347134 56,37072523
num_access_files 0.040903397 29,66709078
num_outbound_cmds 0 0
is_host_login 8.70631E-05 43,81715626
is_guest_login 0.019253195 105,9430942
count 652.5616721 82,83794029
srv_count 0.000272025 53,6925844
serror_rate 329.0606084 755,9977392
srv_serror_rate 317.0746204 101,812899
rerror_rate 55.81489236 70,47880838
srv_rerror_rate 42.61256533 159,1656237
same_srv_rate 208.264141 1480,058033
diff_srv_rate 26.63040191 169,1683489
srv_diff_host_rate 14.15434894 91,17000547
dst_host_count 95.74258043 437,2705228
dst_host_srv_count 696.8826698 638,6550968
dst_host_same_srv_rate 234.4820854 100,187664
dst_host_diff_srv_rate 31.97842615 77,14903087
dst_host_same_src_port_rate 6.927567558 255,3532438
dst_host_srv_diff_host_rate 1.456325149 129,8679041
dst_host_serror_rate 372.2546649 293,9741698
dst_host_srv_serror_rate 381.5193858 416,1960159
dst_host_rerror_rate 63.54755808 323,118674
Table 8 Selected Feature Model Accuracy
Features Precision Recall F1-score AUC Accuracy
Wrapper (19)
0.998157 0.997663 0.99791 0.99803 0.998055
Univariate (21)
0.996335 0.996964 0.99665 0.996886 0.99688
28 0.998498 0.998363 0.998431 0.998528 0.998539
41 0.998357 0.998284 0.998071 0.998144 0.998135
Table 9 Two-Class Model Performance
Method Data Test Precision Recall F1-score Accuracy
SVM NSL Test 0,837 0,793 0,815 0,826
KDD10% 0,997 0,988 0,993 0,988
20KDD10% 0,997 0,989 0,993 0,988
Naïve
Bayes NSL Test 0,928 0,703 0,800 0,830
KDD10% 0,885 0,284 0,430 0,396
20KDD10% 0,885 0,284 0,430 0,396
KNN NSL Test 0,959 0,803 0,874 0,888
KDD10% 0,998 0,992 0,995 0,992
20KDD10% 0,998 0,992 0,995 0,992
Neural
Network NSL Test 0,951 0,749 0,838 0,860
KDD10% 0,996 0,993 0,994 0,990
20KDD10% 0,995 0,993 0,994 0,990
Figure 4 Comparison of accuracy for two-class From the learning process with some learning algorithms as presented in Figure 4 and Figure 5, KNN gives the best accuracy result but requires very long learning and prediction process as shown in Table 9 and Table 10. SVM algorithm gives excellent and stable results in training and test accuracy with fast learning and prediction time.
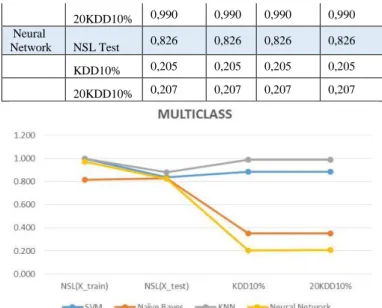
Table 10 Multiclass Model Performance
Method Data Test Precision Recall F1-score Accuracy
SVM NSL Test 0,837 0,837 0,837 0,837
KDD10% 0,883 0,883 0,883 0,883
20KDD10% 0,884 0,884 0,884 0,884
Naïve
Bayes NSL Test 0,830 0,830 0,830 0,830
KDD10% 0,350 0,350 0,350 0,350
20KDD10% 0,351 0,351 0,351 0,351
KNN NSL Test 0,882 0,882 0,882 0,882
KDD10% 0,989 0,989 0,989 0,989
20KDD10% 0,990 0,990 0,990 0,990
Neural
Network NSL Test 0,826 0,826 0,826 0,826
KDD10% 0,205 0,205 0,205 0,205
20KDD10% 0,207 0,207 0,207 0,207
Figure 5 Comparison of accuracy for multiclass Considering the purpose of model development in this research to be implemented in the real network, we required a classifier model which gives good accuracy result and fast processing time. We decided to use SVM for the next process of building the classification model to be implemented for IDS in a real network.
4.3 Simulation Phase
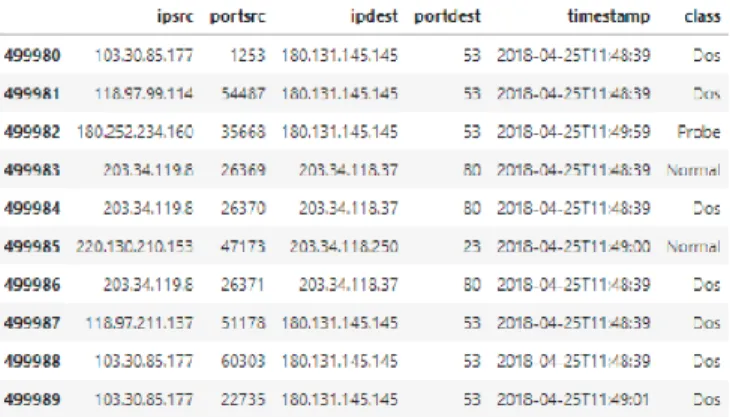
In the simulation phase, we built the SVM classification model with the NSL-KDD dataset. Furthermore, the results of model development for both classifications of two-class and multiclass were tested using the NSL-KDD test dataset, and 10% and 20% of 10% KDDCUP'99 dataset. The final model of this development result was then used to detect intrusion from pcap data captured from the real network as described in section 4.2 of this paper. The prediction accuracy of SVM classification model can be seen in Table 9 and Table 10. The result of prediction and processing time with test data and intrusion detection from pcap data with the classification of 2 classes is presented in Table 11, and classification with multiclass is presented in Table 12. The example view of intrusion detection results from real networks is provided in Figure 6.
Table 11 Two-Class Data SVM Prediction Result
Tablea 12 Multiclass Data SVM Prediction Result
milliseconds. The prediction results in NSL-KDD test data for classification of two-class got 82,6% accuracy with process time 1 second 28 milliseconds, and the result of classification of multiclass accuracy 83,7% with process time 1 second 25 milliseconds. Predicted results in 10% KDD10% test data for classification of two-class obtained 98.8% accuracy with process time 3 seconds 24 milliseconds and results in multiclass classification accuracy 88.3% with process time 3 seconds 26 milliseconds. Predicted results in 20% of KDD10% test data for two-class classification obtained 98.8% accuracy with a processing time of 6 seconds 93 milliseconds and results in multiclass classification accuracy 89.4% with a processing time of 6 seconds 98 milliseconds.
Figure 6 Intrusion Detection View in Real Network
5
Conclusions
We have successfully developed an intrusion detection model using machine learning approach which applies to a real network. Removing the content features (feature 10-22) from the structure of the KDD dataset results in an attack detection classification model with high accuracy. The experiment without involving the content features of KDD dataset gives the best classification accuracy. From our experiments on the feature selection, it is shown that most of the content features have low scores so that they can be eliminated from the dataset. The developed model implemented on IDS works well in detecting attacks in a real network.
The results of the experiment on several classification models show that SVM provides the best performance results with average accuracy on the test data of 93.4% for classification of two-class, and 86.8% for multiclass classification. Processing time on the test dataset for classification of two-class and multiclass is quite short. Experiments on real networks, the IDS that have been developed the ability to detect attacks with 6.839.023 network traffic within 7 minutes, 49 seconds, 30 milliseconds.
6
Acknowledgement
This article’s publication is supported by the United States Agency for International Development (USAID) through the Sustainable Higher Education Research Alliance (SHERA) Program for Universitas Indonesia’s Scientific Modeling, Application, Research, and Training for City-centered Innovation and Technology (SMART CITY) Project, Grant #AID-497-A-1600004, Sub Grant #IIE-00000078-UI-1.
References
[1] Zayed Al Haddad, Mostafa Hanoune, and Abdelaziz Mamouni, "A Collaborative Network Intrusion Detection System (C-NIDS) in Cloud Computing," International Journal of Communication Networks and Information Security (IJCNIS) vol. Vol. 8, No. 3, December 2016, pp. 130-135, 2016.
[2] A. L. Buczak and E. Guven, "A Survey of Data Mining and Machine Learning Methods for Cyber Security Intrusion Detection," in IEEE Communications Surveys & Tutorials, vol. 18, no. 2, pp. 1153-1176, Second quarter 2016.
[3] Monowar Hussain Bhuyan, D K Bhattacharyya and J K Kalita "Survey on Incremental Approaches for Network Anomaly Detection" International Journal of Communication Networks and Information Security (IJCNIS) vol. Vol. 3, No. 3, December 2011, pp. 226-239, 2011.
[4] M. Tavallaee, N. Stakhanova and A. A. Ghorbani, "Toward Credible Evaluation of Anomaly-Based Intrusion-Detection Methods," in IEEE Transactions on Systems, Man, and Cybernetics, Part C (Applications and Reviews), vol. 40, no. 5, pp. 516-524, Sept. 2010.
[5] Amiruddin, Anak Agung Putri Ratna, and Riri Fitri Sari " New Key Generation and Encryption Algorithms for Privacy Preservation in Mobile Ad Hoc Networks" International Journal of Communication Networks and Information Security (IJCNIS) vol. Vol. 9, No. 3, December 2017, pp. 376-385, 2017.
[6] Trustworthy Internet Movement
(www.trustworthyinternet.org).
[7] https://www.nsslabs.com/company/news/press-releases/nss-labs-predicts-75-of-web-traffic-will-be-encrypted-by-2019/ [8] Blake Anderson, David McGrew, “Machine Learning for
Encrypted Malware Traffic Classification: Accounting for Noisy Labels and Non-Stationarity”, Proceedings of the 23rd ACM SIGKDD International Conference on Knowledge Discovery and Data Mining, Halifax, NS, Canada — August 13 - 17, pp. 1723-1732, 2017.
[9] R. Koch, M. Golling and G. D. Rodosek, "Behavior-based intrusion detection in encrypted environments," in IEEE Communications Magazine, vol. 52, no. 7, pp. 124-131, July 2014.
[10]J. Lekha, and Padmavathi Ganapathi, " Detection of Illegal Traffic Pattern using Hybrid Improved CART and Multiple Extreme Learning Machine Approach," International Journal of Communication Networks and Information Security (IJCNIS) vol. Vol. 9, No. 2, August 2017, pp. 164-171, 2017. [11]Mohammed A. Ambusaidi, Xiangjian He, Priyadarsi Nanda,
and Zhiyuan Tan, " Building an Intrusion Detection System Using a Filter-Based Feature Selection Algorithm," IEEE TRANSACTIONS ON COMPUTERS, VOL. 65, NO. 10, October 2016.
[12]Chaouki Khammassi, Saoussen Krichen, " A GA-LR wrapper approach for feature selection in network intrusion detection," computers & security 70 (2017) 255–277. Available: http://dx.doi.org/10.1016/j.cose.2017.06.005
[13]M.R. Gauthama Raman, Nivethitha Somu, Kannan Kirthivasan, Ramiro Liscano, V.S. Shankar Sriram, " An efficient intrusion detection system based on hypergraph - a Genetic algorithm for parameter optimization and feature selection in support vector machine," Knowledge-Based Systems 134 (2017) 1–12. Available: https://doi.org/10.1016/j.knosys.2017.07.005
[14]Akashdeep, Ishfaq Manzoor, Neeraj Kumar, "A feature reduced intrusion detection system using ANN classifier," Expert Systems With Applications 88 (2017) 249–257 Available: http://dx.doi.org/10.1016/j.eswa.2017.07.005 [15]Sumaiya Thaseen Ikram, Aswani Kumar Cherukuri, "Intrusion
Computer and Information Sciences (2017) 29, 462–472. Available: http://dx.doi.org/10.1016/j.jksuci.2015.12.004 [16]Prashant Kushwaha, Himanshu Buckchash, and
Balasubramanian Raman, "Anomaly-Based Intrusion Detection Using Filter Based Feature Selection on KDD-CUP 99," Proceeding of the 2017 IEEE Region 10 Conference (TENCON), Malaysia, November 5-8, 2017.
[17]KDD Cup 1999 Data
http://kdd.ics.uci.edu/databases/kddcup99/kddcup99.html [18]M. Tavallaee, E. Bagheri, W. Lu, and A. Ghorbani, "A
Detailed Analysis of the KDD CUP 99 Data Set," The second IEEE Symposium on Computational Intelligence for Security and Defense Applications (CISDA), 2009.
[19]Lee and Stolfo, "A framework for constructing features and models for intrusion detection systems", ACM Transaction on Information and System Security, vol. 3, issue 4, pp. 227-261, 2000.
[20]Jason Deign, "The encryption that protects your online data can also hide malware", https://newsroom.cisco.com/feature-content?type=webcontent&articleId=1853370.
[21]Malley B., Ramazzotti D., Wu J.T., "(2016) Data Pre-processing," Secondary Analysis of Electronic Health Records. Springer, Cham, pp 115-141. Available: https://doi.org/10.1007/978-3-319-43742-2_12
[22]Isabelle Guyon, Andre Elisseeff "An Introduction to Variables and Feature Selection" Journal of Machine Learning Research 3 (2003) 1157-1182.
[23]Han Lu, Mihaela Cocea, Weili Din, "Decision tree learning based feature evaluation and selection for image classification," Proceeding of The 2017 International Conference on Machine Learning and Cybernetics (ICMLC). [24]Nachirat Rachburee and Wattana Punlumjeak, "A Comparison
of Feature Selection Approach Between Greedy, IG-ratio, Chi-square, and mRMR in Educational Mining, Proceeding of The 2015 7th International Conference on Information Technology and Electrical Engineering (ICITEE), Chiang Mai, Thailand.
[25]Jun Lin, Jing Zhang, “A Fast Parameters Selection Method of Support Vector Machine Based on Coarse Grid Search and Pattern Search”, Proceeding of 2013 Fourth Global Congress on Intelligent Systems.
[26]Powers, David M W, "Evaluation: From Precision, Recall and F-Measure to ROC, Informedness, Markedness & Correlation," Journal of Machine Learning Technologies. 2 (1): 37–63.
[27]Pedregosa et al., “Scikit-learn: Machine Learning in Python,” JMLR 12, pp. 2825-2830, 2011.