Cavitation enhancement effects on yeast chromatin fragmentation and bacteria spore rupture*
Lindsey Wells1, Chelsey King2, Austin Quimby2, Sunny Kasoji1, Virginie Papadopoulou1, Jinwook Kim1, Gabrielle Grandchamp3, Samantha Pattenden2, Paul Dayton1
1Joint Department of Biomedical Engineering at UNC and NC State University, University of North Carolina at Chapel Hill, Chapel Hill, North Carolina, USA. 2Center for Integrative Chemical Biology and Drug Discovery, Division of Chemical Biology and Medicinal Chemistry, Eshelman School of Pharmacy, University of North Carolina at Chapel Hill, Chapel Hill, North Carolina, USA.
3The Department of Biology, University of North Carolina at Chapel Hill, Chapel Hill, North Carolina, USA.
Abstract
Chromatin, the packaging of DNA around proteins, provides essential information about gene expression and gene regulation. DNA is wound tightly around proteins at locations where genes are down regulated and it is wound loosely at locations where genes are actively transcribed. Chromatin assays that look at protein-DNA interactions play a crucial role in studying these chromatin signatures. Saccharomyces cerevisiae (yeast) contain chromosomes and similar cellular pathways to human cells, which make them a valuable tool for these assays. A critical step in these assays is the fragmentation of chromatin using ultrasound; however, current sonication methods are unable to
optimize a narrow range of fragment sizes and require a bead-beating step to penetrate the yeast cell wall prior to sonication. Similarly, bacteria spores are difficult to rupture with ultrasound due to their tough spore membrane. Bacillus anthracis, the bacteria responsible for anthrax, is a particular spore-forming bacterium of significance due to the high fatality rate associated with anthrax disease. There is substantial interest in developing a detection kit for these spores. This kit would require rapid isolation of DNA from the spores to detect if a biomarker is present that identifies the pathogen.
Nanodroplets are a cavitation-enhancing reagent that has already been shown to improve gDNA shearing when activated by ultrasound. In addition to ultrasound activation of nanodroplets, recently there has been interest in the potential of using laser-generated focused ultrasound (LGFU) for this purpose. We hypothesize that activation of nanodroplets with laser-generated focused ultrasound (LGFU) could improve yeast chromatin fragmentation and increase bacteria spore rupture.
To test this hypothesis we first determined if cavitation occurred in samples targeted with LGFU. The results of this study show that the LGFU did not produce efficient cavitation. The current setup for the LGFU should be altered to increase the size of the focal point and to fit a thin-walled tube to confirm if this method shows promise to vaporize nanodroplets. Two laboratory sonicators, the Covaris E110 and the qSonica, were used to determine the effect of the nanodroplet reagent on yeast chromatin fragmentation. The tests done with the yeast model only showed significant application of nanodroplets in the Covaris E110 sonicator to improve chromatin fragmentation for use in downstream applications. Fragmentation in the Covaris happened more quickly and more consistently with the addition of nanodroplets. The Covaris E110 and the qSonica were also used to determine the effect of the nanodroplet reagent on spore rupture. Bacillus subtilis spores were used to model B. anthracis spores because of their similar structure and protein composition. The results with the bacteria model show no significant difference in the amount of spores ruptured with and without the
Figure 1. Summarizes the process of extracting genetic material from model organisms: yeast cells (A) and spore-forming bacteria (B).
A
SECTION I.
Introduction
Chromatin accessibility provides essential information about gene expression and regulation, and this accessibility can be studied by looking at protein-DNA interactions at different regions across the genome. Heterochromatin is chromatin that is classified as “closed” because the DNA is tightly wound around proteins called histones. As a result it is difficult for transcription factors to access these regions, which causes down regulation of those genes. Oppositely, euchromatin is chromatin that is “open” because the DNA is not tightly wound around proteins and, therefore, transcription factors can more easily access these sections of the DNA. In order to study where on the genome the DNA is interacting with proteins, the chromatin must be segmented. By fragmenting the chromatin, it can be determined which regions had proteins and which regions did not. Two primary chromatin assays that rely on chromatin fragmentation are ChIP and FAIRE. Both ChIP and FAIRE assays require fragmentation of fixed cells. In fixed cells the proteins are cross-linked to the DNA, which means the proteins are covalently bonded to the DNA. The ChIP assay provides information regarding interactions between proteins and DNA by locating proteins on the genome. In this assay,
easily. After fragmentation, the chromatin for the FAIRE assay is run through a positively charged column. Since the desired chromatin fragments for this assay will have a net negative charge, they euchromatin fragments will stick to the column [3].
Ultrasound has traditionally been used to fragment chromatin for these assays, but there are limitations to this technique. Sonication is a bottleneck for laboratories that conduct chromatin analysis assays such as ChIP or FAIRE, because most high-quality sonication devices, such as the Covaris E110 focused sonicator, direct ultrasound to one sample at a time [3]. It is difficult to optimize the fragment size using ultrasound and there is a wide range of fragment sizes produced, which can interfere with the
differentiation between heterochromatin and euchromatin. There is also a shearing bias due hydrogen bonding between the double stranded DNA since the guanine and
cytosine nucleotides have three hydrogen bonds holding them together while adenine and thymine only have two. There is a need to improve the chromatin fragmentation step in order to enhance the results from downstream chromatin assays.
dormant state, they are often used as weapons for bioterrorism. Additionally, the spores are frequently discovered in soil and can put livestock and farmers at risk of infection. Diagnostic recognition of the spore’s presence would be widely beneficial for people who work in agricultural settings, as well as military personnel. The DNA of the spore would need to be extracted in order to identify if a biomarker gene is present, which requires penetrating through the tough spore membrane.
The fragmentation of genomic DNA (gDNA) using a particular cavitation-enhancing nanodroplet formula has already been proven to be effective with a standard laboratory ultrasonic water bath [1]. Once the nanodroplets are vaporized with ultrasound, they are converted from a liquid phase into a gas phase, forming microbubbles. Then the
alternating compression and rarefaction of the bubbles mechanically enhances gDNA fragmentation.
simultaneously aim light at transducers below each well of a plate. Then, the carbon-black/pdms transducer could generate sonic shock waves focused at each well. If the goals of the project are achieved, less time will be wasted on long sonication processes necessary for gDNA shearing and more time can be spent on data analysis
interpretations, which will increase productivity for the user.
For this study, we aim to improve the sonication step in the ChIP assay because the regions of chromatin with bound proteins are harder to fragment compared to regions without protein. This particular assay produces the best results when the chromatin fragments containing the proteins of interest are between 200-500bp. If the fragments are over-sonicated (<200bp), they will not align to a specific locus on the genome or they will be lost. If the fragments are under-sonicated (>500bp), the fragments will align to a region on the genome that is too long to determine precisely where the protein of interest was bound [3]. Yeast cells were chosen for this portion of the study because they chromosomes and similar cellular pathways to human cells. The yeast cells were fixed in order to provide an accurate representation of the sonication procedure that would be necessary in the protocol for a ChIP assay.
as an appropriate model organism to determine if nanodroplets will enhance bacteria spore lysis.
The following hypotheses will be discussed in the next 3 sections:
1. Since LGFU has previously been shown to enhance thrombolysis with microbubbles, we hypothesize that LGFU could applied to vaporize nanodroplets and thus facilitate genomic DNA fragmentation.
2. Nanodroplets will improve fragmentation of yeast chromatin, compared to buffer, in the Covaris E110 and qSonica instruments.
SECTION II.
Application of Laser-generated Ultrasound for Genomic DNA
Fragmentation
Hypothesis: Since LGFU has previously been shown to enhance thrombolysis with microbubbles, we hypothesize that LGFU could applied to vaporize nanodroplets and thus facilitate genomic DNA (gDNA) fragmentation.
Experimental Procedures
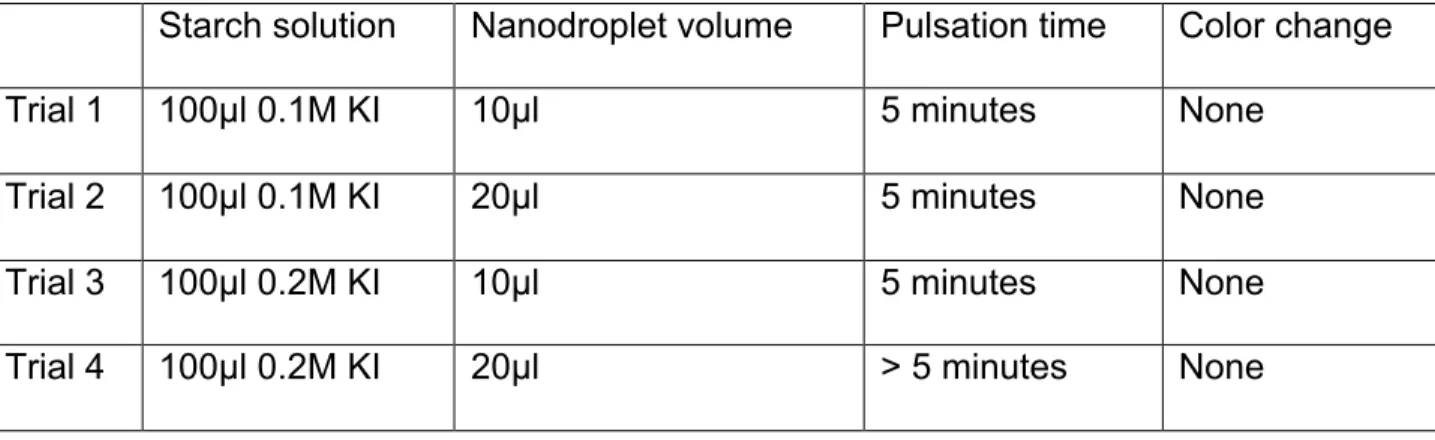
Potassium Iodide Cavitation Test
A potassium iodide test was completed to determine if cavitation occurred in a sample tube containing nanodroplets and potassium iodide (KI) solution when LGFU was focused on the sample. If cavitation were present, the sample would change from clear to purple, because reactive oxygen species produced during cavitation convert
dissolved iodide ions into iodine.
solution. The samples were kept on ice until ready for sonication. Immediately prior to sonication, the samples were transferred into in a glass tube to use in a customized holder for sonication in the Covaris E110 (1MHz) at 4°C. The samples were sonicated for 30 seconds each. The same protocol was repeated to test cavitation in the Branson water bath sonicator, however the samples were not transferred to glass tubes and no holder was used.
Figure 2. Illustrates setup for LGFU activation of nanodroplets with diagram (A) and photo of actual setup (B). Setup based on study from the Jiang lab [2].
Genomic DNA Shearing Test
A genomic DNA test was completed to evaluate if gDNA shearing was feasible with and/or without nanodroplets using LGFU with the setup described in Figure 2.
The gDNA (50ng/µl) was diluted in Tris-EDTA (TE) buffer solution to reach a final concentration of 5ng/µl and a total volume of 400µl. Then, 90µl of the gDNA solution was added to ten 1.7ml eppendorf tubes. 10µl microbubbles was added to two tubes, 10µl nanodroplets was added to four tubes, and 10µl TE was added to four tubes. The TE reagent was used as a control. The same laser parameters from the KI test were
A
used as well as the same perpendicular setup (Figure 2). One at a time, each tube was placed in a water bath at room temperature (23 ± 2°C) and the laser was pulsed for 5 minutes. To visualize the DNA shearing and fragment size, electrophoresis was performed with 9µL sample added to each well on a 1.5% agarose gel.
Results and Discussion
The KI cavitation experiments showed a successful color change in the Covaris E110 and the Branson water bath (data not shown). However, the KI experiments performed using LGFU showed no evidence of cavitation (Table 1). Since the potassium iodide solution was tested in other sonication devices to validate that a color change occurred with cavitation, it can be concluded that there was no efficient cavitation in the sample when targeted with LGFU. Although there were no indications of color change in any of the trials, vaporization inside the sample was observed using the video camera.
Starch solution Nanodroplet volume Pulsation time Color change
Trial 1 100µl 0.1M KI 10µl 5 minutes None
Trial 2 100µl 0.1M KI 20µl 5 minutes None
Trial 3 100µl 0.2M KI 10µl 5 minutes None
Trial 4 100µl 0.2M KI 20µl > 5 minutes None
Based on information from the previous study done by the Jiang lab at NC State
University, it is hypothesized that the carbon-black transducer creates a tight focal point of the generated sonic shock wave [2]. If the focal point is too small there could be an insufficient amount vaporized nanodroplets. In addition, it is known that the liquid form of the nanodroplets is denser than the buffer and, therefore, the droplets sink to the bottom of the sample. Since the LGFU was aimed perpendicularly to the sample tube, it is possible that the ultrasound focal point was above the region in the sample where the majority of the droplets were. Since the previous study showed that LGFU caused cavitation of microbubbles to enhanced thrombolysis, it is proposed that the use of LGFU to vaporize nanodroplets might still be possible through implementation of a different setup possibly one with a larger focal point [2]. Using a transducer beneath the eppendorf tube could mimic the setup of traditional focused sonicators, such as the Covaris E110. Additionally, a thin-walled tube may allow for increased transmission of ultrasound as opposed to the standard eppendorf tubes that were used in these tests.
Figure 3. Gel electrophoresis from the gDNA LGFU test showing no DNA fragmentation in any of the trials with nanodroplet, microbubble, or TE reagent. The DNA ladder on the right side of the gel image shows relative length of DNA in base pairs.
- - - + +
+ + + +
-5000bp
DNA
L
a
d
d
er
SECTION III.
Enhanced Fragmentation of Cross-linked Yeast Cells
Hypothesis: Compared to buffer, nanodroplets will improve fragmentation of yeast chromatin in the Covaris E110 and qSonica instruments.
Experimental Procedures
Unfixed Cells
Unfixed yeast cells were prepared for sonication to determine if the
cavitation-enhancing reagent showed promise for rupturing the cell wall and shearing the DNA inside the cell. Yeast cells were streaked from frozen glycerol stock onto a yeast extract peptone dextrose (YPD) agar plate using a sterile loop. The cells were incubated for 24 hours at 30°C. Inoculated yeast cell cultures were added to 4mL liquid YPD media and grown in a shaking incubator at 30°C overnight (16-18 hours). Cell quantity was
determined using optical density at 600nm. Then, the cells were centrifuged at 2,000 x g for 5 minutes and the supernatant was discarded. The pellet was washed with cold PBS and the centrifuge step was repeated. Again, the supernatant was discarded. The pellet was resuspended in enough FAIRE sonication buffer so that the desired number of cell for sonication was achieved in 90µL of buffer. A cell-count titration was performed in the early experiments to determine the amount of cells that should be used in the
the Covaris E110. 90µL of the yeast sample was transferred into in a glass tube to use in a customized holder for sonication in the Covaris E110 (1MHz) at 4°C. 10µL of the nanodroplet reagent was added to half of the samples, and 10µL of FAIRE sonication buffer was added to the other half for a total volume of 100µL in each tube. The samples with FAIRE buffer were used as controls to represent the traditional method. Various sonication time titrations were performed to determine the efficiency of DNA fragmentation with and without nanodroplet treatment. The following sonication times were used: 15 seconds, 30 seconds, 1 minute, 2 minutes, and 4 minutes.
After sonication, the entire sample was transferred to a 1.7mL eppendorf tube and centrifuged at 18,000 x g at 4°C for 5 minutes. Then the supernatant was transferred to a new 1.7mL eppendorf tube and 2µL of RNase (10 µg/µL) was added to both the pellet and supernatant after the pellet was resuspended in PBS. The samples were incubated at 37°C for 30 minutes. The DNA was isolated from the pellet and supernatant samples using positively charged silica matrix columns (Zymo Research ChIP DNA clean kit) according to the protocol provided in the kit. The DNA concentration in the pellet and supernatant was determined using a Qubit fluorometry instrument. To visualize the DNA fragment sizes, gel electrophoresis was performed with 9µL of each supernatant sample added to a unique well in a 1.5% agarose gel.
The cells were grown using the same protocol as with unfixed yeast cells. After the cells were grown in liquid culture overnight and the cell count was determined, 1%
formaldehyde was added and the cells were set to rotate for 20 minutes in order to cross-link the proteins to the DNA. In the early experiments a titration of fixation time was completed to determine what fixation time was ideal and 20 minutes was chosen as the fixation time. Immediately after the 20-minute fixation, glycine was added to reach a final concentration of 125mM so that the cross-linking reaction would be stopped. Then the cells were centrifuged at 2,000 x g for 5 minutes and the supernatant was
discarded. The cells were washed with PBS and the same protocol was followed that was used for unfixed yeast cells to sonicate the fixed yeast cells in both the Covaris and qSonica instruments. In the Covaris, the sonication times used were 30 seconds, 1 minute, 2 minutes, 4 minutes, and 8 minutes. In the qSonica, the sonication times used were 8 minutes, 16 minutes, and 32 minutes.
Statistical Methods
The average base pair length and percent of fragments in the 200 to 500 bp range was compared between samples sonicated with and without nanodroplets using a paired t-test after confirming the data were normally distributes (Kolmogorov-Smirnov t-test). Statistical significance was set to p<0.05.
Results and Discussion
Qualitative analysis of gel images for unfixed yeast (S1) showed comparable DNA fragment sizes after a 6 minutes sonication time without nanodroplets, and after 15 seconds sonication time with nanodroplets, indicating a 24-fold decrease in sonication time. The percent yield of DNA seemed to be unaffected by the presence of the
nanodroplets (S2). Therefore, experiments were pursued using fixed yeast cells.
Figure 4 shows significant results for the addition of nanodroplets to enhance
fragmentation in fixed yeast cells using the Covaris E110, a high frequency focused sonicator. Because the proteins were cross-linked to the DNA in these cells, the genetic material is tougher to fragment than the unfixed cells in the first experiment. The
The ChIP assay is commonly used tool to study chromatin. As previously mentioned, this assay requires chromatin fragments between 200 and 500 base pairs. In Figure 4B, it is evident that there is a greater percent of fragments inside this range with the
nanodroplet reagent added. This figure is based on a plot profile of the intensity from the same 2 gel electrophoresis images as Figure 4A (S3). The percent yield for the Covaris trials (S4) was shown to be similar in both conditions, signifying that the nanodroplet reagent did not negatively impact the yield of DNA.
Figure 4. Figure A shows average length in base pairs of the DNA fragments in fixed yeast cells after sonication with the Covaris E110 focused sonicator. There was a significant difference in fragment length with the traditional method compared to the method using nanodroplets (p<0.01). Figure B shows that percent of those DNA
fragments that were in the 200-500bp target range for the downstream ChIP assay was significantly higher with the nanodroplet reagent added (p<0.001).
Figure 5 shows results from the sonication of fixed yeast cells in with the qSonica instrument. Figure 5A illustrates the average base pair length of the DNA fragments from these samples; however, there was not a significant difference in the samples with nanodroplets compared to the traditional method. This figure is based on a plot profile of the intensity from 2 gel electrophoresis images (S5).
Because a lower frequency, indirect bath sonicator used to sonicate a 96-well plate was implemented in these trials, instead of sonicating one sample tube at a time like in the previous Covaris trials, the fragmentation results are expected to be less consistent. In addition, the sonication times are significantly longer because the qSonica instrument has lower power than the Covaris. Figure 5A shows that at a 32-minute sonication time the average fragment length is less than 200 base pairs, indicating the samples were over-sonicated. These experiments should be repeated at reduced sonication times to limit the amount of over-sonicated samples and determine if the cavitation-enhancing reagent will benefit chromatin fragmentation using the qSonica.
Some preliminary experiments were also executed using a Bioruptor sonicator (data not shown), which produces a low frequency ultrasound similar to the qSonica, but unlike the qSonica the Bioruptor sonicates various size tubes with large sample volumes. Inconclusive results were seen using this sonication device, and further testing must be completed in order to determine if the nanodroplet reagent will be advantageous. Since the sample volumes used for the Bioruptor are on the order of milliliters, it needs to be determined what volume of nanodroplets is ideal for cavitation enhancement.
Figure 5. Figure A shows average length in base pairs of the DNA fragments in fixed yeast cells after sonication with the qSonica indirect-sonicator. There was no
significant (ns) difference in the average base pair length between the two groups (p > 0.05). Figure B shows the percent of those DNA fragments that were in the 200-500bp target range for the downstream ChIP assay. Again, there was no significant difference in the percent of DNA fragments that were within the target base pair length (p >0.05).
In addition to these experiments, the effectiveness of the nanodroplet reagent should be compared to the implementation of a bead-beating step prior to sonication in order to determine if the nanodroplet reagent is an adequate replacement for pre-treatment in hard-to-sonicate samples such as yeast. Bead beating is a common mechanical method of cellular lysis that uses a combination of glass beads and vigorous mixing to break the cell membrane. This additional step increases risk of contamination to the sample. Therefore, there is a need to improve the sonication procedure without decreasing sample purity.
SECTION IV.
Rupture of
B. subtilis
Spores
Hypothesis: The number of bacteria spores ruptured during sonication will be
significantly greater with nanodroplets compared to traditional sonication buffer in the Covaris E110 and qSonica sonicator instruments.
Experimental Procedures
Malachite Green Spore Stain
incubated again for 24 hours in a shaking incubator at 37°C. Bacteria from the liquid culture were added to a clean glass slide using a sterile loop. The bacteria were thoroughly covered with malachite green in order to stain the spores. The slide was heated over a Bunsen burner for 5 minutes and then the slide was gently rinsed with deionized water. Next, the bacteria were covered with safranin stain for 2 minutes as a counterstain for the vegetative cells. The slide was again rinsed with deionized water. The slide was carefully blotted and allowed to dry. After applying a cover slip, the slide was observed under a microscope.
Percent Spores Determined by Number of Colonies
sonication times were increased to 5 minutes, 10 minutes, and 15 minutes and all of the samples were diluted to 1:10 prior to sonication.
After sonication, the samples were diluted to 10-3 in PBS solution. Then, 5µL of each diluted sample was streaked on LB plate and incubated overnight at 37°C. The sample that was not heat-treated was diluted to 10-3 in PBS solution and 5µL of this sample was streaked on LB plate and incubated overnight at 37°C. Additionally, a sample that was heat treated but not sonicated was diluted 10-3 in PBS and incubated overnight at 37°C. This last plate represents the initial concentration of spores. The plates were removed from the incubator after 8 hours and the number of colonies was counted after 12 hours. The percent of spores was determined based on the number of spore colonies in the sonicated samples divided by the number of colonies in the samples that were not heat shocked. This percentage was compared to the initial percent of spores, which was determined based on the number of spore colonies in the heat-treated, unsonicated sample divided by the number of colonies in the samples that were not heat shocked.
Statistical Methods
The percent of spores was compared between samples sonicated with and without nanodroplets using a paired t-test after confirming the data were normally distributes (Kolmogorov-Smirnov test). Statistical significance was set to p<0.05.
The protocol using the malachite green stain did not give consistent results in order quantify spores or draw any generalized conclusions (S7). There was no precise method to count the spores and the vegetative cells even with the stain and
counterstain. The images shown in the supplemental figure are black and white due to limitations of the microscope, but the actual stain and counterstain were green and red respectively. After speaking with specialists at the UNC Eshelman School of Pharmacy and the UNC Department of Biology, it was determined that a more effective way of quantifying the number of ruptured of B. subtilis spores would be to define the percent of spores before and after sonication. The heat treatment eliminates any vegetative cells so that the only viable cells remaining are spores.
Figure 6. Plot of the percent spores against increasing sonication time in the Covaris instrument with reference to the initial percent spores prior to soncation (A). There was no significant difference in the percent spores at each sonication time with the
traditional method compared to the method with nanodroplets (p > 0.05). The same data was plotted in bar graphs to highlight the relative percent spores at each
sonication time (B). Figure B has an additional sonication time at 1 minute that is not shown in Figure A because this time point was done with a different biological replicate so the initial percent spores was not equivalent.
A
Figure 7. Plot of the percent spores against increasing sonication time in the qSonica instrument with reference to the initial percent spores prior to soncation (A). These samples were all diluted 10-1 prior to sonication. There was no significant difference in the percent spores at each sonication with the traditional method compared to the method with nanodroplets (p > 0.05). The same data was plotted in bar graphs to highlight the relative percent spores at each sonication time (B).
A
A previous studies done using B. subtilis sonication also determined that ultrasound was effective at causing declumping of the bacteria. Additionally, this study determined that low frequency ultrasound with higher power was more effective at rupturing and killing the spores compared to high frequency ultrasound. This study also found that smaller sample volumes showed more promise for bacteria rupture [10]. In order to improve spore rupture in the Covaris E110 and qSonica, it is hypothesized that the spore sample should be diluted prior to sonication. In addition, a pre-treatment could be beneficial to weaken the spore membrane prior to sonication. If the membrane was weakened, it is more likely that the cavitation-enhancing reagent would have an effect on spore rupture. Furthermore, if the membrane were to be weakened it is more likely that the spores could be ruptured using a lower power and lower frequency sonicator, which would be beneficial for the development of a field detection kit.
SECTION V.
Conclusion
vaporizing more nanodroplets. It may be beneficial to place the transducer beneath the sample tube to mimic current, focused sonicators. The KI cavitation test should be repeated until a setup is created that shows positive cavitation before attempting to use this technique for gDNA shearing.
Next it was hypothesized that nanodroplets would improve fragmentation of chromatin in the Covaris E110 and qSonica instruments. The experiments with the wild-type fixed yeast model show significant application of nanodroplets in the Covaris instrument to improve chromatin fragmentation for use in downstream applications; however, there was no significant difference between the two groups when using the qSonica
instrument. The qSonica trials should be repeated to increase the sample size and confirm there is no significant difference. The results of the qSonica trials showed over-sonication (fragments < 200bp) at the 32-minute over-sonication time. Shorter over-sonication times should be tested in this instrument to reduce the occurrence of DNA fragments that are shorter than 200bp since these DNA fragments are too small to provide high-quality results in the ChIP assay because they can be easily lost during the procedure. A TapeStation could be using instead of gel electrophoresis to more accurately
determine the average fragment size in trials with both sonicators.
Lastly, it was hypothesized that the number of bacteria spores ruptured during sonication would be significantly greater with nanodroplets compared to traditional sonication buffer in the Covaris E110 and the qSonica. The results of sonication
nanodroplet reagent added versus without. The results also showed that in general there was not a high quantity of spores ruptured, and some of the trials even resulted in a percent of spores that was greater than 100% due to declumping of the bacteria. It is believed that a pre-treatment and dilution step is necessary prior to sonication to
weaken the spore membrane. This pre-treatment could consist of a thermal or chemical treatment. If a treatment is successfully able to weaken the spore membrane, then it is more likely that the ultrasound in combination with the cavitation-enhancing reagent will successfully rupture a significant quantity of spores.
Acknowledgements
This honors thesis would not have been possible without the guidance of many
SECTION VI.
References
1. Kasoji SK, Pattenden SG, Malc EP, Jayakody CN, Tsuruta JK, Mieczkowski PA, et al. (2015) Cavitation Enhancing Nanodroplets Mediate Efficient DNA Fragmentation in a Bench Top Ultrasonic Water Bath. PLoS ONE 10(7): e0133014.
doi:10.1371/journal.pone.0133014
2. Kim, J., Chang, W. Y., Lindsey, B. D., Dayton, P. A., Dai, X., Stavas, J. M., & Jiang, X. (2016). Laser-generated-focused ultrasound transducers for microbubble-mediated, dual-excitation sonothrombolysis. In 2016 IEEE International Ultrasonics Symposium, IUS 2016 (Vol. 2016- November). [7728473] IEEE Computer Society. DOI:
10.1109/ULTSYM.2016.7728473
3. Schoppee Bortz PD, Wamhoff BR (2011) Chromatin Immunoprecipitation (ChIP): Revisiting the Efficacy of Sample Preparation, Sonication, Quantification of Sheared DNA, and Analysis via PCR. PLoS ONE 6(10): e26015.
doi:10.1371/journal.pone.0026015
4. Goel, A. K. (2015). Anthrax: A disease of biowarfare and public health importance.
World Journal of Clinical Cases : WJCC, 3(1), 20–33. http://doi.org/10.12998/wjcc.v3.i1.20
5. Lai, E.-M., Phadke, N. D., Kachman, M. T., Giorno, R., Vazquez, S., Vazquez, J. A., … Driks, A. (2003). Proteomic Analysis of the Spore Coats of Bacillus subtilis and
6. Jun Meng, Yi Gong, Ping Qian, Jian-Yong Yu, Xiao-Juan Zhang, Rong-Rong Lu, Combined effects of ultra-high hydrostatic pressure and mild heat on the inactivation of Bacillus subtilis, In LWT - Food Science and Technology, Volume 68, 2016, Pages 59-66, ISSN 0023-6438, https://doi.org/10.1016/j.lwt.2015.12.010.
7. Zoë R. Harrold, Mikaela R. Hertel, Drew Gorman-Lewis, Optimizing Bacillus subtilis spore isolation and quantifying spore harvest purity, In Journal of Microbiological Methods, Volume 87, Issue 3, 2011, Pages 325-329, ISSN 0167-7012,
https://doi.org/10.1016/j.mimet.2011.09.014.
8. Erin E. Silvestri, David Feldhake, Dale Griffin, John Lisle, Tonya L. Nichols, Sanjiv R. Shah, Adin Pemberton, Frank W. Schaefer, Optimization of a sample processing
protocol for recovery of Bacillus anthracis spores from soil, In Journal of Microbiological Methods, Volume 130, 2016, Pages 6-13, ISSN 0167-7012,
https://doi.org/10.1016/j.mimet.2016.08.013.
9. E.A. Neppiras, Acoustic cavitation series: part one: Acoustic cavitation: an
introduction, Ultrasonics, Volume 22, Issue 1, 1984, Pages 25-28, ISSN 0041-624X, https://doi.org/10.1016/0041-624X(84)90057-X.
10. E. Joyce, S.S. Phull, J.P. Lorimer, T.J. Mason, The development and evaluation of ultrasound for the treatment of bacterial suspensions. A study of frequency, power and sonication time on cultured Bacillus species,Ultrasonics Sonochemistry,. 2003.
(http://www.sciencedirect.com/science/article/pii/S1350417703001019)
13. Strohm E, Rui M, Gorelikov I, Matsuura N, Kolios M. Vaporization of perfluorocarbon droplets using optical irradiation. Biomedical Optics Express. 2011;2(6):1432-1442. doi:10.1364/BOE.2.001432.
14. Edwards, A. Histone deacetylase inhibitors and their potential role in inflammatory bowel diseases. (2011)
15. Pattenden, S. G., Simon, J. M., Wali, A., Jayakody, C. N., Troutman, J., McFadden, A. W., Wooten, J., Wood, C. C., Frye, S. V., Janzen, W. P., and Davis, I. J. (2016) High-throughput small molecule screen identifies inhibitors of aberrant chromatin
accessibility, Proc Natl Acad Sci U S A.
16. Orlando, V. (2000) Mapping chromosomal proteins in vivo by formaldehyde-crosslinked- chromatin immunoprecipitation, Trends Biochem Sci 25, 99-104.
SECTION VII.
Supplemental Figures
Supplemental Figure 1. Gel electrophoresis image illustrating fragment sizes of 100 million unfixed yeast cells after sonication with the Covaris (1MHz).
Time (min) Treatment
+
+
+
+
+
-
-
-
-
-0.25 0.5 1 2 4 0.25 0.5 1 2 4
500bp
200bp
DNA
L
a
d
d
Supplemental Figure 2. Percent yield data for 100 million unfixed yeast cells (n=3 per group) after sonication with the Covaris (1MHz). Calculation performed using percent DNA in supernatant over the total amount of DNA in the supernatant and pellet.
30 40 50 60 70 80 90 100
0 1 2 3 4 5
Pe
rc
en
t
Y
ie
ld
Sonication Time (min)
Supplemental Figure 3. Gel electrophoresis images illustrating fragment size of 100 million fixed yeast cells after sonication with the Covaris (1MHz). Yeast cells were fixed for 20 minutes. Figure A and B show two biological replicates.
Time (min) Treatment
+
+
+
+
+
-
-
-
-
-0.5 1 2 4 8 0.5 1 2 4 8
Time (min)
Treatment
+
+
+
+
+
-
-
-
-
-0.5 1 2 4 8 0.5 1 2 4 8
Supplemental Figure 4. Percent yield data for 100 million fixed yeast cells after sonication with the Covaris (1MHz) (n = 3 for each group). Cells were fixed for 20
minutes. Calculation performed using percent DNA in supernatant over the total amount of DNA in the supernatant and pellet.
0 10 20 30 40 50 60 70 80 90 100
0 2 4 6 8 10
Pe
rc
en
t
yi
el
d
Sonication time (min)
Supplemental Figure 5. Gel electrophoresis image illustrating fragment size of 10 million fixed yeast cells after sonication with the qSonica (20kHz). Yeast cells were fixed for 10 minutes. Figure shows two biological replicates.
Time (min) Treatment
+
+
+
-
-
-+
8 16+
32+
-
8 16-
-
328 16 32 8 16 32
500bp
200bp
DNA
L
a
Supplemental Figure 7. Non-homogenous images showing the same sample of B. subtilis cells. Figure A contains both vegetative cells (dark) and spores (light). Figure B contains an abundance of unwanted bubbles that existed on the same slide. Results from this staining were inconclusive.
A
Supplemental Figure 8. Percent spores given two different media recipes (n= 3 per media). Difco media was selected because it generated a significantly higher