5127
A NOVEL EARLY WARNING SYSTEM USING FUZZY
MULTIPLE ATTRIBUTE DECISION MAKING ALGORITHM
AND METEOROLOGICAL DATA
1MUSLIKHIN, 2FATCHUL ARIFIN, 3PONCO WALIPRANOTO, 4ARIF ASHARI
1,2 Universitas Negeri Yogyakarta, Department of Electronics Education, Yogyakarta, Indonesia 3 Universitas Negeri Yogyakarta, Department of Informatics Education, Yogyakarta, Indonesia 4 Universitas Negeri Yogyakarta, Department of Geographic Education, Yogyakarta, Indonesia
E-mail: 1[email protected], 2[email protected], 3[email protected], 4[email protected]
ABSTRACT
An early warning system (EWS) has the possibility to predict data accurately in the limited positions of units using sensors and additional data input. But in reality it is not easy, requires a lot of system, cross platform and field of science. This applies tries to realize the EWS, so it is necessary to configure the addition of input data, where data from sensors and meteorological data is required to predict floods accurately. The purpose of this system is to make decisions and determine the flooding area. In order to achieve this goal, Decision Support System (DSS) techniques with primary and secondary data are applied. Primary and secondary data as input of Fuzzy Multiple Attribute Decision Making (FMADM) algorithm. The expectation is based on weight, normalized model to get optimal prediction result. The EWS equipped by sirens, short messages, websites, and also Android apps to provide monitoring and prediction information. The experiment was carried out using EWS hardware mounted on streams and the results indicated the good performance of the system with fulfill errors.
Keywords: flood area predicting, FMADM, DSS, meteorological data, early warning system.
1. INTRODUCTION
In the last decades, early warning system (EWS) is become an important role as alerting system for the human life, particularly who live near the river or the coastal area. To obtain a better alerting system, it has to be equipped with prediction facility and decision support system (DSS) to improve the capability. However, the existing system does not have those facilities, so the alerting information has delay time. Due to this, a lot of damage will occur and the disaster cannot be avoided. According to [2], [3], several types of prediction methods have been employed on the EWS. One of the popular prediction methods uses monitoring and sensor network due to more secure and more accuracy. In fact, those prediction methods are very expensive and cannot be applied [4].
One of the ways to do predictions can be done through the DSS. The DSS is a decision search
technique for optimal decision based on variable factors with selected algorithms [6], [7]. This has been applied in the previous study in monitoring system to determine the cause of floods [8], [9]. This technique makes EWS more flexible in the ability to predict flood time through the addition of geo-social media data input [10] but data obtained from the public is sometimes inaccurate. One important advantage of DSS and secondary data is the non-invasive technique associated with the environment because it does not require a large number of EWS units [11]. Another advantage of this system is a smaller data error than sensor networks.
5128 Previous researchers have used a secondary data approach; geo-social media to determine weather forecasts [14] and methods of smart adaptation activities [15] this technique is limited by the expensive cost. In today's work, many researchers have used artificial intelligence (AI) approaches such as fuzzy logic, artificial neural networks, and heuristic algorithms that adopt the behavior of the human brain [16].
The artificial intelligence is the parent of the DSS. In flood prediction the utilization of DSS requires additional data. The field data (main), meteorological data and old data (secondary) can be used as EWS input [17]. The use of DSS and secondary data does not require data training like some other algorithms. In contrast, sensor and meteorological retrieval opens more and more input variables and correlates with decision accuracy [18]. These variables are likely to be solved by DSS through a usable alternative algorithm; FL, TOPSISS, IRR, AHP, FMADM, ELECTRE, and the like so as to have their respective weaknesses and advantages [19]. Work that needs to be realized is to connect between EWS, prediction using DSS, and algorithm web processing information system in one system.
This paper presents a method for integrating it; DSS functions, meteorological data, and water level
sensor data into the EWS system to predict the impact of flood areas in the watershed. We assume the DSS structure with the FMADM algorithm with simple additive weighting (SAW) completion is sufficient to implement. Criteria (Cj) and alternative functions (Ai) are divided into 7 and 4 respectively. Next to adjust the match rating table is made, followed by normalization of the matrix. Weights based on the analysis of the variables are given, then the end result can be presented [20]. The given DSS output is sent to EWS hardware and the result will be divided into Normal, Standby-3, Standby-2, and Standby-1 decisions. Each level has its own actions that will trigger the siren and SMS gateway.
The rest of this paper is structured as follows. The second section part of the summary of the EWS, determining the type of weight and calculation is also elaborated. The third section describes the results and experimental discussions. Finally, a conclusion is presented in section 4.
2. PREDICTION USING FMADM AND
METEOROGICAL DATA
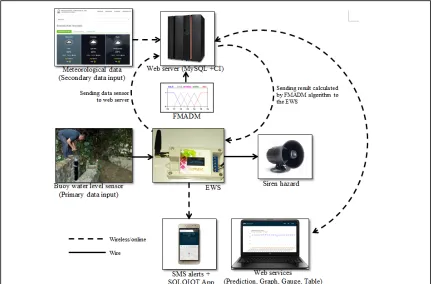
[image:2.612.90.522.435.719.2]In this study, the EWS is done using the FMADM algorithm shown in Fig. 1. The water level sensor is connected to the embedded system through the ADC port as the main data input. While secondary data from meteorology agency inputted through the website. The website serves to run the
5129 FMADM algorithm, displays data, and sends it back to the EWS via a GPRS connection. Surface water sensor uses Sharp-GP2Y0A02YK0F with buoys shielded by 4-inch diameter pipe mounted perpendicularly. Other input data sourced from Indonesian Meteorological Agency [21] is used as FMADM input through various variables, for example; relative humidity, wind speed, wind direction, rain duration, and rainfall intensity. Then all variables are combined including the river level; conducted matching criteria and alternatives to obtain decision option using FMADM algorithm.
Data from the website is feedback to the EWS which will translate into the status category Standby-1, Standby-2, Standby-3, and Normal. The Android app is called to facilitate access to public information through the concept of mirror website. Each status by the embedded system is translated to execute commands such as; sending SMS and turning on the siren hazard.
Therefore, EWS works on three lines of communication; 1) sending raw data for processing with additional meteorological data to the website, 2) then sent back to EWS, and 3) finally sending SMS and/or siren hazard commands. In this paper, EWS with meteorological data is solved by FMADM with detailed descriptions of each section of the system described in the following sections.
2.1 FMADM based Predicting
FMADM tries to make decisions in a manner similar to the human brain. Therefore, FMADM is weighted and compared to each other and will eventually form a sorting pattern. No longer ordering according to the number of attributes, but already based on matching criteria (Cj) and alternative (Ai) that were first normalized [22], [23]. The alternatives are A1 = Standby-1, A2 = Standby-2, A3 = Standby-3, and Normal.
In order to use many attributes it is necessary to draft a decision that meets FMADM algorithm. Please note the completion steps. Determine the criteria that will be used as a reference in the decision decision in an alternative disaster decision [24]. Criteria are derived from an empirical environmental analysis. The criteria used in the determination of flood decisions, among others; C1= river level, C2 = relative humidity, C3 = wind speed, C4 = wind direction, C5 = rain duration, and C6 = rainfall intensity.
The above conditions have 4 alternatives and 9 criteria related to the prediction of potential floods. Criteria value grouped into primary and secondary data; C1 as primary data while data C2-C6 as
secondary data. Each criteria is assigned a different weight (W) based on empirical analysis, calculations and mathematical patterns according to geophysical studies [25], [26].
In theory, FMADM can be solved with simple weighting. A simple addictive weighting (SAW) is used to complete the algorithm. The basis of the SAW method is to find a weighted sum of performance ratings on each alternative on all attributes [27]. The SAW method requires the process of normalizing the decision matrix (X) into a scale comparable to all existing alternative values in Eq. 1.
….(1)
where rij is the normalized performance rating of the alternative Ai on the attribute Cj; i = 1,2, ..., m and j = 1,2, ..., n. The index j will be worth a profit if the value of j increases and the profit increases, and vice versa j will be worth the loss when the value j rises but the profit is reduced [28]. The preference value for each alternative (Vi) is written like in Eq. 2.
….(2)
Continued match rating of each alternative on each criteria (X). The normalization matrix (R) is based on the equation adjusted to the attribute type (attribute gain or cost) to obtain a normalized matrix based on Eq. 2. Furthermore, after obtaining an alternative-criterion matrix rating (X), then normalized the matrix (R) based on the equation adjusted to the type of attribute (profit or cost) so as to obtain a normalized matrix [29] following Eq.3.
…. (3)
If the value of R has been obtained, then followed with the weighting process (W). The W is given by the decision maker through the previous analysis, as in Eq. 4. The value of T for C1 and so on until C6 in this condition the magnitude of fuzzy weighted value will serve as a multiplier.
5130 The value of W acquired at weighting is used as a numeratorial factor for the final result (Vn). The Vn is equaried from the summing process of the matrix multiplier (R) multiplied by weight. Consider the following Eq. 5.
... (5)
Looking for the greatest value of the final result (Vi) from Eq. 5, the maximum value obtained is the best alternative (Ai) and as a solution as a solution [30]. For example the maximum value obtained is V3, then the appropriate decision alternative is A3.
2.2 Meteorological Data based Predicting
In Indonesia, official meteorological data are issued by the government through the Meteorology, Climatology and Geophysics Agency (BMKG) -Indonesia. Based on meteorological parameters, observed data include C2 = relative humidity, C3 = wind speed, C4 = wind direction, C5 = rain duration, and C6 = rainfall intensity are as secondary data.
In order to predict the flood properly, all variables in C1-C6 must be set to the degree of fuzzy memberships. To do so, apply Eq. 6 to determine the fuzzy membership of each variable C.
….(6)
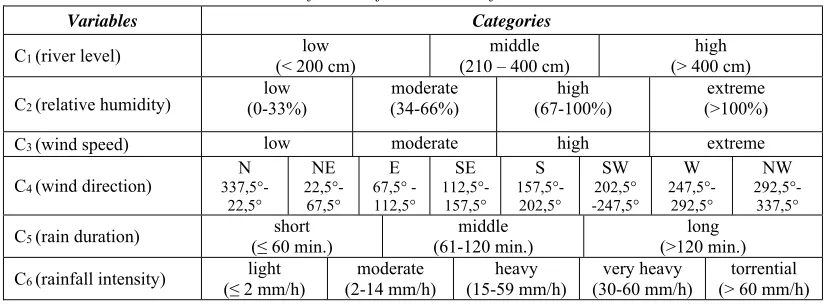
Before Eq. 6 is applied, each variable C will be searched for categories based on BMKG-Indonesia standard with modifications with various standards and other scientific considerations. There are several categories after being grouped as in Table 1. After we knew the number of classification as in Table 1, it can be determined fuzzy memberships for each criterion. Each criterion has different fuzzy memberships. In this experiment membership is at least three categories and a maximum of eight categories.
The process of making fuzzy memberships are used as the basis of FMADM which will be solved using Eq. 1 and 2. So it can be asserted that the result of Table 1 is not used for the prediction process, either Fuzzy Mamdani or Fuzzy Sugeno.
The flood prediction is done by weighting process as in Eq. 4 [31].
2.3 Early Warning System
[image:4.612.89.507.293.447.2]Early warning systems can use the following methods to assess stability assessments: data-driven methods for anomaly detection, machine learning, statistical methods, [32] empirical data failure analysis and so on. Therefore, not common enough to be relied upon on the design of EWS in general [33]. Similarity, once EWS is generated and applied; a series of actions taken e.g. village headman send SMS manually. This pattern is the old way while the more advanced way is applied to this EWS. As in the flow diagram in Fig. 2, that all work is done automatically by the system.
Table 1: Classification of All Criterions for Each Variable.
Variables Categories
C1 (river level) (< 200 cm) low (210 – 400 cm) middle (> 400 cm) high
C2 (relative humidity)
low
(0-33%) (34-66%) moderate (67-100%) high (>100%) extreme
C3 (wind speed) low moderate high extreme
C4 (wind direction)
N 337,5°-22,5° NE 22,5°-67,5° E 67,5° -112,5° SE 112,5°-157,5° S 157,5°-202,5° SW 202,5° -247,5° W 247,5°-292,5° NW 292,5°-337,5°
C5 (rain duration) (≤ 60 min.) short (61-120 min.) middle (>120 min.) long
5131 According to Fig. 2, primary and secondary data are very important in the flood prediction process.
The reception of data from the web server to the EWS consists of the following steps: First, when powered on, the EWS initializes the water level sensor and GPRS module and then sends the water level sensor data to the web server. Second, the calculated data with secondary data via FMADM is sent to the EWS as an input. The incoming data is matched to find one of four conditions. Third, the condition results will execute the automatic sending back to webserver, message delivery command and/or turn on hazard siren. Finally, the repetition is done from the first step to the third to get the data continuously, in order to take real time data. In this study the secondary data obtained from BMKG Indonesia which is forwarded to the website system.
3. EXPERIMENTAL RESULTS
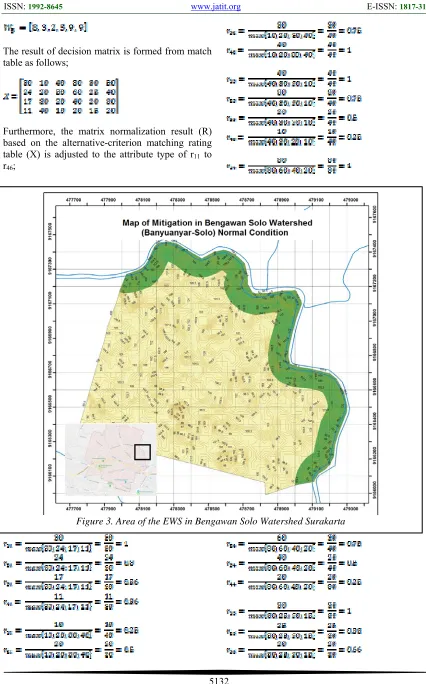
In this section, several experiments were conducted in the FMADM method for flood prediction. Flood prediction is calculated from primary and secondary data. Primary data delivery interval (C1) and secondary data (C2-C6). Primary data is sent every 15-25 second interval, while secondary data is sent every 60 minutes. Then the calculation process based on FMADM is done on the website and the results are sent back to the EWS hardware. Fig. 3 illustrates the experimental area of the EWS.
3.1 Experiment 1: Calculate FMADM to Making
Decisions
Before the system is implemented, it is necessary to experiment by entering Equation 4.
Although categorization has been established by BMKG-Indonesia standard and geophysical study,
test still required. The test is done in 3 times, based on Eq.4 to find the most appropriate weighting composition before program is written into Hypertext Preprocessor (PHP) for the web server.
[image:5.612.93.514.124.353.2]Performed a calibration process to find the proper weighting of some weighting options. This calibration process is done by taking data on website [34] and meteorological data and then check the condition of the field to ensure the empirical conditions in real location. For calibration data is used on December 20th, 2017.
Table 2: Match between Alternatives and Criteria.
Alt. Criterions
C1 C2 C3 C4 C5 C6
A1 30 10 40 80 30 50
A2 24 20 30 60 25 40
A3 17 30 20 40 20 30
A4 11 40 10 20 15 20
[image:5.612.315.512.500.567.2]Look at the Table 2; if the value assigned to each alternative and criteria as a match value, then the greatest value is best. Through the analysis and consideration of the process of giving preference weight (W) to C1-C6. In this experiment we performed five weights, where the weighting with good predictions will be used in experiments 2 and 3.
5132 The result of decision matrix is formed from match table as follows;
Furthermore, the matrix normalization result (R) based on the alternative-criterion matching rating table (X) is adjusted to the attribute type of r11 to r46;
5133 Then get the normalized matrix (R):
Continued by ranking the final result (V) by summing the first line V1 to V4 of the heavy product (W1) with R as follows;
In the same way, rate W2 to W5, with the following
results.
for W2: for W3:
for W4: for W5:
The decision result of V1 to V4 is found that each W will have proximity to the disaster level map that has been plotted according to Stanby-1, Stanby-2, Stanby-3, and Normal status. Based on Figure 3, the weighted calibration (W) is very close to the real condition of W2 with a tolerance of 15%.
3.2 Experiment 2: Implementation of FMADM
on EWS
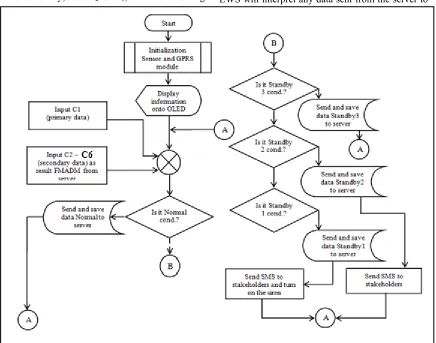
[image:7.612.94.530.378.721.2]After obtaining calibration by matching the result of weighting with empirical parameters. The EWS will interpret any data sent from the server to
5134 the hardware as in Figure 2. First, take the primary data from the water level conditions on the riverbanks and at the same time take secondary data from the BMKG site. Furthermore, primary data and secondary data are processed using FMADM algorithm. Delivery of data at 25-second intervals for sending via TCP/IP to remain valid. Finally, the received data is sequenced to determine the condition of the status level of the Bengawan Solo watershed.
Detailed implementation of FMADM algorithm applied to EWS can be illustrated as Figure 4.
Gradually work, hardware developed with the FMADM algorithm is divided into three parts. First, the reading of data input, starting from the system initialization followed by displaying information to the secondary data summing process of the web server and the primary water level sensor. The second stage is the filtration stage in which the incoming data (secondary and primary) are classified into which parts correspond to the four specified statuses. The last stage is the execution of
5135 reply data to the web server, flood status, sending SMS to the listed number (stakeholder), and or activating flood siren. Inside the hardware needs to be underlined.
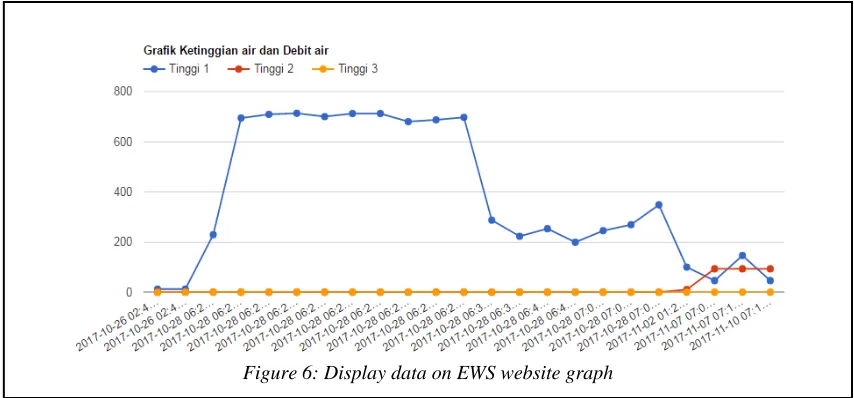
The purpose of setting this interval for data sent successfully received by server. Because in principle there is an echo received every time the data is sent. Figure 5 shows the appropriate algorithm and pseudo code flow diagram. On the website data is received from hardware, executed by the line 7. Because the communication is built using GPRS through access TCP/IP then selected open-close method. Selected this method to ensure that data sent up into database, although this method is at risk slightly slower. The total time it
takes to execute a send subroutine to a host is at an interval of 12-60 seconds. As shown in Fig. 6, the data is displayed in gauge, graphic, table, and image of the areas affected by flooding. The data displayed on the graph can be traced by time. As for the gauge is used to represent the incoming data at that time or the latest. Last data in the table also has the same function with the graph, but emphasis on readability by the user.
3.3 Experiment 3: FMADM Based Prediction
The dataset of the real weather detection and forecasting process is used to test the proposed algorithm. The tools used in the process include the EWS and website. The general description of the dataset can be found in Table 3. The total period for 271 days is applied continuously with a total of 8126 tags. The 778 cm water detection rate occurs on 31/10/2017 at approximately 3:37 pm. This paper will test the prediction accuracy but not test the efficiency of the algorithm, because it will be done in the next study.
Table 3: Statistics of the Dataset
Description Number
Total time period 271 days Total number of tags 8126 Highest peak alarm rate 778 cm Num. Standby 1 status 2 Num. Standby 2 status 101 Num. Standby 3 status 1862 Num. Normal status 6161
Accuracy of the proposed algorithm detection has been praised from the aspect of detection rate. Here is the weighing process chosen based on the experiment 1. The accuracy value can be searched by comparing the prediction result on the map according to real field conditions. In order to know
the value of accuracy then marked on the map by giving the node as a measuring point. The difference in the distance on each node to the outside is the basis for the assessment of the accuracy of each status. The dataset as shown by the red shading in Fig. 7 (Appendix A) is the FMADM result data in Bengawan Solo watershed.
[image:9.612.96.523.275.474.2]5136 from comparing data of FMADM result with data
on Bangawan Solo watershed condition.
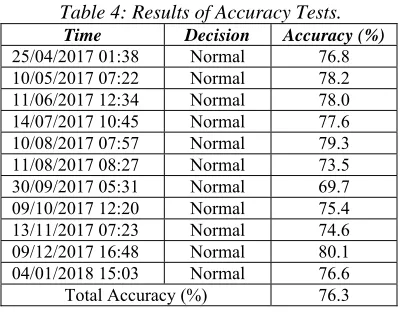
[image:10.612.94.295.312.468.2]Measurement conditions are measured through GIS Analysis rules with buffering and query techniques as applied in Figure 3 and all Appendix (A, B, C). Contrast between FMADM results with real conditions then can be calculated accuracy value as in Table 4. EWS installed for almost 11 months with each accuracy is different, the lowest is 69.7% when the sample is taken on 30/09/2017, while the highest accuracy when the sample is measured on 09/12/2017 is 80.1%. Of the total 8126 data entered in the database and taken random samples every month as Table 4, the decision conditions that appear are Normal, Standby 2, and Standby 3 while Standby 1 does not appear in this sampling. The final assertiveness test results show that 76.3% is accurate.
Table 4: Results of Accuracy Tests.
Time Decision Accuracy (%)
25/04/2017 01:38 Normal 76.8 10/05/2017 07:22 Normal 78.2 11/06/2017 12:34 Normal 78.0 14/07/2017 10:45 Normal 77.6 10/08/2017 07:57 Normal 79.3 11/08/2017 08:27 Normal 73.5 30/09/2017 05:31 Normal 69.7 09/10/2017 12:20 Normal 75.4 13/11/2017 07:23 Normal 74.6 09/12/2017 16:48 Normal 80.1 04/01/2018 15:03 Normal 76.6 Total Accuracy (%) 76.3
Anything that appears on the web is the result of execution of information from hardware installed, it is necessary to perform the area of impact based on calculations with the FMADM algorithm. To illustrate the watershed impacted FMADM results still need to be verified map through buffering techniques and queries from geography, so it appears as in Appendix C, B and C (status of Standby-1, Standby-2, and Standby -3).
The coverage of predicted area is analyzed and adapted to the flow pattern. At points A, B, and C are factually lower land (90-98 masl) with altitude below the contours in that area, 97-110 masl Thus the flow pattern will always overflow to the mainland as in the yellow area image. The prediction process using the FMADM algorithm obtained from primary and secondary data can predict but the resulting pattern is still static.
4. CONCLUTIONS
In this work, the predicted impact and status of flood using primary data (sensor) combine with
secondary data (meteorological data) was successfully developed and implemented in a EWS using the FMADM algorithm. Based on the experimental results, it is concluded that prediction using primary and secondary data with the FMADM algorithm can achieve a good performance and thus can be implemented for different applications such as landslide and bridge structure.
ACKNOWLEDGEMENTS
The authors would like to express their appreciation to Ministry of Research, Technology, and Higher Education- Republic of Indonesia and Universitas Negeri Yogyakarta under contract Nos. 01/PPM Hasil Riset-UNY-DIPA/UN.34.21/ 2017 for financial supporting.
REFERENCES
[1] N.B. Melnikovaa, D. Jordan, V.V. Krzhizhanovskaya “Experience of using FEM for real-time flood early warning systems:Monitoring and modeling Boston levee instability”, Journal of Computational Science Vol. 10, 2015, pp. 13–25.
[2]Jan Cools, Demetrio Innocenti, Sarah O’Brien “Lessons from flood early warning systems”, Environmental Science & Policy Vol. 58, 2016, pp. 117–122.
[3] Sikorska, A.E., Seibert, J. Value of different precipitation data for flood prediction in an alpine catchment: A Bayesian approach. J. Hydrol. (2016),
http://dx.doi.org/10.1016/j.jhydrol.2016.06.031. [4] Tomoaki Kashiwao, Koichi Nakayama, Shin Ando,
Kenji Ikeda, Moonyong Lee, Alireza Bahadori, “A neural network-based local rainfall prediction system usingmeteorological data on the Internet: A case study using data from theJapan Meteorological Agency”, Applied Soft Computing, Vol. 56, 2017, pp. 317–330.
[5] Kasztelnik, Maciej Malawski, Piotr Nowakowski, Maciej Pawlik, and Bartosz Wilk., “Smart levee monitoring and flood decision support system”: Procedia Computer Science 108C. International Conference on Computational Science, June 12-14, 2017, pp. 2220–2229.
[6] Wenkai Tongwen Chen Sirish L. Shah Martin Hollender “Cause and Effect Analysis for Decision Support in Alarm Floods”. IFAC PapersOnLine, January 1 (2017) pp. 13940–13945.
[7] A Ahamed, J.D. Bolten “A MODIS-based automated flood monitoring system for Southeast Asia”, International Journal Applied Earth Observation Geoinformation, Vol. 61, 2017, pp. 104-117.
5137 [9] Nengcheng Chen, Ke Wang, Changjiang Xiao, Jianya
Gong, “A heterogeneous sensor web node meta-model for the management of a flood monitoring system”, Environmental Modelling & Software, Vol. 54, 2014, pp. 222-237.
[10]Camilo Restrepo-Estrada, Sidgley Camargo de Andrade, Narumi Abe, Maria Clara Fava, Eduardo Mario Mendiondo, and Joao Porto de Albuquerque, “Geo-social media as a proxy for hydrometeorological data for streamflow estimation and to improve flood monitoring”, Computers and Geosciences Journal. October 22, 2017, pp.148-158. [11]Ruo-Qian Wang, Huina Mao, Yuan Wang, Chris Rae,
Wesley Shaw, “Hyper-resolution monitoring of urban flooding with social media and crowdsourcing data” Computers and Geosciences Journals, November 5, 2017, 3-16.
[12]Shuo-Yan Chou, Yao-Hui Changa, Chun-Ying Shen, “A fuzzy simple additive weighting system under group decision-making for facility location selection with objective/subjective attributes”, European Journal of Operational Research, Vol. 189, Issue 1, 2008, pp.132-145.
[13]Liu Hua, Chen Weiping, Kang Zhixin, Ngai Tungwai Li Yuanyuan, “Fuzzy Multiple Attribute Decision Making for Evaluating Aggregate Risk in Green Manufacturing”, Tsinghua Science & Technology, Vol. 10, Issue 5, 2005, pp. 627-632.
[14]Nash, J.E., Sutcliffe, J.V., 1970. River flow forecasting through conceptual models part ia discussion of principles. J. Hydrol. Vol. 10, 1970, pp. 282–290.
https://doi.org/10.1016/00221694(70)90255-6. [15]Wang Yuanyuan, Liu Ping, Shi Wenze, and Yin
Xinchun, “A New Framework on Regional Smart Water A New Framework on Regional Smart Water” Procedia Computer Science 107, March, pp. 2017, 122-128.
[16]Kamran Chapi, Vijay P.Singh, Ataollah Shirzadi, Himan Shahabi, Dieu Tien Bui, Binh Thai, Phame Khabat Khosravi, “A novel hybrid artificial intelligence approach for flood susceptibility assessment”, Environmental Modelling & Software, Vol. 95, 2017, pp.229-245.
[17]Annelies Bolle, Luciana das Neves, Steven Smets, Justine Mollaert, Saul Buitrago, “An impact-oriented Early Warning and Bayesian-based Decision Support System for flood risks in Zeebrugge harbour”, Coastal Engineering, 2007, https://doi.org/10.1016/j.coastaleng.2017.10.006 [18]Deng-FengLi, “An approach to fuzzy multiattribute
decision making under uncertainty”, Information Sciences, Vol. 169, Issues 1–2, 2005, pp. 97-112. [19]Bo Feng, Zhi-Ping Fan, Jian Ma, “A method for
partner selection of codevelopment alliances using individual and collaborative utilities”, International Journal of Production Economics, Vol. 124, Issue 1, 2010, pp.159-170.
[20]Katiyar, N., Hossain, F.,. An open-book watershed model for prototyping spaceborne flood monitoring systems in International River Basins. Environ. Model. Softw. Vol. 22, No.12, 2007, 1720-1731.
[21]
http://www.bmkg.go.id/cuaca/prakiraan-cuaca.bmkg?AreaID=501240&Prov=11&lang=EN, 02:11 (GMT+7), 27/12/2017.
[22] M. Ahmadi, T. Kashiwao, M. Bahadori, A. Bahadori, “Estimation ofwater-hydrocarbon mutual solubility in gas processing operations using anintelligent model”, Pet. Sci. Technol. Vol. 34, No.4, 2016, pp. 328–334. [23]Seyed Mohammadreza MiriLavasani, Jin Wang, Zaili
Yang, Jamie Finlay, “Application of MADM in a fuzzy environment for selecting the best barrier for offshore wells”, Expert Systems with Applications, Vol. 39, Issue 3, 2012, pp. 2466-2478.
[24]Chubey, M.S., Hathout, S.,. “Integration of RADARSAT and GIS modeling for estimating Red River flood risk”, GeoJournal, Vol. 59, 2004, pp. 237-246.
[25]Rizka Ella Setyani, Ragil Saputra, “Flood-prone Areas Mapping at Semarang City by Using Simple Additive Weighting Method”, Procedia - Social and Behavioral Sciences, Vol. 227, 2016, pp.378-386. [26]I. Kaliszewski, D. Podkopaev, “Simple additive
weighting—A metamodel for multiple criteria decision analysis methods”, Expert Systems with Applications, Vol. 54, 2016, pp.155-161.
[27]Yu-Jie Wang, “A fuzzy multi-criteria decision-making model based on simple additive weighting method and relative preference relation”, Applied Soft Computing, Vol. 30, 2015, pp.412-420. [28]Hamed Shakouri G., Mahdis Nabaee, Sajad
Aliakbarisani, “A quantitative discussion on the assessment of power supply technologies: DEA (data envelopment analysis) and SAW (simple additive weighting) as complementary methods for the “Grammar””, Energy, Vol.64, 2014, pp.640-647. [29]Tiesi, A., Miglietta, M.M., Conte, D., Drofa, O.,
Davolio, S., Malguzzi, P., Buzzi, A., “Heavy rain forecasting by model initialization with laps: a case study”. IEEE J. Sel.Top. Appl. Earth Obs. Remote Sens. Vol. 9, 2016, pp. 2619–2627. https://doi.org/10.1109/JSTARS.2016.2520018. [30]Tetzlaff, D., Uhlenbrook, S., “Significance of spatial
variability in precipitation for process-oriented modelling: results from two nested catchments using radar and ground station data”. Hydrol. Earth Syst.
Sci. Vol. 9, 2005, pp. 29–41.
http://dx.doi.org/10.5194/hess-9-29-2005.
[31]Alfieri, L., Salamon, P., Pappenberger, F., Wetterhall, F. “Operational early warning systems for water-related hazards in Europe”. Environ. Sci. Policy, Vol. 21, 2012, pp.35–49.
[32]Kaku, K., Held, A.A., Fukui, H., Arakida, M., “Sentinel Asia’ initiative for disaster management support in the Asia-Pacific region. In: Disaster Forewarning Diagnostic Methods and Management, Vol. 6412, 2006, pp. 41203.
[33]Marion Tanguy, Karem Chokmani, Monique Bernier, Jimmy Poulin, Sébastien Raymond, “River flood mapping in urban areas combining Radarsat-2 data and flood return period data”, Remote Sensing of Environment, Vol. 198, 2017, 442–459.
5138
Appendix A: Standby-3
5139
5140