Using CAP Dimensionality for Service and User
Allocation for Optical Access Networks
M.B. Othman112, Xu Zhangl, J. Bevensee Jensen and I. Tafur Monroy
DTU Fotonik, Dep. of Photonics Engineering, DTU, Orsteds Plads 343, DK-2800 Kgs. Lyngby, Denmark. Department of Communication Engineering, FKEE, UTHM, 86400 Parit Raja, Johor. Malaysia.
[email protected]; jebe @fotonik.dtu.dk; [email protected]
Abstract: The usability of carrierless amplitude and phase (CAP) modulation dimensions for service and user allocation for WDM optical access is experimentally demonstrated in a 2X2D-ODMA configuration.
O 2012 Optical Society of America
OCIS codes: 060.4080,060.4230, 060.0060.
1. Introduction
Next generation access networks (NGAN) needs to supply multiple users with access to multiple services such as voice, data, images and video while sharing the same physical infrastructure in the fiber to the home (FTTH) network. All-optical 2 dimensional (2D) optical code division multiple access (OCDMA) has been proposed for NGAN for multimedia applications [I] and increased spectral efficiency in FTTH [2]. Due to the limited coding space, incoherent
1 dimensional (ID) optical coding technology (either in time or wavelength domain) is not feasible for future access networks which are required to support a large number of end users. Both 2D and 3 dimensional (3D) encoding techniques require multiple domains to realize optical codes. Therefore. it is difficult to smoothly upgrade the capacity of an access network where 2D or 3D encoders/decoders are employed [2]. In order to overcome this problem the encoder and decoder can be designed in the electrical domain. Orthogonal division multiple access (ODMA) exploring the multiple possible dimensions of carrierless amplitude and phase (CAP) modulation [3] has been proposed for multiple services application. Hybrid OCDMA and wavelength division multiple (WDM) network have been proposed and demonstrated in [4] to significantly improve the system flexibility and performance. Regarding light sources for optical access, directly modulated vertical cavity surface emitting lasers (DM-VCSELs) have emerged as an attractive solution due to the cost effective production and low modulation voltage.
In this paper, we propose what we believe is the first experimental demonstration 2x2D-ODMA configuration in WDM access network. We believe this new concepts can be implemented in WDM networks in an elegant way by utilizing the orthogonal CAP filters are designed in digital domain. Moreover the higher dimensionality ODMA is able to support multiple services without requiring additional domains in the optical link.
2. Principle of ODMA
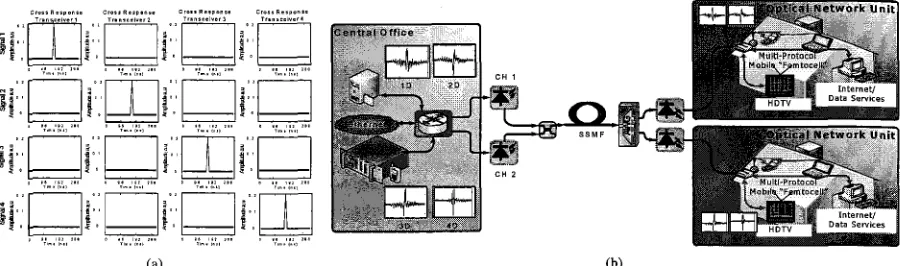
Code division multiple access (CDMA) has been introduced in wireless communication. ODMA can be classified under the CDMA concept, with orthogonality imposed on the set of signals. The ODMA concepts have been proposed for higher dimensionality CAP in digital subscriber line (DSL) application [3]. CAP is a multi-dimensional multi- level signal employing orthogonal waveforms; one for each dimension. These waveforms are obtained from frequency domain filters with orthogonal impulse responses. The orthogonal waveforms are generated by using an optimization algorithm (OA) [ 5 ] . To avoid inter-dimensional crosstalk, it is vital that the transmitter-receiver (transceiver) filter combinations satisfy the orthogonality or perfect reconstruction (PR) criteria. Fig. l(a) shows the cross responses of the four orthogonal transceiver filters for four dimensional (4D)-CAP. The transceiver filters combination satisfies the orthogonality or PR criteria. The transmitter is represented by f N and the receiver is represented by g ~ . The impulse only exists at the cross responses of fl and g l , f 2 and g2, f 3 and gj, f4 and g4.
(a) (b)
[image:2.534.50.500.96.229.2]Fig. 1: 4D-CAP (a) cross responses of transceiver filter and (b) 2x2D-ODMA scenario for WDM system.
Table 1: Relationship of 2x2D-CAP at different LID
3. Experimental Setup
Fig. 2 shows the setup implemented in the experiment. An arbitrary waveform generator (ArbWaveGen) with sampling rate of 1.25 GSaIs is used to generate the 2D-CAP signals. CH1 is represented by waveforms 1 and 2 and CH2 is represented by waveforms 3 and 4. Data in the transmitter is mapped according to the given constellation by converting a number of raw data bits into a number of multilevel symbols (i.e 2-LID or 4-LID). Those symbols are upsampled and later shaped (or filtered). The transmitter filters are implemented as fixed finite impulse response (FIR) filters. The 2 VCSELs at 1540.61 nm (CHI) and 1541.01 nm (CH2) with 4.5 GHz bandwidth operating at 4 mA bias level are directly modulated with the CAP signals. The two signals are combined using a 3 dB coupler as shown in Fig. 2(a). The signals are propagated through 20 km standard single mode fiber (SSMF) with a total fiber loss of 6.5 dB. A variable optical attenuator (VOA) is placed after the fiber for bit error rate (BER) measurements. At the receiver, the signals are been seperated into ONUl and ONU2 by the arrayed waveguide grating (AWG). The signals is directly detected by a photodetector (PD) and stored in a digital storage scope (DSO) with 40 GSaIs sampling rate for offline demodulation. At the receiver, the inversion of the transmission filter is implemented to retrieve the original sequence of symbols. The symbols are down sampled and demapped before the data can be recovered. Transmission quality is assessed using receiver sensitivity at a BER of 2.8
x
lop3, since forward error correction (FEC) techniques may be applied to obtain error free transmission when the 7% of FEC overhead are taken into account. The bitslsymbol, total levels, upsampling factor, bit rates, bandwidth. spectral efficiency and sampling rate relationship of the total 2x2D-ODMA at different levels per dimension (LID) are listed in Table 1 .Signal 2x2D- ODMA
2-LID 4-LID
4. Results
Upsampling Factor
12 12
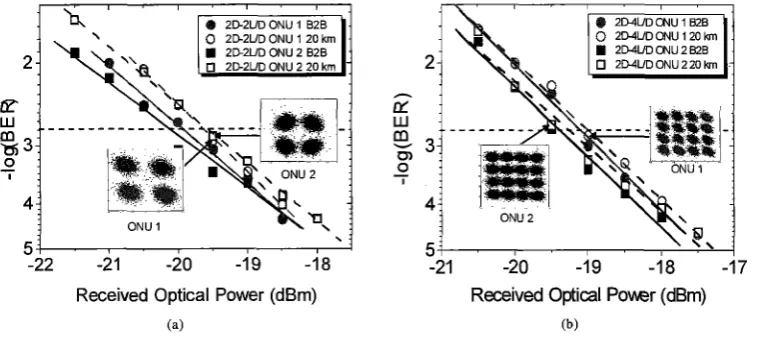
Fig. 3(a) and (b) shows the BER results obtained for 2D-ODMA signals at 2-LID and 4-LID at ONUl and ONU2. The solid symbols represent optical back to back (B2B) and the hollow symbols represent 20 km SSMF transmission. For 2D-2LlD for B2B, the receiver sensitivity at the FEC threshold for ONUl is -20.1 dBm and -19.9 dBm at ONU2. After 20 km SSMF transmission, the performance is similar for both RNs with the receiver sensitivity of -19.6 dBm. The signals are successfully demodulated below the FEC limit after 20 km SSMF transmission. This can be clearly seen from the constellation diagram of 2-LID at ONUl and ONU2 in the figure with BER approximately 1 x after 20 km SSMF transmission. For 2D-4LlD, the power penalty is negligible between B2B and after 20 km SSMF transmission is observed. The insets show the received signal constellation with BER of approximately 1 x lop3 at
Bitslsymbol
4 8
Bit Rates (Mbls)
416.67 833.3 Total
levels
16 25 6
Bandwidth (MHz)
400 400
Spectral Efficiency
(bls1Hz)
1.04 2.08
Sampling Rate (Mbaud)
[image:2.534.57.487.301.375.2]Fig. 2: Experimental setup for 2x2D-ODMA over 20 km SSMF with DM-VCSELs for WDM architecture.
,
1
"KZ""'"?
2D2UD ONU 2 20 km
Received Optical Power (dBm)
-21 -20 -19 -18 -17
Received Optical P o w r (dBm)
(b)
Fig. 3: Bit error rate (BER) vs received optical power (ROP) (a) 2D-ODMA 2-LID and (b) 2D-ODMA 4-L/D
ROP of -19.5 dBm for ONUl and ONU2 at ROP of -19 dBm after 20 km SSMF transmission. Similar performance is observed for 2LID and 4LlD for 2D-ODMA.
5. Conclusions
We propose and experimentally demonstrate the 2x2D-ODMAJWDM network with DM-VCSEL over 20 km SSMF. Both signals are successfully demodulated below the FEC threshold. The spectral efficiency for 4-L/D is 2.08 bits/s/Hz with bit rate of 833.3 MHz is presented in this work. The flexibility of the 4D-CAP in dividing the dimensions in the optical fiber systems is successfully demonstrated. This result indicates the prospects of combining the ODMA in WDM network for service and user allocation in next generation access network. Furthermore, the orthogonal FIR filters are designed in digital domain which can be an alternative solution for higher dimensionality OCDMA which requires multiple domains coding.
References
1. Mikael Morelle, et. al, "Quality of service differentiation in multimedia 2D optical networks", in EU- szPc0,(2007).
2. FP7 Report, "Survey of next generation optical access system concepts", (2010).
3. A.F.Shalash, K.K. Parhi, "Multidimensional carrierless AMlPM systems for digital subscriber loops" IEEE Transactions on Communication, 47, 11, 1655-1667, (1999).
4. Xu Wang et. al, "Flexible 10 Gbps, 8-User DPSK-OCDMA System with 16x16 Ports Encoder and 16-Level Phase-Shifted SSFBG Decoders" in OFC/NFOEC, (2008), paper OMR2.
[image:3.522.67.456.198.368.2]paper ID: NWPJ-201203-36
QoS Simulation and Analysis of HTTP over
LEO Satellite Constellation
Lukman Audah, Zhili Sun and Haitham Cruickshank
Abstract-In this paper, we present an end-to-end QoS simulation studies on internetworking of remote LAN and long range communications over LEO-Iridium satellites constellation taking SuperJARtNG network in Malaysia as an example. A macro level network simulation scenario based on actual network topology in Malaysia is implemented as Diffserv network model using the network simulator-2 (NS-2). Web trafic (HTTP) is used as the internet traffic models in the simulation analysis. All simulations are carried out in error-free and link-loss environment. In error-free simulations, the accumulative network trafic loads are varied from 20%, 50% and 80% while in link-loss environment simulations only 20% trafic load is used with bit error rate (BER) varied from 1x10-~, l x l o 4 and 2 x l 0 - ~ . We compare the empirical TCP throughput traces with analytical model for validation. The results show clearly that QoS can be achieved with IP Diffserv over satellites constellation like Iridium.
Keywords-component; Quality of Service (QoS); Differentiated Services (Diffserv); IP over satellite; Network Integration; TCP Throughput Modeling
T
HE current Internet architecture operates mostly based on connectionless Internet Protocol (IP) system that provides best effort services. This means the IP routers treat all packet streams equally without given any preferential treatment to the higher priority traffic streams. Furthermore, the IP routers route packets based on shortest path first (SPF) algorithm without regard to the overall link utilization. Consequently, all shortest paths links become congested and over-utilized capacity while the other paths with slightly longer distance become under-utilized in link capacity. These whole things eventually cause poor Quality of Service (QoS) to the entire packet transmission services.The IETF has proposed Differentiate Services (Diffserv) as
Manuscript received April lgth, 2012. This work was supported in part by the UK-ESPRC under MONET project.
, Lukman Audah is with the Faculty of Electrical & Electronic Engineering,
Universiti Tun Hussein Onn Malaysia (UTHM), 86400 Parit Raja, Johor, Malaysia (e-mail: [email protected] or [email protected] ).
Zhili Sun is with the Centre for Communication Systems Research (CCSR), Faculty of Engineering & Physical Sciences, University of Surrey, Guildford, Surrey GU2 7XY United Kingdom. (e-mail: [email protected] ).
Haitham Cruickshank is with the Centre for Communication Systems Research (CCSR), Faculty of Engineering & Physical Sciences, University of Surrey, Guildford, Surrey GU2 7XH, United Kingdom. (e-mail:
a better solution to provide QoS guarantees in IP networks. Compared to its predecessor like the Integrated Services (Intserv) which provides services based on per-microflow state, Diffserv outsmarts Intserv in providing better end-to-end QoS and preferential treatment. Diffserv discriminates different traffic flows which have same commonality to finite aggregate of classes and provides a more scalable solution for QoS in IP networks by simplifying the complexity function such as traffic classification and traffic conditioning within the edge routers [I, 21.
However, Diffserv alone is not the complete solution without adopting Traffic Engineering (TE) to overcome the link congestion and inefficiency of network resource distribution. Traffic Engineering might enhance the end-to- end QoS performance and resource utilization in any IP packet network system. It is important to achieve the end-to- end QoS target because the Internet user's perception of service quality is based on end-to-end network performance.
Previous related studies on end-to-end Internet QoS of IP- Diffserv [3, 4, 5, 6, 71 only analyzed a micro scale of wired/wireless terrestrial network topology. None of them have analyzed the global scale of Internet data transmissions over both terrestrial and satellite and also adopting actual network topology in the simulation scenario. We believe that it is important to analyze end-to-end QoS based on the actual network topology of both terrestrial and satellite networks because this reflects the current and future Internet data transmission. Furthermore, simulation measurement and evaluation of end-to-end QoS parameters using common Internet traffic (HTTP, FTP, VoIP) for multiple client-server communications might give better foresight on the kture network design with QoS guarantees for many users.
Paper ID: NWPJ-201203-36 2
topology in Malaysia is proposed as an example in implementing the IP-Diffserv and TE model. In addition, the simulation analysis also emulates the common speed of Internet services in Malaysia which is IMbitls. Simulations are done in error-free and link-loss environments. In error-free simulations, the accumulative background traffic loads are varied fiom 20%, 50% and 80% of the Diffserv core-link capacity while in link-loss environment simulations only 20% background traffic load is used with bit-error-rate (BER) varied from 1x10-', 1 x 1 0 ~ and 2x10.~. All simulations and analysis of the above mentioned network model are done using the Network Simulator-2 (NS-2- version 2.33).
The rest of this paper is organized as follows. Section I1 describes the simulation configuration. Section I11 discusses the simulation results and analysis. Following our previous studies on QoS over satellites as in [9], the analysis and comparison of TCP throughput results with the predicted analytical model are presented in section IV. Finally, sections V and VI present the conclusion and future works respectively.
This section describes in detail the parameters used for the IP-Diffserv and the network system of both terrestrial and LEO-Iridium satellites simulation configuration. In addition, measurement methodologies for QoS parameters like packet delivery ratio (PDR), total packets dropped distribution, average end-to-end packet delay and average session throughput are also explained in this section.
A. Satellite Networking Simulation in NS-2
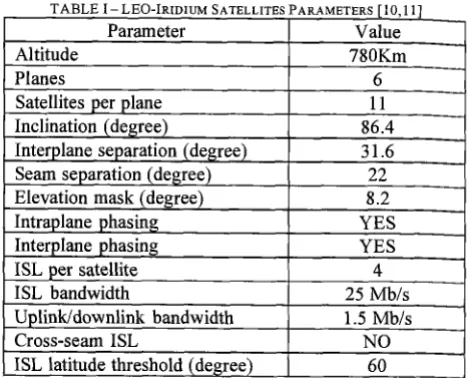
Simulation of satellite networks that follows the exact technical parameters often requires a detailed modeling of radio frequency characteristics (interference, fading), protocol interactions (e.g. interaction of residual burst errors on link with error checking codes), and second-order orbital effects (precession, gravitational anomalies, etc.). However, in order to study the fundamental characteristics of satellite networks from a networking perspective, some features might be omitted. As an example, simulation analysis of TCP performance over satellite has little effect with detailed propagation channel model which could be characterized to first order by the overall packet loss probability [lo, 111. In this paper, LEO-Iridium satellites constellation are used in order to create a framework to study the QoS effects of transport, routing and handover protocol in end-to-end data transmissions. The following are the parameters description and Table I shows all LEO-Iridium satellites constellation parameters that can be simulated in NS-2 [lo].
Basic constellation definition: Define the satellite altitude, number of satellites, number of planes, and number of satellites per plane.
[image:5.560.298.532.68.257.2]Orbits: Define the orbit inclination ranging fiom 0 to 180 degrees. Inclination above 90 degrees corresponds to retrograde orbits. However, orbit eccentricity and nodal
TABLE I- LEO-IRIDIUM SATELLITES PARAMETERS [10,11] Parameter
Altitude Planes
- --~.. - -
Satellites per plane Inclination (degree)
Interplane separation (degree)
ISL bandwidth 25 Mbls
Value 780Km
h
-
11 86.4 3 1.6
Seam separation (degree) 22
precession are not modeled in NS-2. In addition, inter- satellites spacing within a given plane and relative phasing between planes are set to be fixed.
Inter-satellite (ISL) links: Defme the polar orbiting constellations, Intraplane and Interplane satellite links. Intraplane ISL correspond to the communications between satellites in the same plane which are never deactivated or handed off. In addition, Interplane ISL referring to the communications between satellites of neighboring co-rotating planes. Both ISL will be deactivated near the poles when exceeding ISL threshold because the satellite antenna unable to track these links in the Polar Regions.
Ground to Satellite (GSL) links: Define the communications between satellites and terrestrial links network. GSL are periodically handed off when the elevation angle drop below the elevation mask. In this paper, there are two GSL which locations are set in London, UK (51.53', -0.08') and Kuala Lumpur, Malaysia (3.13", 101 .70°).
Elevation Mask: Define the elevation angle of GSL link can be operated. When a GSL terminal that correspond to a satellite drops below the elevation mask, it will search for a new satellite above the elevation mask. Each GSL terminal will check for handoff opportunities when the timeout interval specified by the user is exceeded. Both GSL in this paper initiate handoff asynchronously.
Cross-seam ISL
B. Simulation Scenario
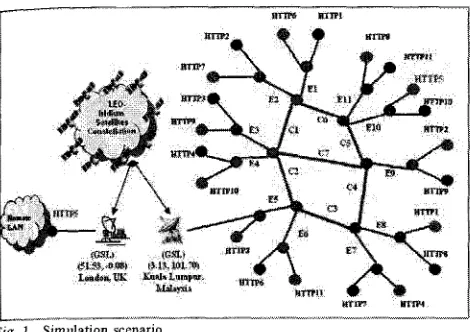
The proposed simulation scenario as shown in Fig. 1 consists of two main components which are the terrestrial and satellite networks. The terrestrial network on the right side is designed such that it imitates the macro level of actual geographical topology in Malaysia. The way of imitation is by assigning an edge router to represent each of the 11 CitiesICounties which connects to other 6 interconnected routers (red color) that form the Diffserv core links. Each of the 11 edge router (green color) is further connected to client (orange color) and server (blue color) nodes. So, there are 11 pairs of client and server nodes, 11 Diffserv edge routers and 6 core routers which in total are 39 nodes in the terrestrial
Elevation mask (degree)
NO 8.2
paper ID: NWPJ-201203-36
-. - ~
Fig. 1. Simulation scenario
network. The Diffserv parameters and policies are assigned to those 11 edge routers and 6 core routers which control the packet streams transmission within the Diffserv network domain. The assignment of client-server pair location is done randomly with the fact that all links must be utilized by the traffic flows. The path taken by the traffic flows from each pair of clientlserver node is determined by the Link State Routing Protocol.
In addition, there are another 66 LEO-Iridium satellites constellation and 2 ground to satellite links (GSL) located at London and Kuala Lumpur. The satellites form a bridge from a server node located in a remote LAN in UK to a client node in Malaysia. It should be noted that a single client node generates HTTP connections from a "cloud" of web clients while a single server node accepts and serves HTTP connection destined for a "cloud" of web servers. The link bandwidth for Core Links, C1 to C7, follow the Optical Carrier (OC-192) specification which is approximately 10GbitIs while the Edge Links, E l to E l l , follow the OC-24 specification which is approximately 1.25Gbit/s [12]. A reduction of a hundred folds in the link bandwidth is done in order to speed up the simulation time and to accommodate the limited capacity of computer hard disk space.
The Core Links propagation delays approximation varies according to actual distance in Malaysia geography. The propagation delay for link C1=20ms, C2=25ms, C3=25ms, C4=30ms, C5=30ms, C6=25ms and C7=25ms. The Edge Link propagation delay is fixed to 5ms while the client/server Link is lms. Based on Fig. 1, each pair of client and its designated server node is labeled with the same name (e.g. HTTP1, HTTP2 and etc). The paths that packet streams take across the network system are determined by the Link State (LS) routing protocol. The LS governs all the Layer 3 network routing process for terrestrial network while routing process in LEO satellites network is govern by a centralize routing genie. The routing genie determines the global satellites topology, computes new data routes for all nodes and built a forwarding table on each node [lo]. In addition, it computes the shortest path data route based on the current propagation delay of a
link as the cost metric.
TABLE 11- AVERAGE INTER-RRIVAL TIME OFHTTP SESSIONS
Moreover, all simulations in NS-2 involve one type of Internet application traffic which is the Hyper Text Transfer Protocol (HTTP). A client-server pair generates thousands of different HTTP request-response sessions based on 20%, 50% and 80% of traffic loads. Calculation of the traffic load is divided in two categories which are based on the terrestrial Diffserv core links capacity and the satellite links bandwidth. As an example for 20% of traffic load simulation, all 10 server nodes in terrestrial network generate an average aggregate background traffic that approximate to the 20% of the Diffserv core links capacity which is 20Mbit/s while the other server node (HTTP5) located in remote LAN in UK generates an average data rate that approximate to the 20% of uplinkldownlink of GSL bandwidth which is 300KbitIs. These traffic loads parameters are determined by the inter-arrival time of each new request-response session. The traffic load also corresponds to the amount of packet streams been injected to the network system. In this paper, we want to demonstrate the effect of the background traffic generated by clientlserver pairs (except HTTP5) to the QoS of Internet data transmission over LEO-Iridium satellites constellation.
In addition, each HTTP session involves an average of lOKbytes of HTTP response file transfer size. The average inter-arrival time between each generated HTTP session is modeled by Exponential distribution while the average HTTP response file transfer size is modeled by Pareto distribution. A HTTP session represents a complete request-response pair that follows both Exponential and Pareto distribution between a server-client pair. NS-2 has both distribution functions built in it and could be generated using Random Number Generator (RNG). In order to set the Pareto file transfer size distribution, the average value of lOKbytes and Pareto shape parameter of 1.5 are passed to the Pareto type of Random Variable function. It produced a series of file size distribution with an average of 10Kbytes. It should be noted that the lOKbytes parameter is taken based on the majority of Internet file transfer size as measured in the previous studies [13, 141. On the other hand, an average of HTTP session inter-arrival time parameter is passed to the Exponential type of Random Variable.
As mention previously, the two types of traffic loads are generated according to the inter-arrival time of new HTTP sessions which varies from 20%, 50% and 80%. Therefore, there are two HTTP session inter-arrival variables used in all simulations which one is according to Diffserv core links capacity (background traffic) and the other one according to
Traffic Load
20% 50% 80%
Average Inter-arrival Time of New HTTP Session (second)
Main Traffic
(
Background Traffic (HTTP5)0.27733 0.11093 0.06933
[image:6.540.19.254.67.233.2] [image:6.540.262.515.70.163.2]Paper ID: NWPJ-201203-36 4
uplinWdownlink GSL bandwidth (traffic fiom HTTPS). As an example for 20% of traffic load simulation, the average inter- arrival time, i, measured in second is calculated using the following formula:
i = ( N ) x (Fs) x 8
Bw
The N parameter is the number of nodes involve in generating the traffic flows while the Fs parameter is the average HTTP Response file size (10400 bytes) sent by the server nodes. An average of one TCP segment size is 1040 bytes of which the 1000 bytes is the Data and 40 bytes is the TCP header. An average of a file transfer is assumed to contain 10 Kbytes of Data which in total including header is approximately 1.04 x lo4 x 8bits
.
The Bw parameter is the link bandwidth measured in bls. In this paper, we define Bw in two different values which one of them (100 Mbitls) is used to calculate the inter-arrival time of the background traffic generated by 10 pairs of clientlserver nodes (except HTTP5) and the other one (1.5 Mbitls) is for the main traffic flows across LEO-Iridium satellites constellation. Table I1 lists the average inter-arrival time of HTTP session parameters for every pair of clientlserver (HTTP 1-HTTP 1 1) according to 20%, 50% and 80% of traffic loads.Moreover, all link-loss environment simulations in this paper used one-way random link loss error model. Link loss error model is configured on all Diffserv Edge Links with bit error rate (BER) 1x10-~, 1x10.~ and 2 x 1 0 ~ . The loss module is placed right after link's queue element and before the link's delay element. This means a packet will be marked as 'error' and dropped as soon as it enters the Diffserv edge link. The error model follows uniform distribution with minimum and maximum value of 0 and 1 respectively.
1) Flow Path and Propagation Delay Estimation
Table I11 shows the paths taken by the HTTP5 flow from a server node in the remote LAN to a client node in the Diffserv network (based on Fig. I), and its estimated propagation delay. The estimated propagation delay might vary based on the path variation taken in the LEO-Iridium satellites network. It was obtained without taking into account the queuing delay at each link. The value of 157.162ms is calculated based on the paths taken by HTTP5 flows in the early data transmission as stated in the NS-2 satellite output trace file. Based on the output trace file, the propagation paths in LEO-Iridium satellites network stated in term of (latitude, longitude) locations are GSL(,, (51.53°,-0.080), node(2) (65.21°,7.83'), node(1) (32.670,2.31°), node(l2) (48.97', 35.75'), node(23) (32.66', 65.51°), node(34) (48.97', 98.94'), node(33) (16.33',95.86') and GSL(,, (3.13', 101.70~). The one way link propagation delay (t,) in LEO-Iridium satellites network is calculated using some trigonometry formulas as discussed in [15], without taking into account the queuing delay at each satellite links. The value is equal to the summation of propagation delay from earth terminal in UK to the current
nearest satellite above it (t,,), propagation delay within satellites network (ti,) and propagation delay fiom satellite to earth terminal in KL, (tdl). Following are the formulas used to calculate the estimated t,, [15]:
t,, = Propagation time from earth terminal (UK) to the nearest satellite above it.
t,, = Propagation time within the satellite constellation t,, = Propagation time from satellite to destination earth
terminal.
Eq. (4) can be split into Eq. (5)
-
(10) as follows:Next, the following equations define Propagation time within the satellite constellation (ti,) and Propagation time from satellite to destination earth terminal (tdl).
Eq. (14) can be split into Eq. (15) - (18) as follows:
TABLE 111 -FLOW PATHS AND ESTIMATED PROPAGATION DELAY
I
HTTPI
Paths TakenI
EstimatedI
Flow Propagation
Delay
HTTP5
I I
G S L ( U K , ~ LEO Satellites3 G S L ( K L ) 3
[image:7.553.290.534.476.755.2]paper ID: NWPJ-201203-36 5
/
1
Req PDR1
Rsp PDRi
1
Packet Delivery Ratio (PDR) for 20%, 50% and 80% of Traffic Loads
I
HTTP Categoryi i
HTTP CategoryI
Packet Delivery Ratio (PDR) for 20% of Traffic Load wih BER l x l ~ - ~ , l x l ~ - ~ and 2x10-~
I I I I
Fig. 2. Packet Delivery Ratio (PDR) for 20%, 50% and 80% of traffic loads ~ i g . 3 . Packet Delivery Ratio (PDR) for 20% of traffic load with BER 1x10-
',
1x10.~ and 2x10.~Following are the constant variable used in the previous equations.
6 = latitude
4
= longitudeR = earth radius = 6378.137 Km c = speed of light = 299792.458 ~ m '
h = LEO satellite altitude from earth surface = 780 Km
In order to calculate the link propagation time from GSL~JK) to the nearest satellite (node(2)) above it, both locations of
' - GSL(UK) and node(2) are inserted in Eq. (3) and then Eq. (4)
which yield t,, = 6.173ms. The inter-satellite links propagation times are calculated using Eq. (12) and Eq. (1 1) for every pair of satellite (sat,+l and sat,), using node(2), node(l), node(l2), node(23), node(34) and node(33) locations which then yield t,, = 13.448ms
+
12.253ms+
11.358ms+ 12.253ms+
13.458ms = 62.770ms. In addition, the downlink propagation time is calculated using Eq. (14) and Eq. (13) with GSL(KL) and node(33) locations which then yield tdl = 6.219ms.Therefore, the total propagation time in LEO satellites networks is t, = 6.173ms
+
62.770ms+
6.219ms = 75.162ms. Finally, the end-to-end link propagation time for TCP5 is t,,,l= t,+
t,p = 75.162ms+
82ms = 157.162ms.2) Link Loss
All link-loss environment simulations in this paper used one-way random link loss error model. Link loss error model is configured on all Diffserv edge links with bit error rate (BER) 1x10e5, lxlo4 and 2 x 1 0 ~ . The loss module is placed right after link's queue element and before the link's delay element. This means a packet will be marked as 'error' and dropped as soon as it enters the edge link. The error model follows uniform distribution with minimum and maximum value of 0 and 1 respectively.
111. RESULTS AND DISCUSSION
The next subsections explain the results and discussions based on HTTP simulations in NS-2. The results are divided into error-free (traffic loads of 20%, 50% and 80%) and with link-loss condition (BER = 1x10-~, l x l ~ - ~ and 2x10.~) for traffic flows over LEO-Iridium satellites network. All QoS parameters results obtained from the NS-2 simulations are calculated as averages for all HTTP sessions generated by HTTP5 clientlserver pair. Simulation time is set to 300 second because there are more than 2GB of the output trace file produced for each traffic load category.
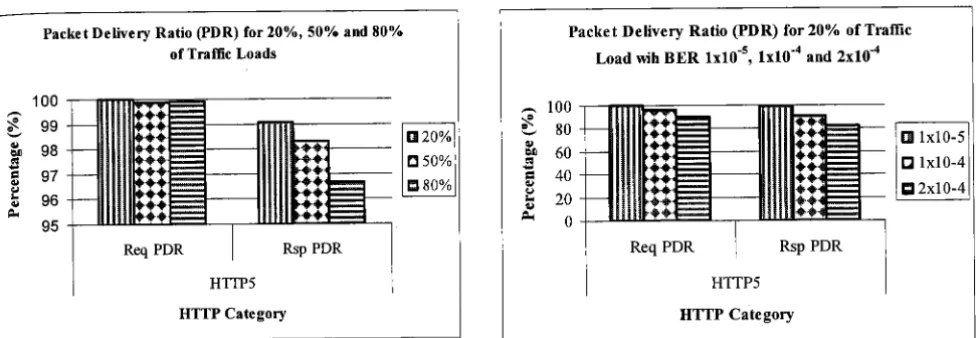
A. Packet Delivery Ratio (PDR)
Fig.2 shows the Packet Delivery Ratio (PDR) for HTTP5 Request and Response packets transmission over LEO-Iridium satellites network. The PDR is calculated as the ratio between the Received Request/Response packets and Sent RequestIResponse packets type. It measures the percentage of successful end-to-end data transmission. Although all packets are guaranteed to be delivered from source to destination by the TCP, not all packets received are the original packets sent by the source. Some of the packets are lost and need to be retransmitted. Therefore, the PDR shows the ratio between total sent packets including retransmission packets and total received packets.
[image:8.542.14.504.65.234.2]Paper ID: NWPJ-201203-36
Total Packets Dropped Distribution of HTTP Request, Response, SYNlACK and FlNtACK for
20%, 50% and 80% of Traffic Loads
Req
1
Rsp1
SYNIACK1
FINIACKHTTPS
I
HTTP CategoryI
Fig. 4. Total packets dropped distribution for 20%, 50% and 80% of traffic loads
Diffserv elements or due to the narrowband in satellite links. Based on Fig. 2, the PDR values are much above 96% in all traffic load variation. This is due to the flow control by TCP in order to provide a reliable data transmission.
Fig. 3 shows the PDR of HTTP5 flows for 20% traffic load with BER from 1x10-~, 1 x 1 0 ~ and 2 x l 0 - ~ . The PDR of HTTP5 flows are inversely proportional to the increment of BER. The higher the BER, the lower would be the number of successful transmitted packets. Based on the graph, the PDR could be considered higher which is above 80% in the worst case of BER equal to 2 x 1 0 ~ . The main reason is because the HTTPS flows operate in low bandwidth of 20% traffic load in which the liiks could still sustained the traffic burst. Furthermore, the results shows that link-loss in Diffserv network domain did not give significant effect on short HTTP sessions when operate in lower traffic load.
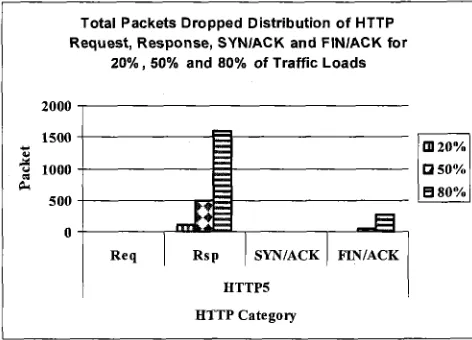
B. Total Packets Dropped Distribution
Fig. 4 shows the distribution of total dropped HTTP Request, Response, SYNJACK and FINJACK type of packets during 300 second of simulation time. It should be noted that the SYNIACK and FINJACK are small packets of 40 bytes size which sent by the HTTP client and server upon connection establishment or connection tear down. The SYNIACK means SYN or ACK packet type sent by the client. In addition, the FINJACK means FIN or ACK packet type sent by the server. The total packets dropped include the packets dropped due to buffer-overflow and also Diffserv RED buffer early packets dropped. As traffic loads increase from 20% to SO%, the numbers of packets dropped are drastically increased. This is because greedy flows are severely punished by the Diffserv RED buffers. The increment of traffic loads will cause the current average buffer size to grow larger as many packets need to queue before being transmitted. Diffserv marks the packet flows that have accumulative sending rate more than the 1 Mbitls and dropped those packets probabilistically when the current average RED buffer size exceeds the minimum threshold. All packets are
Total Packets Dropped Distribution of HTTP Request, Response, SYNIACK and FTNIACK for 20% of Traffic Load
with BER 1x10⁻⁵, 1x10⁻⁴ and 2x10⁻⁴
Req
I
RspI
SYNIACK/
FINIACK HTTPSHTTP Category
Fig. 5. Total packets dropped distribution for 20% of traffic load with BER l x l ~ . ' , 1 x 1 ~ ~ and 2x10.'
then dropped when the buffer size exceeds the maximum threshold. Based on the graph, the HTTP Response packets are dropped much more than the SYNIACK and FINIACK packets. This is because the HTTP Response packets are larger (average size of 10 Kbytes) than the SYNJACK and FINIACK packets (40 bytes each). Larger packets will quickly fill the queue buffer which will then trigger the Diffsen, RED monitoring element that estimates the current queue size. Besides that, the total packets dropped not only due to the Diffserv RED buffers but also due to the narrowband links in the satellites network.
Fig. 5 shows the total packets dropped distribution in link- loss simulation environment for 20% of traffic load with BER 1x10-*, 1x10.~ and 2x10'~. The number of packets dropped increase proportionally with the increment of BER. Compared to Fig. 4, flows in lower traffic load did not much penalized by Diffserv and the packets dropped mainly due to the link- loss error model implemented on the Diffserv network boundary.
Based on Fig. 4, the total HTTP packets dropped in 20%, 50% and 80% of traffic load are 102 packets, 545 packets and 1877 packets respectively. Meanwhile, the total HTTP packets dropped for l x l ~ - ~ , 1x10.~ and 2 x l 0 - ~ of BER are 104 packets, 1284 packets and 2734 packets respectively. From these values, we could see that the increment of BER in lower traffic load (20%) has cause larger number of packets to be dropped compared to the number of packet dropped in higher traffic load.
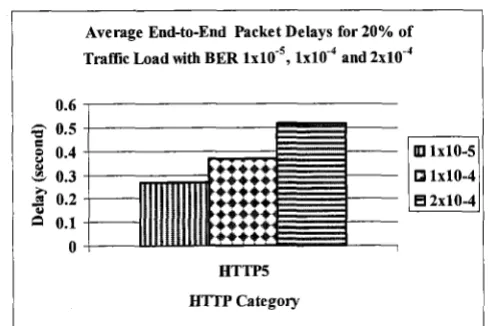
C. Average End-to-End Packet Delay
[image:9.557.290.533.78.216.2] [image:9.557.39.275.79.249.2]paper ID: NWPJ-201203-36 7
1
HTTP CategoryAverage End-to-End Packet Delays for 20%, 50% and 80% of Traffic Loads
I I
Fig. 6 . Average end-to-end packet delays for 20%, 50% and 80% of traffic loads
Average End-to-End Packet Delays for 20% of Traftic Load with BER 1x10-~, l x l ~ - ~ and 2x10-'
propagation delay in satellites network may vary due to the handover process and various paths taken by the packets streams. For all error-fiee simulations (20%, 50% and 80% of traffic loads) in this paper, the additional factor due to other traffic condition could be neglected and the end-to-end delay only involves propagation delay and queuing delay. We estimate the average end-to-end delay in second (D) using the following equation based on summation of session duration (1,) per total received of HTTP requestlresponse packets (P,) and then divided the value with the total number of completed
'
HTTP sessions (S) generated by HTTP5 clientlserver pair for the whole simulation time.
-
Based on Fig. 6, as the traffic loads increase from 20% to SO%, the links become busy with traffic burst and the service time at each queue buffer become lower than the incoming traffic flows which eventually cause buffer to overflow. This has caused many packets need to be retransmitted to complete a session transfer. The session duration becomes higher in order to complete a HTTP request-response and as the result the average end-to-end delay becomes higher too in every HTTP session. In addition, many packets are dropped in higher traffic load due to Diffserv RED buffer early drop action which also cause many packets need to be retransmitted to complete a HTTP session. This Diffserv policy had severely punished greedy flows and eventually causes the increment of average end-to-end delay.
Fig. 6 shows the average end-to-end packet delays (D) for 20%, 50% and 80% of traffic loads are 0.2626 second, 0.2837 second and 0.3324 second respectively. Based on previous mentioned assumption that the delay due to other network condition (e.g. link-loss with bit-error-rate) could be neglected in all error-free simulations, we then estimate the average end-
HlTP Category
I
I I
Fig. 7. Average end-to-end packet delays for 20% of traffic load with BER lxlW5, 1x1W4 and 2x10.~
to-end queuing delay using the following formula:
Dq = D - t101,l (20)
Therefore, the average end-to-end queuing delays for 20%, 50% and 80% of traffic loads are 105.438ms, 126.538ms and 175.238ms respectively.
Fig.7 shows the average end-to-end packet delays for HTTP5 flows in 20% of traffic load with BER of l x l ~ - ~ , l x ~ O - ~ and ~ x I O - ~ . Based on the graph, the average end-to-end packet delay is proportionally increased with the increment of BER. The higher the BER, the longer time needed to send a packet from server node to client node or from client node to server node. This is mainly because many packets are dropped in higher BER and need to be retransmitted. Based on Fig. 5, the average end-to-end delays (DBER ) with BER 1x10-~, 1x10.~ and 2x10⁴ are 0.2690 second, 0.3594 second and 0.5184 respectively.
The integration of random error-model to create some network scenario variations in all link-loss simulations has caused additional packet delay apart from the propagation delay (t,,,,,) and queuing delay (D,). Based on the delay parameters obtained previously, we then estimate the additional average end-to-end delay (Dndd) due to the BER variation using the following formula:
Dodd = DEER -Dq(20%) -tioral (21) Therefore, the additional average end-to-end delays due to the network condition variation with BER of 1x10-~, l ~ l O - ~ and 2x10⁴ are 6.4 ms, 96.8 ms and 255.8 ms respectively.
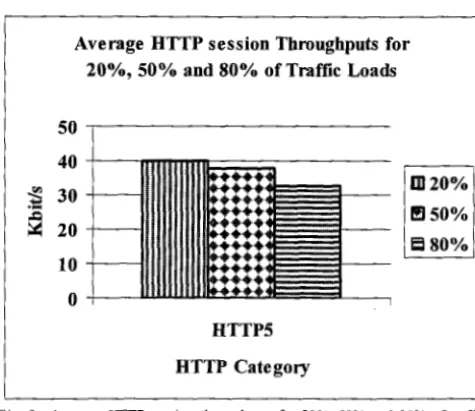
D. Average HTTP Session Throughput
[image:10.539.264.508.64.227.2] [image:10.539.20.252.70.259.2]Paper ID: NWPJ-201203-36 8
Average HTTP session Throughputs for 20%, 50% and 80% of Traffic Loads
Average HTTP Session Throughputs for 20% of
Trafic Load with BER 1x10-~, 1 x 1 0 - ~ and 2 x l 0 - ~
HTTP Category
session (5'). This section could be regarded as the conclusion IV. TCP THROUGHPUT MODELING
of the previous sections because it shows the final results after In this section, we compare the TCP throughput in previous taking into account the effect of all the QOS parameters section with the mathematical modeling of TCP throughput
mentioned previously. proposed by Padhye et a1 [16].
HTTP Category
Fig. 8 shows the average HTTP5 session throughputs for 20%, 50% and 80% traffic loads. Indeed the variation of average session throughput is very much depending on the end-to-end delay and consequently the session duration. The longer the paths taken fiom source to destination, the longer would be the time needed to transmit a packet due to propagation delay and queuing delay at each node, and as the result the longer time needed to complete a HTTP session. In addition, the low PDR and high drop rate also contribute to the lower throughput in higher traffic load. The average session throughputs for 20%, 50% and 80% of traffic loads are 40.157 Kbitls, 37.75 Kbitls and 32.601 Kbitls respectively.
I
Fig. 9. Average HTTP session throughputs for 20% of traffic load with BER l x l ~ . ~ , 1x10.~ and 2x10.'
(22)
Fig. 9 shows the average session throughput for HTTPS flows for 20% of traffic load in link-loss environment simulations. Based on the graph, the average session throughput is inversely proportional to the increment of BER. Based on the graph, the average session throughputs with BER of 1x10-~, 1x10.~ and ~ x I O - ~ are 39.099 Kbitls, 28.167 Kbitls and 21.188 Kbitls respectively. From those values, we found that the decrements of average session throughput are much higher in link-loss environment compared to the decrement of those values in higher traffic load. This mainly due to the high packets loss and high average session duration as the BER increased fiom 1x10'~ to 2x10'~.
Fig. 8. Average HTTP session throughputs for 20%, 50% and 80% of traffic loads
A. Padhye 's TCP Throughput Model and Analysis.
Padhye's model is a simple analytical characterization of the steady state throughput of a bulk transfer TCP flow as a function of maximum window size, loss rate, round trip time, and retransmission timeout. The studies were then validated by empirical measurements between 18 hosts scattered across the United States and Europe. Two different collective sets of data are obtained from two different measurement configurations. The first data sets are corresponded to 1 hour long of 24 TCP Reno connections, each of which the sender behaves as an "injnite source" which always has data to send and only limited by the TCP congestion control. The second
-
data sets are corresponded to 13 pairs of TCP sender-receiver. Each pair serially initiated 100 TCP connections for 100 seconds, and was followed by a 50 second gap before the next connection was initiated. Based on these measurements, Padhye's model has been empirically validated and proven to be accurately predicted the TCP throughput over a significantly wider range of loss rates compared to the previous studies in [17].Padhye concluded in 1161 that the TCP throughput model in [17] was inaccurate and highly estimated the TCP throughput mainly because it predicts throughput by assuming packet losses only based of triple-duplicate acknowledgements "TD-
Only". Padhye also highlighted the importance of including TCP retransmission timeout (TO) behavior in the modeling perspective because this behavior commonly observed in real- time TCP throughput measurement.
[image:11.570.25.263.69.274.2] [image:11.570.281.525.69.247.2]paper ID: NWPJ-201203-36
round are correlated. The correlation of packet loss within a round assumed that if a packet loss in a round of TCP transmission, then all remaining packets transmitted until the end of the round are also lost which also has been justified
study [IS]. The second assumption was that TCP round-trip-time is independent of window size. The third assumption was that the time spent in TCP slow-start phase is negligible compared to the total duration of TCP connection. ~ o t h of second and third assumptions were also made in
related studies in [17, 19, 201.
The throughput (B,) in [16] is commonly presented using Eq. (23) where B, represents the number of packets sent per unit of time regardless of their eventual fate (e.g. received or lost).
Eventually, the long term steady state TCP throughput B(p) as a function of packet loss probability (p) can also be expressed in Eq. (24), where Y , define the number of packets sent in the ith triple-duplicate (TD) period and A, is the duration of the period.
Then, E[Y] is defined in Eq. (25) as a fimction of E[a] and window size E P ] .
E[Y] = E [ a ] + E[W]- 1 (25
The derivation of E[a] considers a random process of {aili, where a, is a number of packets sent in a TD period up to and including the first packet that is lost. Based on the previous assumption that packets lost in a TCP transmission round are independent of any packet lost in other round, then {a,}, can be regarded as a sequence of independent and identically distributed (i.i.d.) random variables. Thus E[Y] can be written as a function of loss probability (p) and window size E[W] as shown in Eq. (26).
The complex derivation of E p ] and E[A] values in [16] as a function of packet loss probability (p), number of packet that are acknowledged by a received ACK (b) and the round-trip- time (RTT) lead to Eq. (27) and (28) respectively.
Hence, fiom Eq. (24), (26), (27) and (28) the TCP throughput, B@), for the "TD-Only" model can be expressed as in Eq. (29). The model is derived without considering the maximum TCP window limitation and thus the TCP throughput values can grow toward infinity [16].
The Padhye's model expands the "TD-Only" model in Eq. (29) to include both TD and TO loss indications as well as the TCP window limitation factor. The model modifies Eq. (24) and expressed the TCP throughput as in (30).
(30)
The E[R] and E[z~'] are the expected values of the R, and ZTO, variables. R, refers to the total number of packet retransmissions in the duration of timeout sequence
zToi
E[R] and E[z~'] variables are defined as in Eq. (31) and (32) respectively.f
( P )E[z~' ] = TO-
1-P (32)
where
f ( P ) = l + p + 2 p 2 + 4 p 3 + 8 p 4 + 1 6 p 5 + 3 2 p 6 (33)
The derivation of Q variable can be approximated as in Eq. (34) where Q ( W ) is the probability that a loss occurs in a TCP window of size w is a TO.
Q =
G(E[wI)
(34)Finally, the complete characterization of TCP throughput B(p) is defined in Eq. (35) which is referred as the 'Ifull- model".
where M(p) and NO) are specified in Eq.(36) and (37) respectively.
1 M ( P ) =
b(w,,
)-
1-P (36)
B ( P ) =
-
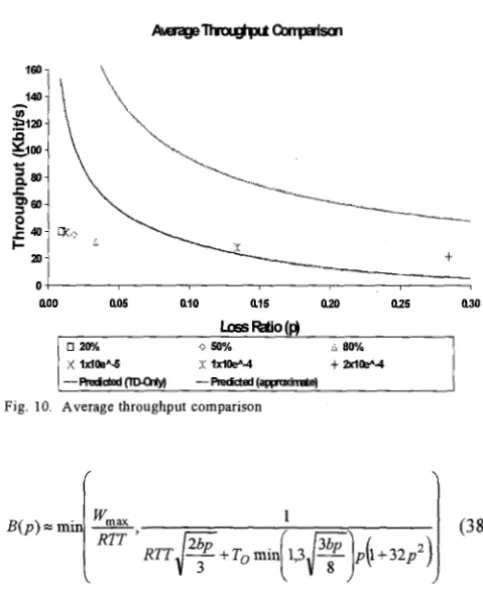
The E(WJ is the unconstrained window size variable defined in Eq. (27) and W,,, is the maximum TCP window size. The approximation of B@) in Eq. (35) is shown in (38) and referred as the "approximate-model".
1
*+
E[W]+
Q(E[w])-' - P
E[Wu] < W,,
1-P
-+
w,,
+
M ( p )Paper ID: NWPJ-201203-36
.< IxlOeAb X 1x10&4
+
mw4-
M d e d CIDQly) -Redctal(appmi&e]Fig 10 Average throughput comparison
~ ( p )
-
minI
1RTT ' R T T E + TO m i + 3 E ] p ~ + 3 ~ p 2 )
B. Timeout and Round-Trip-Time Variables in NS-2
The derivation of timeout, TO and round-trip-time, RTT variables are the crucial factors in TCP throughput calculations. NS-2 follows the recommendation of [21, 221 for the mathematical derivation of both variables which has been comprehensively elaborated in [23, 101. The C++ source codes for the TCP algorithm can be found in tcp.cc and tcp. h files of NS-2 for simulation programming references.
The NS-2 optimized the TO value to balance a tradeoff condition. A small TO value will lead to unnecessary packet retransmission while a large TO value will cause high latency of packet loss detection. The TO variable has been defined as a function on network RTT which is the time required for a data bit to travel from a source node to the destination node and travel back to the source node. The RTT may vary for each transmitted packet due to the network dynamic condition. The smoothed (average) RTT ( ? ) and RTT variation (q) are computed based on the collected RTT samples which the used to compute the RTO value. Based on [21], the instantaneous smoothed RTT, RTT variation and instantaneous TO are computed using the following equations. Let t(k) be the kfh RTT sample collected upon receiving ACK from the receiver. Next, let t ( k ) , of(&,) and TO(k) be the values of
i,
of and TO respectively when kfh RTT sample is determined. Then the variables are defined as follows.where ub and lb are the constant upper and lower bounds on the TO value. The default values for ub and ul in NS-2 are 60 second and 0.2 second respectively. The constants a E (0,i)
and ( 0 ~ ) are usually set to 718 and 314 respectively. The variable y is the binary exponential backoff (BEB) factor. It is initialized to 1 and doubled for every timeout event and is reset to 1 when a new ACK packet arrives.
C. TCP Throughput Comparison
In this subsection, we compare between the TCP throughput obtained from the NS-2 simulation results (section III(D)) and the Padhye's TCP approximate-model as in Eq. (38) and also TD-Only model as in Eq. (29). We plotted two separate graphs as in Fig. 10 for LEO and GEO scenarios respectively.
The RTT and TO parameters are calculated based on collected data in section III(C). Some assumptions for the parameters calculations are made as follows.
1. RTT, m ( 2 x ~ , ) : We assumed that the round-trip- time is approximately two times the en-to-end delay as in Eq. (1).
2. i = : We assumed that the average smoothed
RTT, I , is approximately equal to the average RTT, as in 1. calculated from all D, trace data in precious section III(C).
3. c,
-.I
CRTT,
1
: We assumed that the averageRTT variation, n, , is approximately equal to the standard deviation of all RTT, calculated in 1. with mean value as in 2..
Then, the average TO parameter is calculated using Eq. (41) based on average values approximation obtained previously. Noted that the TO in Eq. (38) is referring to the initial timeout duration as stated in [16]. Therefore, the BEB factor ( y ) in Eq. (41) is set to 1. As the results, we obtained the average RTT and TO parameters as shown in Table IV. These values are then used to plot the predicted TCP throughput of approximate-model and TD-Only model as a function of packet loss ratio (p) as shown in Fig. 10.
[image:13.564.29.271.69.364.2]paper ID: NWPJ-201203-36
conditions. The highly fluctuation of RTT values over LEO scenario is correlated to the rapid handover process between p u n d station to satellite and also among the satellites in the constellation. In addition, due to the lower altitude of LEO satellites, the average TCP connection duration is relatively short and eventually the average packet loss per connection is smaller than the predicted model.
V. CONCLUSION
In this paper, we provide an overview of end-to-end QoS measurement of IP-Diffserv network model in NS- 2. The QoS simulation measurements (packet delivery
fraction, end-to-end delay and throughput) involve many short web traffic session transmissions in both terrestrial and over LEO-Iridium satellites. In addition, the simulations involve both error-free and link-loss environment. For the packet delivery ratio (PDR) measurement, we found that the PDR is inversely proportional to the increment of traffic load in error- free condition and also to the increment of BER. However, the increment of BER give more significant effect to the decrement of PDR compared to the increment of traffic burst. This mainly because many packets are dropped in high BER compared to the one in high traffic load. Besides that, the end- to-end delay is proportional to the increment of both traffic load and BER. Longer time needed to successfully transmit packets from source to destination. Finally, the average session throughput is inversely proportional to the increment of traffic load and BER. This mainly because many packets are dropped and longer time needed to complete a HTTP
' session transfer.
Based on the TCP throughput comparison, our hypothesis is that both TD-only model and approximate model are more suitable to predict the throughput of long TCP connection, where the steady state condition occurs for long period of time. The Markovian process assumption that packets lost in a TCP transmission round are independent of any packet lost in other round seems inaccurately predicted the throughput in some cases of our simulation studies especially in LEO network scenario. In our simulation studies, the random variables of inter-arrival time and files size of the TCP connection follow the Exponential and Pareto distributions respectively. New connection with variable file size starts randomly without waiting for the previous connection to finish. If many connections take a lot of time to finish, then the accumulative bandwidth usage may grow even bigger. At a time, there will be series of congestions or packet losses on each active TCP connection and eventually degrades the global TCP throughput. Furthermore, the effect link handover and packets buffering processes also significantly contribute to the variation of end-to-end TCP throughput. In addition to the above mentioned improvement factors, a more precise throughput calculation can be obtained if the analytical model includes the effect of fast recovery and fast retransmit mechanisms as these are the key elements of TCP reliable data transmission.
VI. FUTURE WORKS
The future research will give focus on admission control on multicast traffic in a large scale network scenario that involve both terrestrial and inter-satellite communications. It would be possible to combine Diffserv and traffic engineering (TE) like MPLS to provide better QoS guarantees for multicast traffics so that the overall network performance could be maintained at optimum level either in error-free or link-loss environment.
The authors are pleased to acknowledge the support of UK- ESPRC and MONET project.
[ I ] K. Nichols, S. Blake, F. Baker and D. Black, "Definition of the Differentated Services Field (DS field)in the P v 4 and P v 6 headers," IETF Network Working Group, FRC 2474, December 1998.
[2] S. Blake, D. Black, M. Carlson, E. Davies, Z. Wang and W. Weiss, "An architecture for Differentiated Services," IETF Network Working Group, RFC 2475, December 1998.
[3] G. Zhang and H.T. Mouftah, "End-to-end QoS guatantees over Diffserv networks," in Proceedings of 6'" IEEE Symposrum on Computers and Communrcatrons, Hammamet, Tunisia, pp.302-309, 2001
[4] J. Yang, J. Ye, S. Papavassiliou and N. Ansari, 'Decoupling end-to-end QoS provisioning from service provisioning at routers in the Diffserv network model," in Proceedrngs of Internatronal Conference on Global
Telecommunrcations, GLOBECOM 2004, vo1.3, no.1, pp.1605-1611,
November 2004.
[5] J. Yang, J. Ye, S. Papavassiliou, "Enhancing end-to-end QoS granularity in Diffserv network via service vector and explicit endpoint admission control," IEEE Journal of Communrcations, voI.151, no. 1, pp.77-81, February 2004.
[6] L . Zhou, H.K. Pung and L.H Ngoh, "A cross-domain framework for coordinated end-to-end QoS adaptation," in Proceedings of 33th IEEE conference on Local Computer Networks, LCN 2008, Montreal, Canada, pp. 532-533, October 2008.
[7] L. Myounghwan, J.A. Copeland, "An adaptive end-to-end delay assurance algorithm with Diffserv architecture in IEEE 802.11eiIEEE 802.16 hybrid meshirelay networks," in Proceedings of 18th Internatronal Conference on Computer Communrcatrons and Networks, ICCN 2009, pp. 1-6, September 2009.
[8] L. Audah, Z. Sun and H. Cruickshank, "End-to-end QoS evaluation of
IP over LEOIGEO satellites constellations for FTP," in Proceedrngs of 5'" International Conference on Bgnal Processrng Systems (ICSPCS 2011), Honolulu, USA, December 2011.
[9] L. Audah, Z. Sun and H. Cruickshank, "End-to-end QoS of P-Diffserv network over LEO satellite constellation," in Proceedrngs of 2"d
Internatronal ICST Conference on Personal Satellite Servrces, PSATS 2010, Rome, Italy, February 2010, pp. 99-113.
[ l o ] K. Fall and K. Varadhan, "The NS manual," The VMT Project, February 2008.
[I 11 B. Pattan, "Satellite-based cellular communication," 1" edition, Mcgraw- Hill, November 1997, ISBN-10: 0070494177.
[I21 Optical Carrier Transmission Rates, Wikipedia,
http:iien.wikipedia.orgiwiki/Optical~Carrie~ransmission~rates.
[13] M.E. Crovella and A. Bestavros, "Self-similarity in World Wide Web traffic: evidence and possible causes," IEEE/ACM Transaction on
Networkrng, vol. 5, No. 6, pp. 835-846, December 1997.
[I41 B. Sikdar, S. Kalyanaraman and K.S. Vastola, "An integrated model for the latency and steady-state throughput of TCP connections," Elsevrer
Journal of Performance Evaluatron, vol. 46, no. 2-3, pp. 139-154,
October 200 1.
[I51 S. Makki, N. P~ssinou and P. Daroux, "A new routing algorithm for low earth orbit satellite networks," in Proceedings of 10th International Conference on Computer Communications and Networks, ICCCN 2001, Arizona, USA, August 2001, pp. 555-561.