Application of the Spectrum Peak Positioning Technology
Based on BP Neural Network in Demodulation of Cavity
Length of EFPI Fiber Optical Sensor
*
Mengran Zhou, Mengya Nie
Anhui University of Science and Technology, Huainan, Anhui, China. Email: [email protected]
Received October 2013
ABSTRACT
An Extrinsic Fabry-Perot Interferometric (EFPI) fiber optical sensor system is an online testing system for the gas den- sity. The system achieves the measurement of gas density information mainly by demodulating the cavity length of EF- PI fiber optical sensor. There are many ways to achieve the demodulation of the cavity length. For shortcomings of the big intensity demodulation error and complex structure of phase demodulation, this paper proposes that BP neural net- work is used to locate the special peak points in normalized interference spectrum and combining the advantages of the unimodal and bimodal measurement achieves the demodulation of the cavity length. Through online simulation and actual measurement, the results show that the peak positioning technology based on BP neural network can not only achieve high-precision demodulation of the cavity length, but also achieve an absolute measurement of cavity length in large dynamic range.
Keywords: EFPI Fiber Optical Sensor; The Demodulation of Cavity Length; BP Neural Network; The Peak Positioning Technology
1. Introduction
EFPI fiber optical sensor is widely used in the gas densi- ty detecting system with unique advantages, such as small volume, simple structure and high sensitivity [1]. The F-P sensor cavity length demodulation is not only a main way to obtain the information of gas density, but also a key part of the whole detection system. By the influence of the light source and the optical wave, traditional de- modulating mode for the entire demodulation results can cause great errors. It is difficult to realize stability and accuracy of signal measurement [2]. There are many me- thods to demodulate fiber optical sensor cavity length, such as the intensity demodulation and phase demodula- tion. Based on previous studies, this paper proposes that repeated training on the input signal can make the mini- mized error between the final output value and expecta- tions, and using the approximation of nonlinear function achieves the recognition of peak levels.
2. The Basic Principle of EFPI Fiber Optical
Sensing System
The sensor system uses laser as signal source of detecting gas concentration. The light is emitted by the laser, and it reaches fiber isolator through optical fiber transmission, and then light is incident to the F-P cavity when goes after 2 × 2 couplers. When light combined with gas in the cavity, interference output signal carrying the informa- tion of gas density would be transferred by fiber optical and couplers. The gas density information is demodu- lated by light interference analyzer, then after photovol- taic conversion, the clutter signal is filtered off and the signal is amplified. The signal processing unit analyzes digital signal transmission, and finally the MCU (Micro Control Unit) will control signal output and warn prompt. Fundamental principle of the whole system is shown in
Figure 1.
The advantages of fiber optical EFPI sensor is: high resolution; high sensitivity; large dynamic range; wide frequency band; sensing and transmitting large amount of information; small volume and light weight; corrosion resistance; electromagnetic interference; easy to reuse the formation of sensor network; easy real-time, on-line, dis-
*
Optical fiber transmission Laser light
source
Isolator
Interference analyzer
Coupler
DMF Lock-in amplifier
EFPI sensor
Signal processing unit Signal source
Figure 1. The basic principle of EFPI fiber optical sensor system diagram.
tributed and multiple parameter sensing. Especially EFPI fiber optical sensor can work in the inflammable, explo- sive, high temperature and high pressure environments.
3. The Demodulation of EFPI Sensor Cavity
Length by Using the Spectrum Peak
Positioning Technology
3.1. The Basic Principle of the EFPI Sensor Cavity Length Demodulation
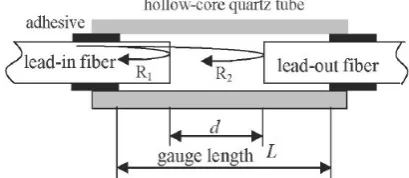
F-P cavity length as shown in Figure 2 is between two optical polishing surface distances. In order to achieve the measurement of wide dynamic range and high resolu- tion, accurate information of the cavity length is obtained from optical interference signal, which is returned from the EFPI fiber optical sensor through effective signal de- modulation. Through tracking changes of wavelengths of spectral peak in particular interfered order Cavity length demodulation of EFPI fiber optical sensor which is based on the spectral peak location will obtain the information of cavity length. The demodulation method has many kinds, such as: unimodal measurement, bimodal measure- ment, BP neural network measurement etc [3]. Though unimodal measurement resolution is very high, the range of measurement is finite; bimodal measuring method can realize the measurement of large dynamic range. How- ever, the resolution is too low. This paper presents that using BP neural network locates the spectral interference spectrum, so that the resolution of cavity length with wide dynamic range and high resolution can be achieved. Spec- tral interference signals collected by the system are treated to get the change information of long cavity through the analysis of interference spectrum changes.
3.2. Spectral Peak Location Technology Based on BP Neural Network
3.2.1. BP Neural Network
BP neural network is a multilayer feed forward network [4], it mainly consists of three parts: input layer, output
Figure 2. The structure diagram of EFPI fiber optical sen-sor.
layer and hidden layer. Function f are often used as the transfer function of neurons to realize arbitrary nonlinear mapping:
( )
11 cx
f x
e− =
+ , c>0 (1) [6] c is the neurons input. Its basic principle is to minimize the squared error between the expected value and the output value by adjusting the weights of the network. BP neural network is divided into forward propagation and back propagation. In the training process of forward propagation, each layer of neurons will only change with a layer of neurons. When the output layer does not reach the expected value, the actual error is calculated out and then the error signal fed back to the original. Repeatedly revising each layer neuron weights makes the error of prediction to the minimum.
In the whole network, input layer [5] contains N neu- ron p1, p2, p3,..., pn, each neuron has a correspond-
ing weight. As shown in Figure 3, p1, p2, p3,...,pn
corresponding respectively to weights G1, G2, G3,..., n
G . An offset a is in the hidden layer, all the neurons and the corresponding weights do multiplication and ac-cumulation as network input signal λtatal:
1 1 2 2
total p G p G p Gn n
λ = + + + (2) If the overall input signal is λtotal, then
1 2
total n
λ =λ λ+ + + λ (3) The input signal of each layer respectively enter the transfer function f, output signal of neurons κ can fi- nally be obtained through operation processing,
( )
K= f ω (4)
3.2.2. The Tracing of Spectral Peak by Using BP Neural Network
[image:2.595.56.289.95.219.2] [image:2.595.321.526.99.188.2]Figure 3. BP neural network.
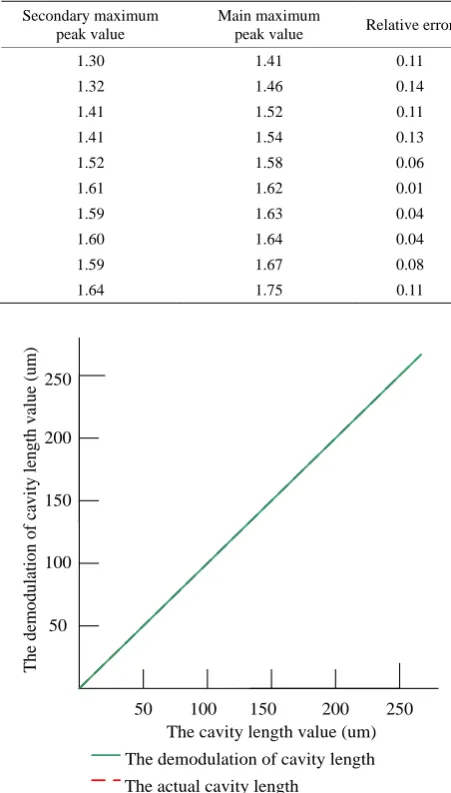
ue of the main and secondary maximum peak can be found out from the normalized interference spectrum that has been collected. After repeated sampling, discrete vari- ation curve of cavity length in two-dimensional phase space range is drawn with the main maximum peak wa- velength values as abscissa and maximum peak wave- length values as ordinate, as shown in Figure 4.
A three layer BP neural network is constructed for the change trajectory of cavity length in all phase space. Taking the main maximum peak wavelength values as input layer N neurons in input, the output layer corres- ponds to the maximum peak value of wavelength. The transfer function f(x) will greatly take peak wavelength values into operation through repeated training and posi- tive and negative transmission to correct weight values. The actual trajectory is compared with the trajectory of adjacent levels after the training output. The relative er- ror is shown in Table 1. If the relative error is less than 0.5nm, it shows that accurate position of peaks is suc- cessfully tracked. We shall assume that using neural network demodulates interference spectrum with a cavity length of L1. Orders of spectral peak k appears at the
point of wavelength λ1, k−1 orders show spectral
peak at λ2; When the cavity length change into L2,
1
k− orders show spectral peak at the corresponding wavelength λ1,k−2orders show spectral peak at λ2 + Δλ, then:
1 1
2L =kλ (5)
( )
1 2
2L = k-1 λ (6)
( )
2 1
2L = k-1 λ (7)
( )(
)
2 2
2L = k-2 λ + ∆λ (8)
Reach: 3 1 41 1
2 2
k= + ∆λλ + (9) [7]
After the formula (9) is applied to the formula (5), the cavity length value L1 of neural network demodulation
can finally be obtained.
[image:3.595.75.271.97.212.2]From the Figure 5, it can be seen that after neural network demodulation, the cavity length value is very
Figure 4. Phase space trajectory curve of F-P cavity length.
Table 1. Adjacent level maximum peak wavelength and relative error.
Secondary maximum peak value
Main maximum
peak value Relative error
1.30 1.41 0.11
1.32 1.46 0.14
1.41 1.52 0.11
1.41 1.54 0.13
1.52 1.58 0.06
1.61 1.62 0.01
1.59 1.63 0.04
1.60 1.64 0.04
1.59 1.67 0.08
1.64 1.75 0.11
Figure 5. Demodulation of cavity length and actual cavity length comparison diagram.
close to the actual cavity length value, which shows the superiority of this demodulation method [8].
50
The cavity length value (um)
100 150 200 250
50 100 150 200 250
The demodulation of cavity length value
(um
)
[image:3.595.307.533.274.671.2] [image:3.595.121.285.566.670.2]4. Improved Algorithm of Neural Network
Because BP neural network has the disadvantage of slow converging speed and a tendency to the local extreme operation. Serious impact on its generalization ability is not conducive to the demodulation process of cavity length. To overcome the disadvantages, it can be respec- tively from two aspects of sample set and the weights in improving neural network algorithm. A steepness factor
δ is introduced in the transfer function f x( ):
( )
/1 1 cx
f x
e− δ =
+ (10)
An error plane exist flat area [9], which makes the dif- ference between the network output and the expected value. After importing the steepness factor δ and making
1
δ > , the input space of neurons is reduced. Whenδ >1,
the input neurons decrease δtimes. The growth of neuron function’s sensitive area leads to the input neurons into the unsaturated area. When δ =1, the transmission func- tion f x( ) recovers to its original state, which has high sensitivity for small input.
From Figure 6, joining the steepness factor can effec- tively improve the insufficiency of neural network and the network generalization ability.
Training sample
Output data
(a) Sample input and output
Output data
Training sample
(b) Validation sample input and output
Deviation
Training times
(c) Training times and error
Figure 6. The simulation results of improved algorithm of neural network diagram.
5. The Results of Experiment and Simulation
Analysis
Spectral peak locating technology based on neural net- work shows that, for the normalized interference spec- trums of different SNR (signal-to-noise ratio), there are obvious differences in capturing error of the starting point, the vertex point and the end point. The spectral peak lo- calization can be effectively realized by using NMME formula:
p p N
NMME mean abs
∧ −
=
(11)
Where ˆp is the estimated position of peak, p is the real position of peak and N is the sampled data points of the discrete Fourier transform.
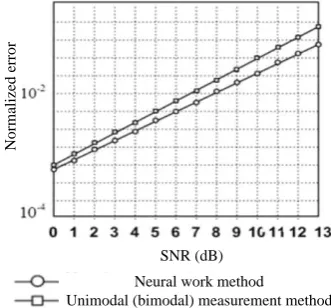
The simulation in Figures 7 and 8 shows that when SNR is greater than 5 dB, the estimated peak value
NMME will below 6%. In the same SNR, using neural network to locate peaks of normalized error is signifi- cantly less than the unimodal or bimodal measurement.
Normalized error
Neural work method
Unimodal (bimodal) measurement method SNR (dB)
Figure 7. The normalized error of spectrum peak starting point under different signal to noise ratio.
Normalized error
Neural work method
Unimodal (bimodal) measurement method SNR (dB)
[image:4.595.339.505.357.511.2]6. Conclusion
Whether in theory or in practice, peak tracking technique based on BP neural network can realize the demodulation of F-P cavity length information and solve the defect of the single (double) peak measurement method which can not realize the measurement of high resolution, high dy- namic range [10]. By introducing the factor of gradient to improve the neural network algorithm, the cavity length demodulation accuracy is strengthened.
REFERENCES
[1] Y. Jiang and W. H. Ding, “Recent Developments in Fiber Optic Spectral White-Light Interferometry,” Microwave and Optical Technology Letters, Vol. 1, No. 1, 2011, pp. 62-71.
[2] S.-H. Kim, J.-J. Lee, D.-C. Lee and I.-B. Kwon, “A Study on the Development of Transmission-Type Extrinsic Fa- bry-Perot Interferometric Optical Fiber Senor,” Journal of Lightwave Technology, Vol. 17, No.10, 1999, p. 1869. [3] Y.-J. Rao, “Recent Progress in Fiber-Optic Extrinsic Fa-
bry-Perot Interferometric Sensors,” Optical Fiber Tech- nology, Vol. 12, No. 3, 2006, pp. 227-237.
[4] M. R. Zhou and Y. Zhang, “Application of Artificial Neural Network BP Algorithm in Near Infrared Spec- troscopy,” Infrared, Vol. 11, 2006, pp. 1-4.
[5] M. R. Zhou, L. Y. Qi and L. Wang, “Applied Research of Neural Network BP Algorithm in Gas Absorption,” Spec- trum Safety in Coal Mines, Vol. 10, 2008, pp. 1-3. [6] X. Q. Cao, J. G. Zhu and R. Y. Tang, “Soft-Sensing Te-
chnology Based on Improved BP-Neural-Network,” Chi- nese Journal of Scientific Instrument, Vol. S1, 2005, pp. 185-186.
[7] Z. G. Jing, “Study on White Light Extrinsic Fabry-Perot Interferometric Fiber optical Sensor and Its Applications,” PhD Thesis, Dalian University of Technology, 2006. [8] G. G. Amiri, A. Shahjouei, S. Saadat and M. Ajallooeian,
“Hybrid Evolutionary-Neural Network Approach in Gen- eration of Artificial Accelerograms Using Principal Com- ponent Analysis and Wavelet-Packet Transform,” Journal of Earthquake Engineering, Vol. 15, No. 1, 2011, pp. 50-
76.
[9] N. Yadaiah and M. VeeraChary, “Adaptive Controller for Peak Power Tracking of Photovoltaic Systems,” Systems Analysis Modelling Simulation, Vol. 42, No. 9, 2010, pp. 1319-1344.
[10] S. C. Liu, Z. W. Yin, L. Zhang, X. F. Chen, L. Gao and J. C. Cheng, “Dual-Wavelength FBG Laser Sensor Based on Photonic Generation of Radio Frequency Demodula- tion Technique,” Journal of Electromagnetic Waves and Applications, Vol. 23, No. 16, 2012, pp. 2177-2185.