Cost Effective Grading Process for Grape Raisins based
on HSI and Fuzzy Logic Algorithms
Swati P. Pawar
SVERI’s College of Engineering, Pandharpur Dist.Solapur State:Maharashtra
Amit Sarkar
SVERI’s College of Engineering, Pandharpur Dist.Solapur State:Maharashtra
ABSTRACT
Farmers of several progressive countries like India are producing the grape raisins. However, the existing grading systems in these countries are human expert based and judgmental. The image based sorting and grading systems developed in the advanced countries are costly and are sometimes slow as they do analysis of individual raisin. This work proposes to develop a cost effective grading process for grape raisins which will give judgment about grading of bulk of raisins sorted manually or mechanically. In this study, the database is developed using the images taken by simple webcam from the local raisin market. Based on the opinion of the raisin experts, these images are grouped into four classes. The Hue, Saturation and Intensity (HSI) color features of these images are obtained to develop the fuzzy logic system for the classification of the images of different grades. The Gaussian membership function is used for developing the four rules for four grades. The performance of the fuzzy classification system is measured in the form of Success Rate. The results show that for more than four features, the raisin grading can be classified with 100 % success rates.
Keywords
Raisin sorting, Color image segmentation, Machine Vision, Intelligent System, Feature Extraction
1.
INTRODUCTION
Raisin produce in India has grown tremendously over the period and the farmers are willing to adopt the advanced processes for getting better yield. Existing approach of sorting and grading of raisins is manually and with some mechanical equipment based on size sieves. Due to manual sorting and grading, the standardization about grades of the raisins is not available which results in either faulty grading or exploitation of farmers about the grading of raisins. Few studies in the literature [1-4] have developed sorting and grading of raisins based on individual raisin. However, these methods need costly equipments and complicated setups. Therefore, there is need for development of cost effective raising grading process which is affordable for farmers as well as the small traders. The trend of usage of image analysis and computer in agricultural has be reviewed by Raji and Alamutu [6].They have discussed various basic concepts and technologies associated with computer vision, a tool used in image analysis and automated sorting. Computer vision for quality inspection of fruits. Quality inspections of fruits have two different objectives: quality evaluation and defect finding. The machine vision captures the external feature measurements such as color intensity, color homogeneity, bruises, size, shape and stem identification (Lee et al. [7]; Majumdar and Jayas[8]; Shahin and Symons[9]; Paliwal et al.
[10] Shigeta et al. [11]). Several researchers have used the advanced approaches in the process. An automatic trainable classifier based on artificial neural network for separating different varieties of nuts was developed Omid et al. [12]. They have concluded that the color feature the most important parameter in classification and sorting of raisins. Khojastehnazhand et al. [13] developed a machine vision system to automatically determine the volume and surface area of orange.
Recently Mollazade et al. [1] developed a process for grading of raisins based on color and shape features for data mining of these different classifiers used ANNs, SVMs, DTs and BNs. Xinjie et al. [2] used least squares SVM for classification of color and texture features for classification of raisins. Xiaoling[3] calculated the different physical parameters of raisin and Neural network is used for classification. Abbasgholipour et al. [4] segmented the raisin image using permutation coded genetic algorithm and HIS color space is used to select desired and undesired raisin. Omid et al. [5] has developed Microcontroller based electronic system for grading of raisins based on their color and size. These studies have applied these algorithms on individual raisins which is computationally costly. However, in reality the judgmental grading of raisins is based on the bulk quality of raisins.
[image:1.595.319.564.578.718.2]In this study, a cost effective approach is developed for bulk grading of raisins based on the color texture features extracted using HSI color model and fuzzy logic classifier. Color texture features are obtained through SGDM matrices where total 21 features are obtained. Based on these features a fuzzy classification system is developed. The Gaussian membership function is used for the fuzzy classification system. The performance of the system is evaluated in the form of success rate for different feature.
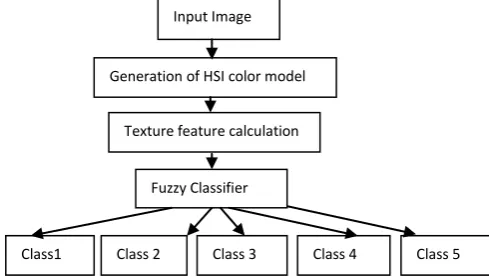
Fig 1: The raisin classification Process Chart Input Image
Generation of HSI color model
Texture feature calculation
Fuzzy Classifier
Class 1 Class 2
Class 3 Class 4
[image:2.595.54.259.80.412.2]Class 5
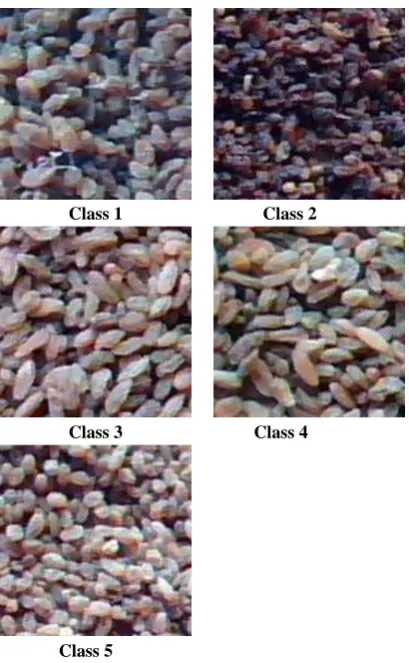
Fig 2: Typical Samples of raisin
As shown in Figure 1 the image based raisin grading needs system needs image acquisition equipment, image feature extraction algorithm and image classification algorithm. In this study, the webcam of 1.3 megapixel is used to acquire the image database with constant height of the camera from the raisin object. The database is developed from the local market and the images are grouped in for classes as class1, class 2, class 3 and class 4. The typical samples of these raisins are shown in Figure 2. The HSI based feature extraction algorithm is used to obtain the features of these images. The features obtained from this algorithm are used for the development of fuzzy classification system.
2.
HSI BASED FEATURE EXTRACTION
Statistical approach, which is used here, is a quantitative measure of arrangement of intensities in a region. Statistical methods use second order statistics to describe the relationships between pixels within the region by constructing Spatial Gray-level Dependency Matrices (SGDM). Extraction of a numerous texture features are possible using the SGDM matrices generated in the above manner. Each pixel map is used to generate a color co-occurrence matrix, resulting in three CCM matrices, one for each of the H, S and I pixel maps. These matrices measure the probability that a pixel at one particular gray level will occur at a distinct distance and orientation from any pixel, given that pixel has a second particular gray level. For a position operator p, we can define a matrix ‘Pij’ that counts the number of times a pixel with grey-level i occurs at position p from a pixel with grey-level j.
The SGDMs are represented by the function P (i, j, d, Ө) where ‘i’ represents the gray level of the location (x, y) in the image I(x, y), and j represents the gray level of the pixel at a distance d from location (x, y) at an orientation angle of Ө. Texture involves the spatial distribution of gray levels. Hence SGDM matrices were used to calculate various texture features. These features are useful in carrying out differentiation algorithms for skin defect detection purpose ahead.
For differentiating classes the following features were calculated from the components H, S and I:
Contrast:
i
j
P
j
i
Co
Ng j i,
)
(
1 1 , 2
(1)Cluster Shade:
(
,
)
3 1 1 ,j
i
P
P
j
P
i
Cs
Ng j i y x
(2)Cluster Prominence:
)
,
(
)
(
4 1 1 ,j
i
P
P
j
P
i
C
Ng j i y x p
(3) Local homogeneity:
i
j
P
j
i
L
Ng j i H,
)
(
1
1
1 1 , 2
(4) Mean Intensity:)
(
1 0i
iP
Mi
Ng i x
(5) Variance:)
(
)
(
1 0i
P
Mi
i
V
Ng i x
(6) Mean :
N i N jj
i
x
N
Mk
1 1 2(
,
)
1
(7)
Where, P (i, j) is the (i, j) th entry in SGDM matrix and Ng is total number of gray levels considered for generation of SGDM matrix. Px and Py are defined by
1 0 1 0)
,
(
Ng j Ng ix
i
P
i
j
P
1 0 1 0)
,
(
Ng i Ng jy
jP
i
j
3.
FORMULATION OF FUZZY SYSTEM
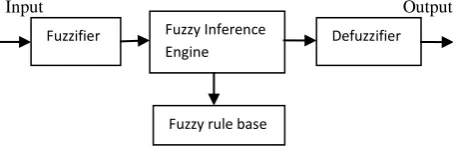
A fuzzy system (FS) is any fuzzy logic (FL)-based system, which either uses FL as the basis for there presentation of the different forms of knowledge, or to model the interactions and relationships among the system variables. FL and the fuzzy sets position modeling into a novel and broader perspective in that they provide innovative tools to cope with complex and ill-defined systems for which classical tools are often unsuccessful. This is because fuzzy systems are universal approximates of nonlinear functions. Two aspects in the design of the fuzzy system are difficult: (1) generating the best rule set and (2) tuning the membership functions. The rules and the membership functions must accurately capture the relationship between the independent and dependent variable. Unfortunately, the task of tuning of membership function and generating rules are not independent. The task of selecting membership functions and rule values is difficult since the information has to be obtained from numerical data of the system to be modeled. Another problem is selecting an appropriate number of fuzzy sets. Most studies use experience to come up with this number. Often, symmetric fuzzy sets are assumed. However, assuming symmetry in the fuzzy sets also implies assuming symmetry in the system being modeled. In this section, we formulate the fuzzy logic system for automatic grading of raisins the schematic representation of fuzzy logic system is shown in fig. 3
Input and output
Inputs to the fuzzy logic system are texture features obtained from SGDM matrices the output of the system is measured in terms of success rate the number of features are represented by F.
F= {e1 e2 ….e7}T
D= { Each class of texture features}
In this system features represent crisp numbers. Fuzzy set with Gaussian membership function are used to define these input variables these fuzzy sets can be defined using following equation
2 5 . 0
)
(
m x
e
x
(8)
Where m is mean and
is the standard deviation of fuzzy set.Rules of the fuzzy system are obtained by fuzzification of numerical values of texture features is given below
1. The fuzzy sets corresponding to each texture feature are generated and maximum degree of membership function will
be
1
for each fuzzy set.2. Each texture feature is assigned to the fuzzy set with maximum degree of membership suppose for Rule i we are giving the inputs then fuzzy set will generate D number of membership function A .
Therefore , Rule i will be generalized as If e1 is Ai1 AND
E2 is Ai2 AND .
.
E7 is Ai7 THEN
Maximum success rate indicates corresponding class of raisin
[image:3.595.304.558.57.747.2]Input Output
Fig 3.Schematic representation of fuzzy logic system
4.
RESULT AND DISSCUSSION
Figure 1: Feature plot between mean of Hue and Kurtosis of Saturation for 5 cluster
Figure 2:Feature plot between Standard Deviation of Hue and Local Homogeneity of Intensity for 5 cluster Fuzzifier Fuzzy Inference
Engine Defuzzifier
[image:3.595.313.540.193.266.2]Figure 3:Feature plot between Kurtosis of Saturation and Skewness of Intensity for 5 cluster
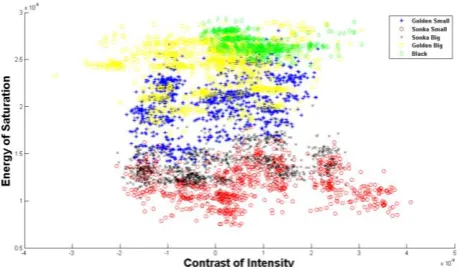
Figure 4:Feature plot between Contrast of Intensity and Energy of Saturation for 5 cluster
[image:4.595.57.289.299.438.2]Figure 5:Feature plot between Cluster Prominence oionf Saturation and Kurtosis of saturatation for 5 cluster
Figure 6:Success Rate for 5 Class
5.
CONCLUSION
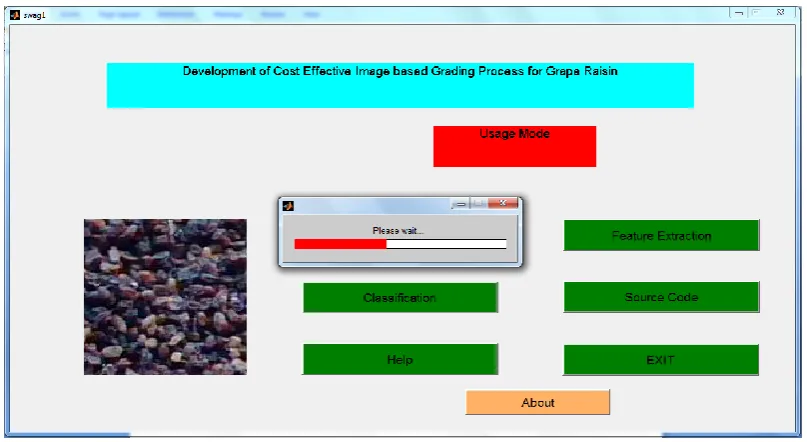
[image:4.595.60.290.490.626.2]Figure 7: Gui for feature extraction and classification
Figure 8: Grading result
6.REFERENCES
[1] K. Mollazade , M. Omid , A. Arefi “Comparing data mining classifiers for grading raisins based on visual features”, Journal of Computers and Electronics in Agriculture, vol.84,pp.124-131,2012.
[2] X. Yu, K. Liu, D.Wu and Yong He “Raisin Quality Classification Using Least Squares Support Vector Machine (LSSVM) Based on combined Color and Texture Features” Journal of Food And Bioprocess Technology,vol.5, pp.1152-1563, 2012.
[3] L.Xiaoling “Detection Level of Raisins Based on Neural Network and Digital Image” Circuits, Communications and System (PACCS), 2011 Third Pacific-Asia Conference pp.1-3,july 2011.
[4] M. Abbasgholipour , M. Omid, A. Keyhani, S.S. Mohtasebi“Color image segmentation with genetic algorithm in a raisin sorting system based on machine vision in variable conditions” journal of Expert Systems with Applications,vol.38,pp.3671-3678, 2011.
[5] M. Omid, M. Sharouzi and A.R. Keyhani “Development of an Automated Machine for Grading Raisins based on Color and Size” Journal of Modeling and Simulation of Systems, Vol.1,pp.157-162,2010
[6] A. Raji and A. Alamutu. “Prospects of Computer Vision Automated Sorting Systems in Agricultural Process Operations in Nigeria”. Agricultural Engineering International: the CIGR Journal of Scientific Research and Development”. Vol. VII. Invited Overview. February 2005.
[7] Lee, W. S., Slaughter, D. C. and Giles, D. K. . Robotic weed control system for tomatoes. Precision Agriculture, vol. 1, pp 95–113, 1999.
[8] Majumdar, S. & Jayas, D. S. (2000). Classification of cereal grains using machine vision II. Color models, Transactions of the ASAE, vol.43(6), pp.1677-1680
[9] Shahin, M. A. and Symons, S. J., “A machine vision system for grading lentils”. Canadian Biosystems Engineering, Vol. 7,pp. 7-14, 2001.
[10]Paliwal, J., Borhan, M. S. & Jayas, D. S. Classification of cereal grains using a flatbed scanner. Transactions of the ASAE, pp. 036103, 2003
[11]Shigeta, K., Motonaga, Y., Kida, T. and Matsuo, M. “Distinguishing damaged and undamaged chaff in rice whole crop silage by image processing”, Transactions of the ASAE Annual Meeting, pp. 043125, 2004
[12]Omid, M., Mahmoudi, A. and Omid, M. H. “ An intelligent system for sorting pistachio nut varieties”, Expert Systems with Applications, vol.36(9), pp.11528– 11535,2009.
[image:5.595.54.278.319.412.2]