Medical Image Colorization using Optimization
Technique
Ami A. Shah, Mikita Gandhi, Kalpesh M Shah
Faculty of ADIT, Gujarat Technical University, Anand (Gujarat)
Abstract- Colorization is a term used to describe a computerized process for adding color to black and white pictures, movies or TV programs. This process can also be used to convert the gray scale medical images to their colorized version, as color increases the visual appeal of an image and it also makes medical visualization more attractive. In the medical field, there used plenty of images especially X-Rays like dental, chest, leg, hand X-Rays and MRI Images. In this paper, we apply colorization based on optimization to colorize medical images and also evaluate its performance in terms of information loss using three proposed correlation coefficient parameters.
Index Terms- medical images ,colorization of medical images, information loss to colorize medical images, binary integrated edge curve.
Mathematics Subject Classification: 49N10 Computing Classification System: I.4.6
I. INTRODUCTION
Imaging technology in medicine made the doctors to see the interior portions of the body for easy diagnosis. It also helped doctors to make keyhole surgeries for reaching the interior parts without really opening too much of the body. In traditional medical imaging modalities, color and texture information can add considerable information for diagnostics. Presently, multimodal images of a patient are unregistered and referenced independent of each other, or registered and fused into a single hybrid volume. Doctors and other medical professionals need to be able to visualize and interrogate, on a per-patient basis, a wide variety of 2D and 3D data representations that can be created from non-invasive imaging modalities, such as MRI and CT. Intensive use of the multimedia technology is rapidly progressing and digital images will soon be common not only in medical practice, but also in medical education and research activities. In the medical field, exact recording and reproducing of colors are essential because recent investigations have shown that inappropriately reproduced colors may incidentally cause erroneous diagnoses [3].
Colorization is the art of adding color to a monochrome image or movie. The idea of ‘coloring’ photos and films is not new. Computer-assisted process was first introduced by Wilson Markle in 1970 for adding colors to black and white movies. In the last few years, several advanced and effective techniques for images and videos have been proposed. These techniques are based on: luminance keying and color transfer [1], image analogies [2], motion estimation [3], segmentation [4], color prediction [5], probabilistic relaxation [6] and chrominance blending [7], among many other techniques. Color based classification is widely used in all areas. In traditional medical imaging modalities, color and texture information can add considerable information for diagnostics [8]. Changes in color are more easily perceived than changes in shades of gray and therefore this procedure makes the interpretation and understanding of the image easier. During colorization process a scalar value representing pixel’s intensity is being replaced by a vector in a given color space. Since the mapping between intensity and color has no inherently correct solution, human interaction and external information usually plays a large role [4].
A major difficulty with colorization, however, lies in the fact that it is an expensive and time-consuming process. Interactive image segmentation is important and has widespread applications in computer vision, computer graphics and medical imaging.
In this paper we apply optimization based colorization technique on medical images to obtain satisfactory colorized medical images in very short time and with small amount of work. Optimization is used for finding the minimum of dissimilarity measure or the maximum of similarity measure. The paper is organized as follows: In section I the basics of colorization using optimization is discussed. Section II discusses about the method of applying colorization algorithm on medical images. The performance criteria used to measure the effectiveness of colorization on medical images is also discussed. In Section III results and analysis are discussed. Section IV concludes the paper.
II. OPTIMIZATION COLORIZATION TECHNIQUE
ISSN 2250-3153
the region, instead of tracing out its precise boundary as shown in Fig 1 (b). Using these user supplied constraints, the optimization based technique [11] automatically propagates colors to the remaining pixels in the image sequence. Levin et al. solved an optimization problem that minimizes a quadratic cost function of the difference of color between a pixel and it’s weighted average neighborhood
colors [11].
Since, the color is provided simply by marking the scribbles on the operated image, remember that both mark image and operated image have same size. Then swatching based colorization is applied on the mark image. In this optimizaton technique, chrominance value of each pixel’s nearest pixels is checked. If the chrominance value of pixels is same then the color applied on mark image is spreaded through the nearest pixels untill the pixels value matches and then it create the fuzzy color boundary. The algorithm is given as input an intensity volume Y(x; y; t) and outputs two color volumes U(x; y; t) and V(x; y; t). Thus, Y(r) is the intensity of a particular pixel and we wish to minimize the difference between the color U(r) at pixel r and the weighted average of the colors at neighboring pixels. These two terms together form the cost function (energy) associated with the registration and the aim of the optimization method is to minimize it. In literature such methods can be referred to as energy minimization method. To minimize cost functions J(U) & J(V) as shown in equations (1) & (2), the weighting functions as shown in equation (3) are used.
J
(
U
)
(
U
(
r
)
W
rsU
(
s
))
2r sN (s) (1)
J
(
V
)
(
V
(
r
)
W
rsV
(
s
))
2r sN (s) (2)
Wrs is a weighting function that sums to one, large when Y(r) is similar to Y(s), and small when the twointensities are different. Similar weighting functions are used extensively in image segmentation algorithms (e.g. [Shi and Malik 1997; Weiss 1999]), where they are usually referred to as affinity functions. We have experimented with the following simplest weighting function given in equation (3), which is commonly used by image segmentation algorithms and is based on the squared difference between the two intensities:
(3)
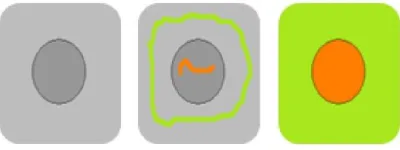
In YUV color space, where Y is t he monochromatic luminance channel, which refers to simply as intensity, while U and V are the chrominance channels, encoding the color. Here, r, s are neighboring pixel according to U and V plane. And r is variance for pixel around r. Here, Figure 1(a) shows gray image and figure 1(b) shows scribble image and 1(c)
shows color image
Figure 1(a) Gray Image, (b) Scribbled Image, (c) Colorized Image
III. PROPOSED METHODOLOGY
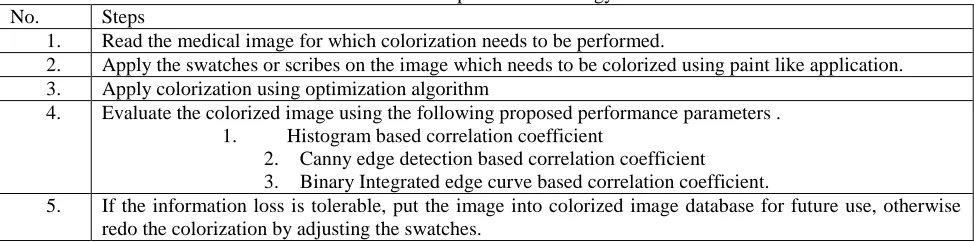
[image:2.612.200.400.542.617.2]Table 1: Proposed methodology No. Steps
1. Read the medical image for which colorization needs to be performed.
2. Apply the swatches or scribes on the image which needs to be colorized using paint like application. 3. Apply colorization using optimization algorithm
4. Evaluate the colorized image using the following proposed performance parameters . 1. Histogram based correlation coefficient
2. Canny edge detection based correlation coefficient 3. Binary Integrated edge curve based correlation coefficient.
5. If the information loss is tolerable, put the image into colorized image database for future use, otherwise redo the colorization by adjusting the swatches.
To evaluate the performance of colorization algorithm in terms of information loss, we find the following three correlation parameters from original and gray converted image of colorized image.
1. Histogram correlation coefficient given by
Where, HI is histogram of the original operated image I and Hc is the histogram of the gray converted image of
colorized image.
2. Canny edge detection based correlation coefficient given by
Where, CI is Canny edge detected image of original image I and Cc is the Canny edge detected image of the gray
converted image of colorized image.
3. Binary integrated edge curve based correlation coefficient given by
Where, BI is binary integrated edge curve [12] of Canny edge detected image of original image I and Bc is the binary
integrated edge curve of Canny edge detected image of the gray converted image of colorized image. After applying Canny edge algorithm, we plot the binary integrated edge intensity curve. This binary integrated edge intensity curves requires some smoothing. Moving average filter with best suitable window size is used for smoothing.
The maximum positive correlation is 1.00. If the coefficient is, say, .80 or .90, we know that the corresponding variables closely vary together in the same direction; if it is -.80 or -.90, they vary together in opposite directions. If it is zero or near zero correlation means simply that two things vary separately.
IV. RESULTS AND ANALYSIS
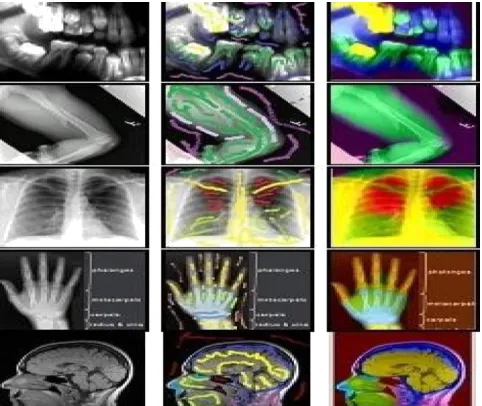
The proposed method works fast enough to allow the user for interactive work without noticeable delays and achieving real-time preview. The proposed method gives good colorization results for gray scale medical images of different type. In Fig. 2 we can observe the colorization results of dental, leg, chest, hand, MRI images. In columns from the left to right, the original gray scale images, the ones scribbled with color and resultant images after colorization are shown.
The important feature of the proposed technique is that the intensity of the original gray scale image is always preserved and the color information provided by a user can be hidden, so that no changes in the original image are introduced. In this way the color information can be used as a tool enabling the physician to point at important structures by coloring the region of interest.
We work on forty images of different areas of medical images and apply the proposed methodology. The performance parameters are computed and are listed in Table 2. We get the average (median) CH of 0.4218 (0.4235),
average (median) CB of 0.76 (0.79) and average (median) CCA of 0.696 (0.697). Out of forty images, we obtain 24
images having more than 0.75 correlation coefficient (CB). Figure 3 shows the images used to find the performance
ISSN 2250-3153
Figure 2: Colorization results. In columns from the left: gray scale images, scribbled images and the colorization result.
[image:4.612.73.535.360.550.2]In Fig.3 we applied the proposed technology take an MRI operated image, scribbled with color and resultant images after colorization. To check the information loss we again converted this colored image into grayscale image and then we find the histogram correlation factor, canny edge correlation factor and binary edge correlation factor. By this correlation factors we find that whether this colored image is use in medical or not.
Figure 3: Result of the sagittal MRI image
Table 2: Images and their correlation factor between histogram, Canny edge curve and binary edge curve.
Sr No
Area of Medical
Image Image
CH (Correlation
factor of Histogram)
CB(Correlation factor
of Binary Edge Curve)
CCA(Correlation
factor of Canny Edge)
1.
Hand X-Ray Images
1 0.9606 0.7418 0.8500
2. 2 0.0598 0.7963 0.6352
3. 3 0.2661 0.9550 0.8553
4.
MRI Images
1 -0.0048 0.8149 0.8212
5. 2 -0.0101 0.9168 0.7978
6. 3 0.9192 0.6906 0.6047
7. 4 0.0096 0.6935 0.7989
8. 5 0.0570 0.9711 0.8004
9.
Chest X-Ray Images
1 0.1542 0.9244 0.7037
10. 2 -6.8646e-004 0.6557 0.7482
11. 3 0.6498 0.9754 0.8404
[image:4.612.71.544.577.738.2]13. 2 0.7412 0.8524 0.8321
14. 3 0.0012 0.9796 0.6588
15.
Leg X-Ray Images
4 0.7642 0.9193 0.7953
16. 5 0.0286 0.5433 0.5810
17. 6 0.0167 0.7818 0.7515
18. 7 0.8976 0.8623 0.8876
19. 8 0.9081 0.7852 0.7801
20.
Dental X-Ray Images
1 0.5177 0.4455 0.4973
21. 2 0.5657 0.4679 0.6477
22. 3 0.1859 0.7841 0.6333
23. 4 0.6488 0.4648 0.6155
24. 5 0.9365 0.4768 0.5867
25. 6 0.5962 0.7130 0.5826
26. 7 0.6434 0.8684 0.6144
27. 8 0.4463 0.9164 0.6750
28. 9 0.9912 0.7737 0.8668
29. 10 0.5612 0.9151 0.4772
30. 11 0.7864 0.7059 0.6910
31. 12 0.0637 0.7219 0.5227
32. 13 0.2455 0.7095 0.6685
33. 14 0.8243 0.8421 0.7139
34. 15 -0.0038 0.8875 0.4713
35. 16 0.3084 0.6550 0.5766
36. 17 0.4323 0.7615 0.4717
37. 18 0.0996 0.8144 0.8203
38. 19 0.3344 0.8619 0.6432
39. 20 0.4148 0.7606 0.7179
40. 21 0.7866 0.6455 0.8235
Average 0.421823 0.76657 0.696083
Median 0.42355 0.78295 0.69735
V. CONCLUSION
Due to colorization the visual appeal of images is increased. In medical field there are plenty of images in different areas like MRI, radiographic images, ultrasound images. Here we colorized the medical images using optimization technique. The results of experiments performed on various grayscale medical images indicate that the presented approach yields interesting results and can be successfully used for visualization purposes without loss of information. Due to colorization technique does not introduce any changes in the intensity of the original image the user can always use the original image without the chromaticity component. The colorized results can be used for various diagnostic purposes serving as a versatile visualization tool.
REFERENCES
[1] Vivek George Jacob and Sumana Gupta, “Colorization of Grayscale and Videos using a Semiautomatic Approach”, IEEE International Conference on Image Processing (ICIP) Nov, 2009.
[2] A. Hertzmann, C. Jacobs, N. Oliver, B. Curless, D. Salesin, “Image Analogies”, SIGGRATH 2001, Conference Proceedings.
[3] Ritwik Kumar, Suman K. Mitra, “Motion Estimation based Color Transfer and its Application to Color Video Compression”, Pattern Analysis and application, Vol 11.
[4] Jian Guan and Guoping Qiu, “Interactive Image Segmentation using Optimization with Statistical Priors”, International Workshop on The Representation and Use of Prior Knowledge in Vision (In conjunction with ECCV 2006).
[5] Guillaume Charpiat, Matthias Hofmann and Bernhard Schölkopf, “Automatic Image Colorization via Multimodal Predictions”, European Conference on Computer Vision ECCV 2008.
[6] T. Horiuchi, “Colorization algorithm for gray-level image by probabilistic relxation”, Proceedings of IEEE International Conference on Pattern Recognition, pp. 867-870, August 2003.
[7] Liron Yatziv and Guillermo Sapiro, “Fast Image and Video Colorization Using Chrominance Blending”, IEEE transactions on image processing, vol. 15, No. 5, May 2006.
[8] Knapp D, Kerr JP, Sellberg M, “Patient Specific Color Texture Mapping Of CT-Based Anatomical Surface Models Utilizing Cryosection Data”, Engineering Animation, Inc., Ames, IA 50010, USA. http://www.eai.com. Studies in health technology and informatics. 1997; 39:608-17
[9] Przemyslaw Lagodzinski and Bogdan Smolka, “Colorization of Medical Images”, Proceedings of 2009 APSIPA Annual Summit and Conference, Sapporo, Japan, October 4-7, 2009.
[10] Kevin J. Parker and Man Zhang, “Color in Medical Imaging”, Journal of Imaging Science and technology, Vol. 50, 12 (2006). [11] Anat Levin Dani Lischinski Yair, “Colorization using Optimization”, ACM SIGGRATH Conference, pp. 689-694, 2004.
AUTHORS
First Author – Ami A. Shah, Faculty of ADIT, Gujarat Technical University, Anand (Gujarat), Email id - [email protected] Second Author – Mikita Gandhi, Faculty of ADIT, Gujarat Technical University, Anand (Gujarat),
Email id - [email protected]
Third Author – Kalpesh M Shah, Faculty of ADIT, Gujarat Technical University, Anand (Gujarat), Email id - [email protected]