http://dx.doi.org/10.4236/eng.2015.76029
Application Study on Rigidity Correlation
Method for Density Inversion of Rockfill
Pan Liu, Mingjie Zhao, Bowen Jiang, Kui Wang, Peng Jin
School of River and Ocean Engineering, Chongqing Jiaotong University, Chongqing, China Email: [email protected]
Received 27 May 2015; accepted 20 June 2015; published 23 June 2015
Copyright © 2015 by authors and Scientific Research Publishing Inc.
This work is licensed under the Creative Commons Attribution International License (CC BY). http://creativecommons.org/licenses/by/4.0/
Abstract
Based on the theoretical model of rigidity correlation method, the study on application was car-ried out with Chinese Liyuan face rockfill dam as example. The linear relation equations between the rockfill rigidity and density measured by pit method were established, and the regression performance and accuracy of rigidity correlation method were analyzed by calculating the inver-sion values of density. The results show that the regresinver-sion equations of rigidity correlation thod are high significant so as to work out the rockfill density precisely; rigidity correlation me-thod is used for density inversion of rockfill with minor error and namely high accuracy, which is proper with satisfactory results.
Keywords
Rigidity Correlation Method, Rockfill, Density Inversion, Regression Performance, Accuracy
1. Introduction
As a rapid and high efficient in-situ test technology in density measurement of rockfill, in recent years, the addi-tive mass method has been used in various hydraulic engineerings in China, such as Xiaolangdi core rockfill dam, Shuibuya concrete face rockfill dam, Nuozhadu core rockfill dam and so on [1]-[3]. With the continuous development and improvement, some inversion methods for rockfill density, including analytic method, correla-tion method and attenuacorrela-tion coefficient method, are put forward based on additive mass method [4]. But both analytic method and attenuation coefficient method have limitations in engineering applications due to the poor measuring accuracy of wave velocity and complex determining process of attenuation coefficient.
the method where the rockfill rigidity is taken as correlation parameter has a preliminarily exploration based on the application with great results in Chinese Yanshan reservoir dam [5]. To get the further study for reliability, based on rigidity correlation method, with the calculation using the rockfill rigidity measured by additive mass method, the regression performance and accuracy of inversion model are analyzed and so is the applicability, which are proposed to give some suggestions for the further studies on the method in this paper.
2. Theory and Model of Rigidity Correlation Method
2.1. Determination of Rigidity
As the most important parameter in the rigidity correlation method, the rockfill rigidity could be determined by additive mass method that simplify the vibrating rockfill into a single free linear spring system under the vibrat-ing force by placvibrat-ing a series of additive masses on the rockfill. Based on the model, the vibration equations could be obtained as follows [1]:
0
mA KZ+ = (1)
0
m=m + ∆m (2)
(
)
2 0
K=
ω
m + ∆m (3)where m = total vibrating mass; A = vibration acceleration of system; m0 = rockfill mass; Δm = additive mass; K = system rigidity; Z = vibration displacement of system; ω = vibration circular frequency of system.
Therefore, it could be draw a line between ω−2 and Δm that is measured by experiments, and the inverse slope of line is the rockfill rigidity.
2.2. Correlation Model
According to the static rigidity equation and dynamic rigidity equation based on semi-infinite elastic foundation model, the analytic equation to density of circular foundation could be derived as follows [5]:
2
1 4 s
K rV
µ
ρ= − (4)
where ρ = density of medium; μ = Poisson’s ratio of medium; r = foundation radius; Vs = shear wave velocity of
medium; K = foundation rigidity
From the Equation (4), we can see that the change of wave velocity would lead to the change in coefficient of rigidity, so as to a poor linear correlation between density and rigidity strictly. Due to the small rangeability of rockfill density, we could consider the correlation curve as a straight line in a small portion simply, where there is a linear correlation. In this case, dividing K by 4r, one-parameter correlation equation between density and normalized rigidity could be obtained as follows:
1 1
2 2
1 1 4
s s
K
K K
r
V V
µ µ
ρ= − = − =α (5)
2.3. Model Analysis
The rigidity correlation method for density inversion of rockfill is a direct correlation method whose model is established between rigidity and density, and studies have shown that there is a high correlation between rigidity and density of rockfill. Therefore, based on the model of rigidity correlation method, through taking the rigidity and density as samples, the correlation could be obtained accordingly under the condition of getting the accurate and representative data of samples.
and density is accurate, it is necessary to do the research on applicability of rigidity correlation method for den-sity inversion of rockfill.
3. Application Example
3.1. Correlation Parameters
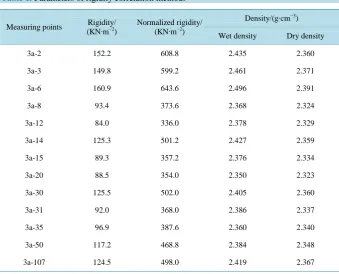
The 13 sets of data, which are measured by additive mass method and pit method in Chinese Liyuan face rock-fill dam whose rockrock-fill is continuously graded limestone with maximum diameter of 300 mm, are shown in Ta-ble 1 [6]. FromTable 1, it can be observed that the normalized rigidity values of various measuring points are distributed between 336.0 KN∙m−2 and 643.6 KN∙m−2, the wet density values are distributed between 2.350 g∙cm−3 and 2.496 g∙cm−3, and the dry density values are distributed between 2.323 g∙cm−3 and 2.391 g∙cm−3.
3.2. Regression Analysis
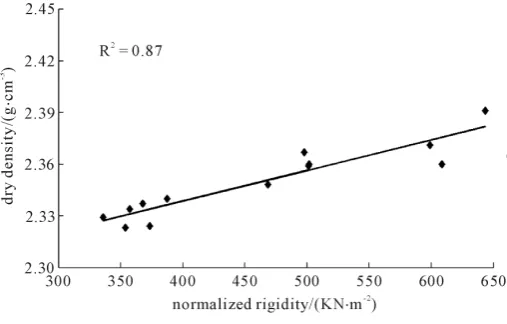
The results of linear regression between normalized rigidity and density which are inTable 1 are shown in Fig-ure 1 andFigure 2.
Figure 1andFigure 2 show that there is a linear correlation roughly between normalized rigidity and density of rockfill due to the zonal distribution of points. The determination coefficient between normalized rigidity and wet density is 0.85 while that is 0.87 between normalized rigidity and dry density, and accordingly there are lots of points which can explain the deviation of density with the change of rigidity. As such, it is proved that regres-sion line has a good fitting degree so as to take a good result. The equation between normalized rigidity and wet density is shown in Equation (6) and between normalized rigidity and dry density is shown in Equation (7).
0.0004 2.2349 w
K r
ρ = + (6)
0.0002 2.2674 d
K r
ρ = + (7)
[image:3.595.143.483.447.721.2]where ρW = wet density of rockfill; ρd = dry density of rockfill; K = rockfill rigidity; r = foundation radius.
Table 1. Parameters of rigidity correlation method.
Measuring points (KN∙mRigidity/ −2) Normalized rigidity/ (KN∙m−2)
Density/(g∙cm−3)
Wet density Dry density
3a-2 152.2 608.8 2.435 2.360
3a-3 149.8 599.2 2.461 2.371
3a-6 160.9 643.6 2.496 2.391
3a-8 93.4 373.6 2.368 2.324
3a-12 84.0 336.0 2.378 2.329
3a-14 125.3 501.2 2.427 2.359
3a-15 89.3 357.2 2.376 2.334
3a-20 88.5 354.0 2.350 2.323
3a-30 125.5 502.0 2.405 2.360
3a-31 92.0 368.0 2.386 2.337
3a-35 96.9 387.6 2.360 2.340
3a-50 117.2 468.8 2.384 2.348
Figure 1. Regression between normalized rigidity and wet density.
Figure 2. Regression between normalized rigidity and dry density.
3.3. Significance Test of Regression Equation
In order to judge whether the regression equations above are meaningful or not, in other words, whether the density fluctuation is caused by the change of the parameters, the significance test of regression equations are carried out with F examination method based on the regression analysis theory [7]. According to F examination method, if the F value of equation is more than critical value, the equation is significant, but not vice versa. The F value could be solved by Equation (8).
(
) (
)
2(
)
21 1
2
n n
i a i i
i i
F n Y y y Y
= =
= −
∑
−∑
− (8)where n = samples; Yi = regression values; ya = sample mean; yi = sample values.
With calculation, the test results of regression equations are shown inTable 2.
The critical value of parameter samples is 4.60 when confidence level given is 0.05. TheTable 1 shows that the F value of regression equations to calculate wet density and dry density is more than the critical values, and consequently the regression effect of the equations are highly significant when the significance level is 0.05. Therefore, the two regression equations are appropriate in density inversion of rockfill absolutely.
3.4. Density Inversion
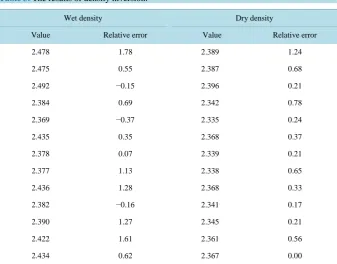
After pluging the normalized rigidity into the Equation (6) and Equation (7) respectively, we calculate to obtain the inversion values of wet density and dry density which are shown inTable 2.
FromTable 3, compared with the density measured by pit method, the maximum relative error of wet density
[image:4.595.187.441.268.430.2]Table 2. Test results of regression equations.
Correlation F value Critical value Significance
ρw and K1 62.23
4.60
Significant
[image:5.595.145.483.172.436.2]ρd and K1 71.02 Significant
Table 3. The results of density inversion.
Wet density Dry density
Value Relative error Value Relative error
2.478 1.78 2.389 1.24
2.475 0.55 2.387 0.68
2.492 −0.15 2.396 0.21
2.384 0.69 2.342 0.78
2.369 −0.37 2.335 0.24
2.435 0.35 2.368 0.37
2.378 0.07 2.339 0.21
2.377 1.13 2.338 0.65
2.436 1.28 2.368 0.33
2.382 −0.16 2.341 0.17
2.390 1.27 2.345 0.21
2.422 1.61 2.361 0.56
2.434 0.62 2.367 0.00
error of dry density is 1.24% and minimum one is 0.00%. So the result shows that because the errors of wet den-sity and dry denden-sity are within 2%, the inversion results of rigidity correlation method are in good agreement with that of pit method, and this method could be reliably used to in practical engineering.
4. Accuracy Analysis
The inversion accuracy of rigidity correlation method is mainly determined by the standard deviation (σ) of re-gression equation and the mean relative error (δ) of density inversion, which could be calculated by Equation (9) and Equation (10) according to regression theory.
(
) (
2)
1
2
n
i i
i
y Y n
σ
=
=
∑
− − (9)2
δ = σ ρ (10)
The results of accuracy calculation are shown inTable 4.
Table 4shows that the σ values of wet density and dry density of 13 points are 0.017 and 0.008. If the stan-dard deviation were equal to 2σ, it is known that the values of whole point would be in the range of ρ−2σ to
2
Table 4. The results of accuracy calculation.
Error item Wet density Dry density
Standard deviation 0.017 0.008
Mean relative error 0.014 0.007
5. Conclusions
Based on rigidity correlation method, this paper has calculated the rockfill density using the rockfill rigidity that is measured by additive mass method, and the regression performance and accuracy of rigidity correlation are analyzed further. Following conclusions could be drawn from the study above:
1) The rigidity correlation model is the direct correlation way to rockfill density. The overall effect of regres-sion equations that are established by this method is highly significant and the correlation coefficient of the equ-ations is high. The inversion calculation of rockfill density can be realized well by this correlation.
2) The rigidity correlation method has a high accuracy for the density inversion of rockfill. Using the method in the practice, the satisfactory results could be produced in inversion.
Acknowledgements
This project is supported by Fund Projects of Innovation in Postgraduate Education of Chongqing Jiaotong University (20140119).
References
[1] Li, P.W., Leng, Y.B. and Yuan, J.H. (1999) The Density Measurement of Rockfill Object by Additive Mass Method.
Chinese Journal of Geophysics, 42, 422-427.
[2] Song, X.H., Xiao, B.X., Gu, H.M., Zhang, X.Q., Deng, S.K. and Xu, S.F. (2004) Application of Method of Additive Mass to Density Measurement of Rock-Fill Object in Shuibuya Water Control Project. Coal Geology & Exploration, 32, 40-43.
[3] Cai, J.X. and Zhang, Z.J. (2008) Analysis and Evaluation on Application Effect of Density Measurement of Rock Fill Object by Additive Mass Method. Journal of Yangtze River Scientific Research Institute, 25, 186-190.
[4] Li, P.W. and Guo, X.S. (2009) In-Situ Test Technology in Density Measurement of Rockfill. Technical Supervision in Water Resources, 1, 39-41.
[5] Xue, Y.F., Cui, L. and Li, P.W. (2010) Density Measurement of Rockfill by Use of Rigidity Correlation Method. Chi-nese Journal of Geotechnical Engineering, 32, 987-990.
[6] Zhang, W.X. and Qian, Q.N. (2013) Application of Additive Mass Method to Compaction Testing of Liyuan Concrete Face Rock-Fill Dam. Water Resources and Hydropower Engineering, 44, 27-30.