111
©IJRASET (UGC Approved Journal): All Rights are ReservedA Study on Dynamic Response of Bridge Deck Slab
under Moving Loads
Mr.Powar A.R. 1, Mr. Khurd. V.G 2 1
P.G. Student, Department of Civil Engineering, Sanjay Ghodawat group of institutes, Atigre, Kolhapur, Maharashtra, India1 2
Assistant Professor, Department of Civil Engineering, Sanjay Ghodawat group of institutes, Atigre, Kolhapur, Maharashtra, India2
Abstract: Present study includes the modal and transient analysis of bridge deck slab subjected to moving load by using ANSYS software. The modal analysis results are compared with previous literature and close for solution. The parametric study is in form of deflection, stress and strain for variation of models dimension. The study reveals that Finite Element Method can be applicable and reliable tool for analysis of bridge deck slab.
Keywords: Bridge deck slab, Finite Element Method, Natural Frequency 3D-FE modelling, IRC loading
I. INTRODUCTION
Vibration of a bridge structure under the passage of vehicles is an important consideration in the design of bridges. The interaction between the vehicle and the bridge makes the dynamic response analysis very complex. To understand the phenomenon and to develop rational design procedures, a number of analytical and experimental investigations were carried out in the past by Jagmohan L. Humar. et. al [1]. The numerous analytical and experimental investigations have shown that the interaction between the vehicle and the bridge is a complex phenomenon governed by a large number of different parameters. The deformation of bridge subjected to vehicles with different velocities is very complicated, and some attention has been paid to it in engineering community. On the basis of typical theory on vibration analysis between bridge and vehicles, finite element model of bridge is established using ANSYS software. Through the numerical simulation analysis dynamic response characteristics of the bridge body are acquired when the vehicle passes over the bridge deck slab at different speeds and different load frequencies.
II. PROBLEMSTATEMENT
There is limited work has been done on finding dynamic response of bridge. Vibration due to moving loads on bridge causes larger effect on deck slab. It is difficult to identify effect of the significant parameters that governs the response. Due to vibrations change in stresses, strains and deflection occurs. Hence finding dynamic behaviour of deck slab is very important. In this research we are finding these stresses, strains and deflection when velocity, span, depth and load frequency changesThe modal analysis is carried out in software. The vehicle load of IRC Class A and IRC Class B traveling along the deck in a direction parallel to span. Damping in both the bridge and the vehicle is ignored. The vehicle is assumed to remain in contact with the deck. So that it will become helpful in future for analysis of deck slab. The design of bridges arise the dynamic response is very much significant in bridge to obtain vibration free and disturb free bridge structure.
[image:2.612.124.487.570.714.2]III.DECKSLABDETAILS
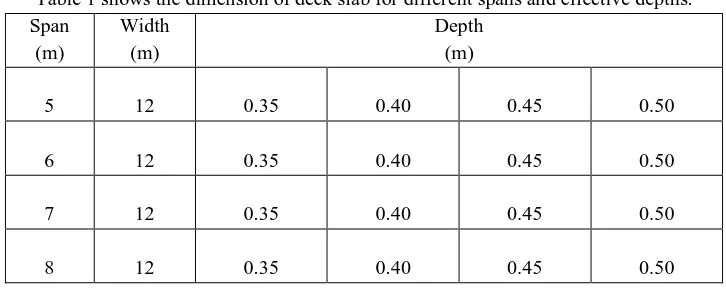
Table 1 shows the dimension of deck slab for different spans and effective depths. Span
(m)
Width (m)
Depth (m)
5 12 0.35 0.40 0.45 0.50
6 12 0.35 0.40 0.45 0.50
7 12 0.35 0.40 0.45 0.50
112
©IJRASET (UGC Approved Journal): All Rights are ReservedThe following IRC loading have been applied for the deck slab A. IRC Class A
B. IRC Class B
IV.3DFEMODELLINGINANSYS
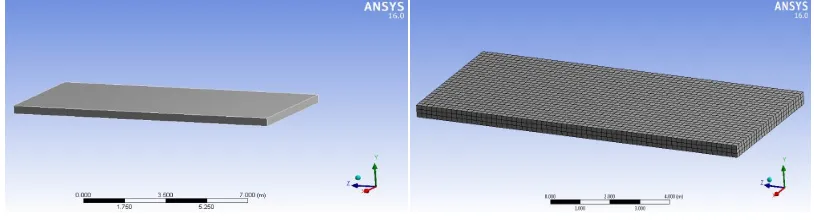
[image:3.612.103.510.210.320.2]Bridge Deck slab panels of size 12m X 5m, 12m X 6m, 12m X 7m, 12m X 8m with thickness 0.35m, 0.40m 0.45m and 0.50m are modeled in Ansys. Material properties of deck slab are Young’s Modulus = 25 x 10 MPa, Poisons ratio = 0.15, Density = 25 kN/ . The width of slab is 12 m where as span and depth varies as 5m, 6m, 7m, 8m and 0.35m, 0.40m, 0.45m, 0.50m resp. Meshing is developed to slab for accuracy of results, boundary conditions are one end of slab is fixed and other having pinned support.
Fig 4.1 Model of Deck Slab 12m X 5m X 0.40m Fig 4.2 Meshing of Model of size 12m X 5m X 0.40m
V. VALIDATIONOFBRIDGEDECKSLAB
A validation of 3D-FE modelling of bridge deck slab is done with previous literature paper for modal analysis. For validation purpose size of models are 12m X 5m, 12m X 7m of thickness 0.40 m are used. In Modal analysis for six numbers of modes natural frequencies are found out, first frequency is approximately matched with previous paper.
Following Table shows the validated natural frequencies of deck slab models. The natural frequencies are approximately same with natural frequencies of deck slab model studied in previous literature.
Size of model By Previous Literature By Study Variation 12m X 5m X 0.40m 7.26 Hz 7.1 Hz +0.16 Hz
12m X 5m X0.45m 8.4 Hz 8.9 Hz -0.5 Hz
12m X 6m X0.45m 22.3 Hz 23 Hz -0.7 Hz
12m X 7m X 0.45m 36.3 Hz 36.9 Hz -0.6 Hz
0 5 10 15 20 25 30 35 40
12m X 5m X 0.40m
12m X 5m X0.45m
12m X 6m X0.45m
12m X 7m X 0.45m
N
at
u
ral
F
re
q
u
e
n
cy
(
H
z)
Size of Deck Slab ( m)
By Previous Literature
113
©IJRASET (UGC Approved Journal): All Rights are ReservedAbove graph shows values of natural frequencies which are approximately equal with previous literature. ( Refer Table No. 2)
VI.MODALANALYSIS
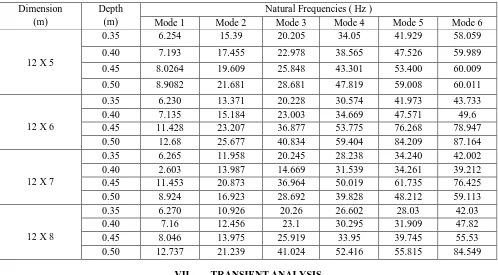
The modal analysis is carried out for different span lengths for varying depths. Table 3 shows natural
Frequencies of the deck slab. The result shows that as the depth increases natural frequencies are also increases.
Dimension (m)
Depth (m)
Natural Frequencies ( Hz )
Mode 1 Mode 2 Mode 3 Mode 4 Mode 5 Mode 6
12 X 5
0.35 6.254 15.39 20.205 34.05 41.929 58.059
0.40 7.193 17.455 22.978 38.565 47.526 59.989
0.45 8.0264 19.609 25.848 43.301 53.400 60.009
0.50 8.9082 21.681 28.681 47.819 59.008 60.011
12 X 6
0.35 6.230 13.371 20.228 30.574 41.973 43.733 0.40 7.135 15.184 23.003 34.669 47.571 49.6 0.45 11.428 23.207 36.877 53.775 76.268 78.947 0.50 12.68 25.677 40.834 59.404 84.209 87.164
12 X 7
0.35 6.265 11.958 20.245 28.238 34.240 42.002 0.40 2.603 13.987 14.669 31.539 34.261 39.212 0.45 11.453 20.873 36.964 50.019 61.735 76.425 0.50 8.924 16.923 28.692 39.828 48.212 59.113
12 X 8
0.35 6.270 10.926 20.26 26.602 28.03 42.03 0.40 7.16 12.456 23.1 30.295 31.909 47.82 0.45 8.046 13.975 25.919 33.95 39.745 55.53 0.50 12.737 21.239 41.024 52.416 55.815 84.549
VII. TRANSIENTANALYSIS
[image:4.612.58.556.165.440.2]The transient analysis is carried out for different span lengths for varying depths under moving loads. The loading is applied in form of IRC type loading. As load moves on slab deflection, stress and strain develops in it.
Fig 6.1, Model for transient analysis, size 12 X 5 X 0.40 Fig 6.2, Meshing of model, size 12 X 5 X 0.40
114
©IJRASET (UGC Approved Journal): All Rights are ReservedFig 6.5, Stress in slab of size 12 X 5 X 0.40 m, Fig.6.6, Strain in slab of size 12 X 5 X 0.40 m, IRC Class A loading IRC Class A loading
VIII. RESULT&DISCUSSION
Fig.7.1 Effect of Class A loading on Distribution of Deflection in deck slab
As depth increases changes occur in deck slab that is deflection is decreases. For span 5m, maximum deflection is 1.4252 mm when depth is 0.35m. For span 6 m, maximum deflection is 0.8833 mm when depth is 0.35m. For span 7m maximum deflection is 0.5252 mm when depth is 0.35m. For span 8m maximum deflection is 0.2098 mm when depth is 0.35m.
Fig.7.1 Effect of Class A loading on Distribution of Stress in deck slab
0 0.2 0.4 0.6 0.8 1 1.2 1.4 1.6
0.35 0.4 0.45 0.5
D
efl
ec
ti
o
n
(
m
m
)
Depth ( m )
12 X 5
12 X 6
12 X 7
12 X 8
0 0.5 1 1.5 2 2.5 3 3.5 4
0.35 0.4 0.45 0.5
St
re
ss
(
M
P
a
)
Depth ( m)
12 X 5
12 X 6
12 X 7
115
©IJRASET (UGC Approved Journal): All Rights are ReservedFor 5m width span maximum stress is 1.3776 MPa, for 6m width span stress is 2.2106 MPa, for 7m width span stress is 3.3707 MPa and for 8m width span stress is 3.5583 MPa for IRC Class A loading when depth is 0.35m. As depth increases stress decreases.
Fig.7.1 Effect of Class A loading on Distribution of Strain in deck slab
Maximum strain developed for 5m width deck slab span is 0.000073, for 6m width deck slab span 0.0000892, for 7m width deck slab span 0.00015, 8m width deck slab span 0.00014 for IRC Class A loading.
Fig.7.1 Effect of Class B loading on Distribution of Deflection in deck slab
For span 5m, maximum deflection is 0.5235 mm when depth is 0.35m. For span 6 m, maximum deflection is 0.7082 mm when depth is 0.35m. For span 7m maximum deflection is 1.6107 mm when depth is 0.35m. For span 8m maximum deflection is 2.3299 mm when depth is 0.35m for IRC Class B loading.
Fig.7.1 Effect of Class B loading on Distribution of Stress in deck slab
0 0.00002 0.00004 0.00006 0.00008 0.0001 0.00012 0.00014 0.00016
0.35 0.4 0.45 0.5
S
tr
a
in
Depth ( m)
12 X 5
12 X 6
12 X 7
12 X 8
0 0.5 1 1.5 2 2.5
0.35 0.4 0.45 0.5
D ef le ct ion ( m m )
Depth ( m )
12 X 5
12 X 6
12 X 7
12 X 8
0 0.5 1 1.5 2 2.5
0.35 0.4 0.45 0.5
S tr es s ( M P a )
Depth ( m )
12 X 5
12 X 6
12 X 7
116
©IJRASET (UGC Approved Journal): All Rights are ReservedFor 5m width span maximum stress is 1.3955 MPa, for 6m width span stress is 1.4534 MPa, for 7m width span stress is 2.1424 MPa and for 8m width span stress is 2.1461 MPa for IRC Class A loading when depth is 0.35m. As depth increases stress decreases.
Fig.7.1 Effect of Class B loading on Distribution of Strain in deck slab
Maximum strain developed for 5m width deck slab span is 0.000056, for 6m width deck slab span 0.0000588, for 7m width deck slab span 0.000087, 8m width deck slab span 0.000086 for IRC Class A loading.
IX.CONCLUSION
The dynamic response of a bridge deck slab to moving vehicles was studied.. The dynamic response was measured in terms of the normalized deflection, stress and strain. Following conclusions were drawn on the basis of results obtained from this study of simplified models of the bridge and the vehicle.
A. Results of modal analysis obtained from 3D-FE analysis by using ANSYS are very close to previous literature. ANSYS software can be used for finding natural frequencies for deck slab analysis.
B. The modal analysis result shows that, as the depth increases, the natural frequencies are also increases. C. The transient analysis results shows that deflection, stress and strain decreases as depth increase . D. As span increases deflection, stress and strain decreases.
REFERENCES
[1] Humar Jagmohan L. and. Kashif Ahmed H “dynamic response analysis of slab-type bridges”, Journal of structural engineering, 1995.121:48
[2] Broquet Claude, Bailey Simon F., Mario Fafard, and Bru Eugen “Dynamic Behavior of Deck Slabs of Concrete Road Bridges”, journal of bridge engineering, 2004-9
[3] Ayad Thabit Saeed Al-Ghabsha, Dr. Mohamad Najim “dynamic analysis of bridges subjected to moving vehicles”, Al-Rafidain Engineering Vol.14 No.4 2006 [4] Ji Jing , Zhang Wenfu , Zhao Wenyan, Yuan , Chaoqing Yang, “Analysis and Comparison on Dynamic Characteristics of the Bridge Subjected to Moving
Load Based on ANSYS ” Journal of Convergence Information Technology(JCIT) Volume7, 2012
[5] Bhkari Norshariza Mohamad, Rahman Azlan Abd , Baderul Hisham Ahmad,“Modal Analysis of Concrete Bridge Decks Subjected to Free Vibration, [6] Inbanathan Mahil J. and Wieland Martin “bridge vibrations due to vehicle moving over rough surface”, Journal of Structural Eng. 1987.113:1994-2008 [7] Shwetha Siddesh “vibration response of deck slab”, Proceedings of Twelveth IRF International Conference, 31st August 2014, Chennai, India, ISBN:
978-93-84209-48-3
[8] N. Munirudrappa and H. N. Dhruvaraja Iyenger “Dynamic Analysis of Continuous Span Highway Bridge ISET Journal of Earthquake Technology, paper no. 392, vol. 36, 1999
[9] Lai-Jun Liu, He-Xu Liu , Zi-Xue Lei “Simulation Analysis of Bridge’s Dynamic Response Under Vehicular Load” , [10] International Conference on Future Computer Science and Education, EEE DOI 10.1109/ICFCSE.2011.15
[11] Standard specifications and code of practice for road bridges, IRC : 5-1998, IRC : 6-2000,IRC : 18-1985, IRC : 21-200 Ottawa, Canada, 20(2), 287-298 [12] Andre R. Barbosa, Tim Link, David Trejo, “Seismic Performance of High-Strength Steel RC Bridge Columns.” Journal of bridge eng., ASCE.
0 0.00002 0.00004 0.00006 0.00008 0.0001
0.35 0.4 0.45 0.5
S
tr
a
in
Depth ( m)
12 X 5
12 X 6
12 X 7