Higgs Physics at CMS
Miguel Vidal1,afor the CMS Collaboration
1Centre for Cosmology, Particle Physics and Phenomenology - CP3, Université catholique de Louvain,
Louvain-la-Neuve, Belgium
Abstract.Searches for the Higgs boson at CMS, based on the data collected in 2011 and 2012 at 7 and 8 TeV centre-of-mass energy, corresponding to integrated luminosities of 5 and 20 fb−1, are presented. The observed new boson is found to be consistent with the Standard Model Higgs boson in all investigated properties such as the spin and couplings to bosons and fermions. The measured mass of this new particle is 125.7±0.3 (stat.)± 0.3 (syst.) GeV.
1 Introduction
The Standard Model (SM) predicts the existence of a Higgs boson responsible for the spontaneous electroweak symmetry breaking [1, 2]. In July 2012, the ATLAS and CMS [3] Collaborations an-nounced the discovery of a new boson [4, 5] with a mass around 126 GeV. From this moment one the highest priorities of the CMS Collaboration was to establish the nature of this new partible by studying its properties, i.e. observe its decay modes, measure its mass and couplings, and probe its spin-parity, relying on the full dataset that amounts to 5.1 fb−1 at 7 TeV and 19.6 fb−1at 8 TeV centre-of-mass
energy.
The most sensitive channels at LHC for the search of the Higgs boson are described in section 2, other channels, including less sensitive searches, scan over different mass regions, and beyond the SM interpretations, are summarised in section 3 and finally a summary is given in section 4.
2 SM Higgs Searches at 125 GeV
The five most sensitive channels contributing to the discovery of the Higgs boson with mass of approx-imately 126 GeV are presented in this section along with the properties of the new particle, extracted from the combination of the relevant channels in each case.
2.1 H→ZZ→4l
The four lepton channel provides the cleanest possible experimental signature, a peak in the four lepton mass spectrum on top of a flat and small background. The boson is observed in the search for the standard model Higgs boson in the mass range 110 < mH < 1000 GeV in the H → ZZ
ae-mail: [email protected]
DOI: 10.1051/
C
Owned by the authors, published by EDP Sciences, 2014
/2 01
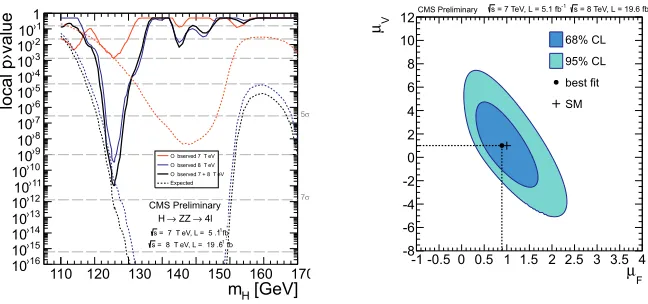
decay channel [6]. The search considers final states where both Z’s decay to electron, muon, or tau lepton pairs. The analysis uses pp collision data recorded by the CMS detector at the LHC, corresponding to integrated luminosities of 5.1 fb−1at √s=7 TeV and 19.6 fb−1at √s=8 TeV. It makes use of the measured four-lepton mass (figure 1), the mass uncertainty, kinematic discriminants, and information sensitive to the production mechanism, such as associated dijet characteristics and transverse momentum of the four-lepton system.
The analysis presented in this report relies critically on the reconstruction, identification, and iso-lation of leptons. The high lepton reconstruction efficiencies are achieved for a ZZ system composed of two pairs of same-flavour and opposite-charge isolated leptons, e+e−,μ+μ−, orτ+τ−, in the mea-surement range m4l,m2l2τ > 100 GeV. One or both of the Z bosons can be off-shell. The Z → 4l
resonance is used in the mass range 70 < m4l < 100 GeV to cross-check our mass measurement
method. The background sources include an irreducible four-lepton contribution from direct ZZ (or Zγ∗) production via q¯q annihilation and gg fusion. Reducible contributions arise from Zb¯b and t¯t where the final states contain two isolated leptons and two b jets producing secondary leptons. Ad-ditional background of instrumental nature arises from Z+jets, Z+γ+jets, and WZ+jets events where jets are misidentified as leptons.
The boson is observed in channels with electron and muon pairs with a local significance above the expected background of 6.7 standard deviations, as shown in figure 2, with the mass 125.8± 0.5(stat.) ±0.2(syst.) GeV. The signal strengthμ, relative to the expectation for the standard model Higgs boson, is measured to beμ =0.91+0.30
−0.24. The signal strength modifiers associated with vector
bosons and fermions in production are measured to beμV =1.0+2.4
−2.3andμF =0.9+−00..54(figure 2), thus
consistent with the standard model expectations. The spin-parity of the boson is studied and the pure scalar hypothesis is found to be consistent with the observation when compared to six other spin-parity hypotheses. The data disfavour the pure pseudoscalar hypothesis 0- with a CLs value of 0.16%, and disfavour the pure spin-2 hypothesis of a narrow resonance with the minimal couplings to the vector bosons with a CLs value of 1.5%. The spin-1 hypotheses are disfavoured with an even higher confidence. No other significant standard model Higgs-like excess is found in the search and upper limits at 95% confidence level exclude the range 130-827 GeV.
2.2 H→γγ
The H → γγdecay channel provides a clean final-state topology which allows the mass to be re-constructed with high precision. In the mass range 110 < mH < 150 GeV, H → γγis one of the
most promising channels for the Higgs search at the LHC despite its low branching fraction varying between 0.14% and 0.23%. The primary production mechanism of the Higgs boson at the LHC is gluon fusion with additional smaller contributions from vector boson fusion (VBF) and production in association with a W or Z boson, or with a t¯t pair.
The analysis searches for a localized excess of diphoton events over a smoothly falling background due to prompt diphoton production and to events with at least one jet misidentified as photon. To achieve the best sensitivity to a Standard Model Higgs boson decaying to two photons, the events are separated into classes. The search results are presented for an analysis that uses Multi-Variate-Analysis (MVA) techniques both for photon identification and event classification, and extracts the signal from the background using a fit to the diphoton mass spectrum (referred to in the following as “mass-fit-MVA”). An independent analysis is also presented in which the photon identification and the events classification is cut-based and in which the background model is derived as before from a fit to the diphoton mass spectrum (referred as “cut-based”) both showed in figure 3.
[GeV]
4l
m
Events / 3 GeV
0 10 20 30
100 200 400 800
Data = 126 GeV H m *, ZZ γ Z Z+X CMS preliminary -1
= 8 TeV: L = 19.6 fb s
-1
= 7 TeV: L = 5.1 fb s
Figure 1. Distribution of the four-lepton reconstructed mass in for the sum of the 4e,4μ, and 2e2μchannels. Points represent the data, shaded histograms represent the background and the unshaded histogram the signal expectation. The expected distributions are presented as stacked histograms. The measurements are presented for the sum of the data collected at √s=7 TeV and √s=8 TeV. No event is observed for m4l>800 GeV.
[GeV]
H
m
110 120 130 140 150 160 170
local p›value ›16 10 ›15 10 ›14 10 ›13 10 ›12 10 ›11 10 ›10 10 ›9 10 ›8 10 ›7 10 ›6 10 ›5 10 ›4 10 ›3 10 ›2 10 ›1 10 1 CMS Preliminary ›1 = 7 T eV, L = 5 .1 fb s
›1 = 8 T eV, L = 19 .6 fb s 4l → ZZ → H σ 5 σ 7 O bserved 7 T eV
O bserved 8 T eV O bserved 7 + 8 T eV Expected
F
μ
-1 -0.5 0 0.5 1 1.5 2 2.5 3 3.5 4
V μ -8 -6 -4 -2 0 2 4 6 8 10 12 68% CL 95% CL best fit SM
CMS Preliminary -1
= 8 TeV, L = 19.6 fb s
-1
= 7 TeV, L = 5.1 fb s
Figure 2.Significance of the local excess with respect to the standard model background expectation as a function of the Higgs boson mass for the 7 TeV (red), 8 TeV (blue) and 7 TeV+8 TeV (black) data sample. The results are shown for the full data sample in the range [110-180] GeV for the sum of the 4e,4μ, and 2e2μchannels (left). Likelihood contours on the signal strength modifiers associated with fermions (μF) and vector bosons (μV) shown at 68% and 95% CL. (right)
a standard model Higgs boson. The best-fit signal strength,σ/σS M, is 0.78±0.27 at mH=125 GeV,
mH=124.5 GeV. All measurements are compatible among themselves and with a Higgs boson with
a mass of 125.4 GeV.
(GeV)
γ γ
m
110 120 130 140 150
S/(S+B) W
e
ighted Events / 1.5 GeV
0 1000 2000 3000 4000
5000 Data
S+B Fit Bkg Fit Component
σ
1
± σ
2
± (MVA) -1 = 8 TeV, L = 19.6 fb s
(MVA) -1 = 7 TeV, L = 5.1 fb s
CMS Preliminary
(GeV)
γ γ
m
110 120 130 140 150
S/(S+B) W
e
ighted Events / 1.5 GeV
0 1000 2000 3000 4000 5000
Data S+B Fit Bkg Fit Component
σ
1
± σ
2
± (CIC) -1 = 8 TeV, L = 19.6 fb s
(CIC) -1 = 7 TeV, L = 5.1 fb s
CMS Preliminary
Figure 3.The diphoton invariant mass distribution with each event weighted by the S/(S+B) value of its category, for the mass-fit-MVA (left) and cut-based (right) analyses on the 7 and 8 TeV data sets combined. The lines represent the fitted background and signal, and the coloured bands represent the±1 and±2 standard deviation uncertainties in the background estimate.
2.3 H→WW∗→2l2ν
This section describes the search for a Higgs boson decaying in a pair of W bosons in the CMS detector at √s = 7 and 8 TeV. Events are classified according the exclusive jet multiplicity: 0, 1. The events are further separated in same-flavor and different-flavor final states in each jet multiplicity. The main backgrounds (W+W−, top, Drell Yan, W+jets) are estimated with data-driven techniques. The uncertainty on the background normalization represents the largest source of systematics of the analysis, together with the theoretical uncertainties on the Higgs cross section.
A cut and count analysis is performed, optimized for each mass point in all jet multiplicity cat-egories. The same-flavor final states have limited sensitivity to the signal and introduce a large sys-tematic uncertainty due to the large fake missing ETbackground in events with high pile-up. A 2D
shape analysis of the di-leplon invariant and transverse masses for the different-flavor final state which increases the sensitivity to the standard model Higgs boson is performed and combined with the cut and count analysis in the same-flavor final state.
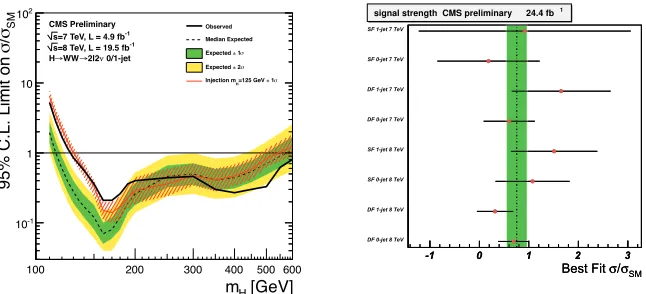
The search discussed here is performed over the mass range 110-600 GeV, and the data sample corresponds to 4.9 and 19.5 fb−1of integrated luminosity collected at center-of-mass energy of 7 and 8 TeV, respectively. An excess of events is observed above background which is consistent with the expectations from a standard model Higgs boson of mass 125 GeV, corresponding to an observed (expected) significance for mH =125 GeV in terms of standad deviations of 4.0 (5.1), and a best fit
value of the signal strength for mH=125 GeV of 0.76±0.21, as shown in figure 4.
No other excess of events is observed over the full accessible mass range. Additional standard model Higgs-like bosons are excluded in the mass range 128-600 GeV at 95% confidence level.
boson for quantum numbers and couplings against the spin-2 hypothesis of a narrow resonance pro-duced through the gluon fusion mechanism and with minimal couplings to theW+W−pair. Assuming the best fit value of the signal strength obtained for the individual hypothesis, the observed separa-tion is 0.5 and 1.3 standard deviasepara-tions away from the expected values for the standard model Higgs hypothesis and the spin-2 hypothesis, respectively.
[GeV] H m
SM
/
95% C.L. Limit on
-1 10
1 10 2 10
100 200 300 400 500 600
Observed
Median Expected
1 Expected
2 Expected
1 =125 GeV H Injection m
CMS Preliminary
-1
=7 TeV, L = 4.9 fb s
-1
=8 TeV, L = 19.5 fb s
0/1-jet
2l2
WW
H
SM σ
/
σ
Best Fit
-1 0 1 2 3
1
signal strength CMS preliminary 24.4 fb
SM σ
/
σ
Best Fit
-1 0 1 2 3
DF 0-jet 8 TeV DF 1-jet 8 TeV SF 0-jet 8 TeV SF 1-jet 8 TeV DF 0-jet 7 TeV DF 1-jet 7 TeV SF 0-jet 7 TeV SF 1-jet 7 TeV
Figure 4.Expected and observed 95% CL upper limits on the cross section times branching fraction, relative to the SM Higgs expectation, for the shape-based approach using the 7+8 TeV data. For the shape-based approach, we combine the analysis in the different-flavor final state in the 0-jet and 1-jet categories with the cut-based analysis in all other categories. The expected limits in the presence of the Higgs with mH =125 GeV and its
associated uncertainty are also shown (left). Best fit value of the signal strength (μ) for the shape-analysis for each channel.
2.4 VH(b¯b)
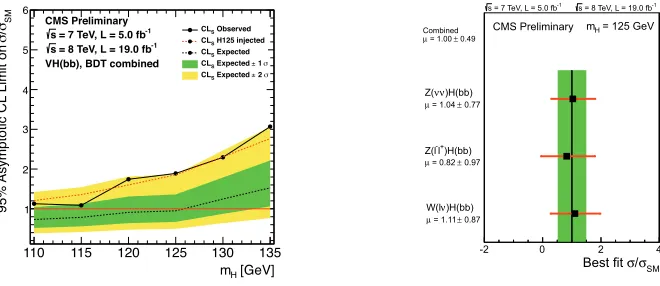
At a mass of 125 GeV the standard model Higgs boson decays predominantly into a bottom-antibottom quark pair (b¯b). The observation and study of the H→b¯b decay is therefore essential in determining the nature of the newly discovered boson. The measurement of H→b¯b will be the first direct test of whether the observed boson interacts as expected with the quark sector, as the coupling to the top quark has, so far, only been indirectly observed through loop-level interactions.
standard model Higgs boson. The signal strength corresponding to this excess, relative to that of the standard model Higgs boson, is 1.0±0.5, as shown in figure 5.
!
!"#$ %&'
("#$ )%&'
#*+$,-".
SM σ
/
σ
Best fit
-2 0 2 4
0.87
±
= 1.11
μ
)H(bb)
ν
W(l 0.97
±
= 0.82
μ
)H(bb)
+
l
-Z(l 0.77
±
= 1.04
μ
)H(bb)
ν ν
Z(
-1
= 7 TeV, L = 5.0 fb
s s = 8 TeV, L = 19.0 fb-1
0.49
±
= 1.00
μ
Combined CMS Preliminary mH = 125 GeV
Figure 5.Expected and observed 95% CL upper limits on the product of the VH production cross section times the Hbb branching ratio, with respect to the expectations for a standard model Higgs boson. The median expected limit and the 1- and 2-sigma bands are obtained with the LHC CLs method as implemented in RooStats, as are the observed limits at each mass point. The limits are combined for the 2011 7 TeV and the 2012 8 TeV data. The red dashed line represents the expected observed limits obtained from replacing the data with the sum of expected background and signal for a Higgs boson at a mass of 125 GeV (left). The most likely value of the production cross section for a 125 GeV Higgs boson, relative to the standard model cross section, for each channel and for all channels combined (right).
2.5 H→ττ
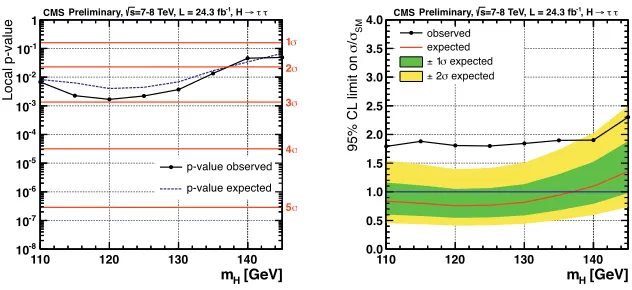
A search for the standard-model Higgs boson decaying to tau-lepton pairs is performed using events recorded by the CMS experiment at the LHC in 2011 and 2012 at a center-of-mass energy of 7 and 8 TeV respectively. The dataset corresponds to an integrated luminosity of 4.9 fb−1of data taken at 7 TeV center-of-mass energy and 19.4 fb−1at 8 TeV. The tau-lepton pair invariant-mass spectrum is studied in five different final states corresponding to the decay modes of the two tau leptons.
Five independentτ-pair final states are studied: μτh,eτh, eμ,τhτh, andμμ, whereτh denotes a
reconstructed hadronicτdecay. In each channel, the signal is separated from the background, and in particular from the irreducible Z → ττ, using theτ-pair mass mττ reconstructed from the four-momenta of the visible decay products of the twoτleptons and from the missing transverse energy.
We observe an excess of events over a broad mH range, with a maximum local significance of 2.94 sigma at mH=120 GeV, compatible with the presence of a standard-model Higgs boson with a
mass around 125 GeV.
!"
!(
Figure 6. Observed and expected p-value 1-CLb, and the corresponding significance in number of standard deviations. These results include the search for a SM Higgs boson decaying into a tau pair and produced in association with a W or Z boson decaying leptonically (left). Combined observed 95% CL upper limit on the signal strength parameterμ =σ/σSM, together with the expected limit obtained in the background hypothesis.
These results include the search for a SM Higgs boson decaying into a tau pair and produced in association with a W or Z boson decaying leptonically (right).
2.6 Properties
Measurements of the properties of the recently discovered boson with a mass near 125 GeV are presented [11]. The results are based on data samples corresponding to integrated luminosities of up to 5.1 fb−1at 7 TeV and up to 19.6 fb−1 at 8 TeV in proton proton collisions at the LHC. Five decay modes are studied: γγ,ZZ,WW, ττ, and b¯b. The mass of the new boson is measured to be 125.7±0.3(stat.)±0.3(syst.) GeV. The event yields obtained by the different analyses targeting specific decay modes and production mechanisms are consistent with those expected for the standard model Higgs boson. The best-fit signal strength for all channels combined, expressed in units of the SM Higgs boson cross section, is 0.80±0.14 at the measured mass, as shown in figure 7. The consistency of the couplings of the observed boson with those predicted for the SM Higgs boson is tested in various ways, and no significant deviations are found (figure 7).
3 Other Higgs Searches
SM σ
/
σ
Best fit
0 0.5 1 1.5 2 2.5
0.28
±
= 0.92
μ
→ ZZ H
0.20
±
= 0.68
μ
→ WW H 0.27 ± = 0.77 μ →γγ H 0.41 ± = 1.10 μ →ττ H 0.62 ± = 1.15 μ
→ bb H 0.14 ± = 0.80 μ Combined -1 19.6 fb ≤
= 8 TeV, L s
-1
5.1 fb
≤
= 7 TeV, L s
CMS Preliminary = 0.65 SM p
= 125.7 GeV H m
V
κ
0 0.5 1 1.5
f κ 0 0.5 1 1.5 2
5 C..
b b → H τ τ → H → H → H γ γ → H
CMS Preliminary s = 7 TeV, L ≤ 5.1 fb-1 s = 8 TeV, L ≤ 19.6 fb-1
SM Higgs Fermiophobic Bkg. only
Figure 7.Higgs boson signal strength measured in the most sensitive channels. The line and the band indicate the overall fittedμand its uncertainty (left). Confidence level contours of the scaling factors of the fermion couplings and the vector couplings of the Higgs boson. The contributions from the five different channels are also indicated (right).
3.1 ttHproduction
A search for the standard model Higgs boson produced in association with a top-quark pair in 19.5 fb−1 of 8 TeV pp collision data is reported [12]. The analysis is optimised for ttH events which are categorised into three channels based on the different final states: lepton
+ jets channel (t¯t→lνb¯bq¯q,H→b¯b), dilepton channel (t¯t→l+νl−νb¯b,H→b¯b) and τ channel (t¯t→lνb¯bq¯q,H→ττ). The major background to the signal is top-quark pair production with ad-ditional jets. Multivariate analysis (MVA) techniques are used to discriminate between background and signal events. A simultaneous fit for signal and background is performed using the MVA output distributions. Assuming SM Higgs boson branching fractions, a 95% C.L. upper limit on the ttH production cross section is presented.
A different search for ttH production, using for the first time the events where the Higgs boson decays to two photons, is also performed [13]. To maximize acceptance and sensitivity to such a small signal, we device two different sets of event selection criteria, optimized for leptonic and hadronic top-antitop decays. We analyze 19.6 fb−1 of 8 TeV pp collisions and find no significant excess over the background-only predictions. We thus proceed to set an observed (expected) 95% confidence level upper limit on the top-antitop-Higgs production cross section times BR(H→ γγ) of 5.4 (5.3) times the Standard Model value, corresponding to 1.6 fb, for a Higgs boson of mass mH=125 GeV.
In addition, the results from both analyses are combined since they are independent.
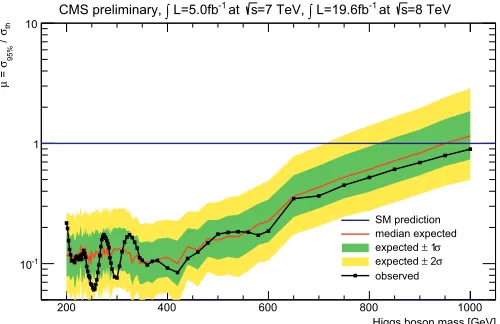
3.2 H→ZZhigh mass
Higgs boson mass [GeV]
200 400 600 800 1000
th
σ
/
95%
σ
=
μ
-1 10
1 10
=8 TeV s at -1 L=19.6fb
∫
=7 TeV, s at -1 L=5.0fb
∫
CMS preliminary,
SM prediction median expected
σ
1
±
expected
σ
2
±
expected observed
Figure 8. Observed (black line) and expected (red line) 95% CL upper limit on the ratio of the product of the production cross section and branching fraction to the SM expectation for the Higgs boson decaying into two Z bosons obtained using the asymptotic CLs technique. The 68% and 95% CL ranges of expectation for the background-only model are also shown with green and yellow bands, respectively. The horizontal solid line at unity indicates the SM expectation. Result is combination of all individual channels: H→ZZ→2l2l,
H→ZZ→2l2νand H→ZZ→2l2q.
3.3 Higgs to invisible
A direct search for a standard-model-like Higgs boson produced in association with a Z boson and decaying to invisible particles is reported [16]. A non-zero partial decay width to invisible particles could provide evidence for physics beyond the standard model. The search is performed in data samples corresponding to integrated luminosities of 5.1 fb−1at √s= 7 TeV and 19.6 fb−1 at √s= 8 TeV, recorded by the CMS experiment. No deviation from the background expectation is observed and limits are set on the branching fraction of the standard model Higgs boson decaying to invisible particles assuming the standard model production rate. For a Higgs boson with mH=125 GeV, the
observed (expected) 95% confidence level upper limit on the branching fraction of the Higgs boson to invisible particles is 75% (91%) .
4 Summary
References
[1] P. W. Higgs, Phys. Rev. Lett.13(1964) 508
[2] F. Englert and R. Brout, Phys. Rev. Lett.13(1964) 321. [3] CMS Collaboration, JINST3(2008) S08004
[4] ATLAS Collaboration, Phys. Lett. B716, (2012) 1-29 [5] CMS Collaboration, Phys. Lett. B716(2012) 30-61