Available Online at www.ijcsmc.com
International Journal of Computer Science and Mobile Computing
A Monthly Journal of Computer Science and Information Technology
ISSN 2320–088X
IMPACT FACTOR: 6.017
IJCSMC, Vol. 7, Issue. 2, February 2018, pg.9 – 22
Bridging the Semantic Gap in
Content Based Image Retrieval
Paul C. Kuo
, MD, MS, MBAUniversity of South Florida, Morsani College of Medicine
Dept. of Surgery
Running Title: CBIR and the Semantic Gap
Address all correspondence to:
Paul C. Kuo, MD
University of South Florida, Morsani College of Medicine
Dept. of Surgery
2 Tampa General Circle
Tampa, FL 33606
Phone: 813-250-2572
Fax: 813-259-0606
Abstract (223 words)
Image content on the Web is increasing exponentially. As a result, there is a need for image retrieval systems. Historically, there have been two methodologies, text-based and content-based. In the text-based approach, query systems retrieve images that have been manually annotated using key words. This approach can be problematic: it is labor-intensive and maybe biased according to the subjectivity of the observer. Content based image retrieval (CBIR) searches and retrieves digital images in large databases by analysis of derived-image features. CBIR systems typically use the characteristics of color, texture, shape and their combination for definition of features. Similarity measures that originated in the preceding text-based era are commonly used. However, CBIR struggles with bridging the semantic gap, defined as the division between high-level complexity of CBIR and human perception and the low-level implementation features and techniques. In this paper, CBIR is reviewed in a broad context. Newer approaches is feature generation and similarity measures are detailed with representative studies addressing their efficacy. Color-texture moments, columns-of-interest, harmony-symmetry-geometry, SIFT (Scale Invariant Feature Transform), and SURF (Speeded Up Robust Features) are presented as alternative feature generation modalities. Graph matching, Earth Mover’s Distance, and relevance feedback are discussed with the realm of similarity. We conclude that while CBIR is evolving and continues to slowly close the semantic gap, addressing the complexity of human perception remains a challenge.
Keywords: content based image retrieval, review, CBIR, feature extraction, similarity
Introduction
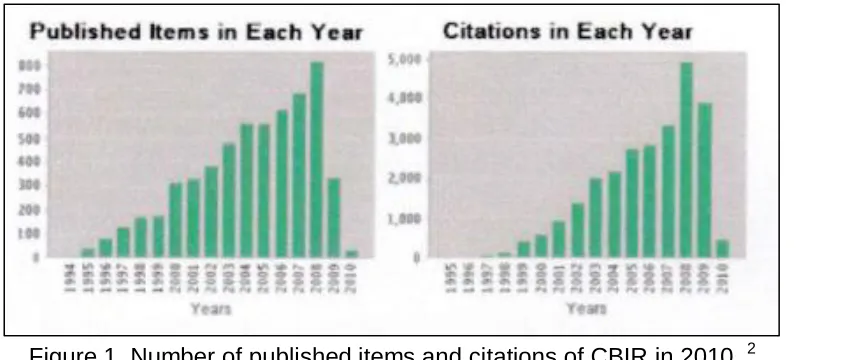
Figure 1. Number of published items and citations of CBIR in 2010. 2
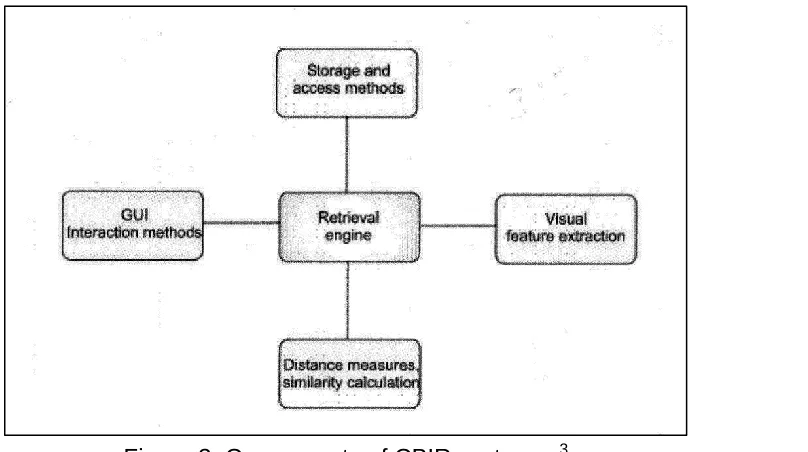
Academic papers addressing access methods and image databases first appeared in early 1980s. At the beginning, methodologies were primarily based upon text searches on annotated images. Early systems existed at the beginning of the 1980s, and some authorities suggest IBM’s Query By Image Content (QBIC) as the first CBIR system. Since then, other systems have originated in academia and developed for commercial use. For example, Virage has had several well-known commercial customers, such as CNN. Candid, Photobook and Netra use simple color and texture based methods. Use of higher level information techniques, such as image segmentation, was introduced by Blobworld. Pic Hunter is an image browser in which user feedback is used to maximize the information gain with each iteration. There also exists a free-of-charge GNU (GNU’s Not Unix!) image finding tool, GIFT. These systems share similar architecture for browsing and archiving images with capabilities for extraction of visual features, efficient retrieval, similarity measures and a graphical user interface.3
Figure 3. Components of CBIR systems. 3
Overview
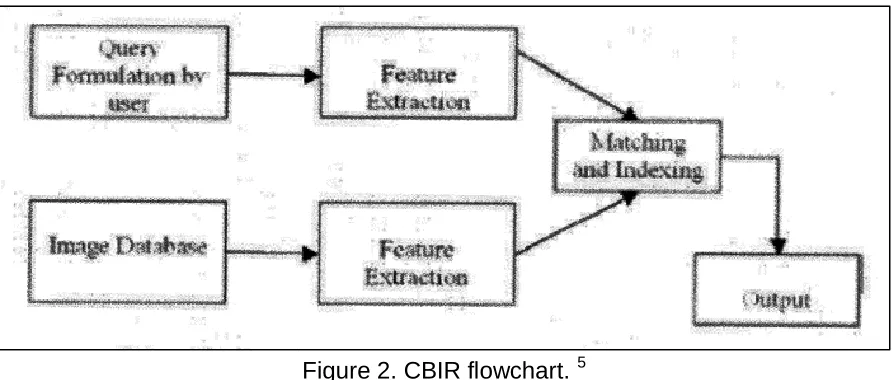
Figure 2. CBIR flowchart. 5
While seemingly simplistic and straight forward, CBIR falls short of its promise when addressing the issues of semantic gap and sensory gap. The semantic gap may be defined as the lack of coincidence between information extracted from a visual image as embodied in its feature space and the interpretation the same data may have for a human user. Parenthetically, according to Smeulders, et al, it is “the space of disappointment between the high-level intentions of CBIR and the low-level features that are used for analysis”.6,7 This perceptual subjectivity leads to difficulty in finding a single best representation of the query image. The term, “semantically similar”, therefore applies to the context of human visually perceived similarity. The gap in general purpose systems is estimated to range from 60-80% and exists between the high-level requirements of CBIR and human perception and the low-level implementation techniques.6 Image semantics may also be task dependent. Meaning may vary according to the underlying query motivation. Different classifiers may need to be developed for varying tasks on the same data set. 4 The sensory gap describes the difference between the image properties and the properties of the actual object. Both of these “gaps” may significantly limit the image retrieval capabilities of a CBIR algorithm. Addressing both the semantic and sensory gaps are areas of ongoing study in an effort to include the contributions of human perception, interpretation and meaning into CBIR algorithms.
Features
Thereafter, during the retrieval process, the end user selects the visual features and may also specify weights for the representations. Based on selected features and weights, the retrieval system will find similar images for the user’s query.
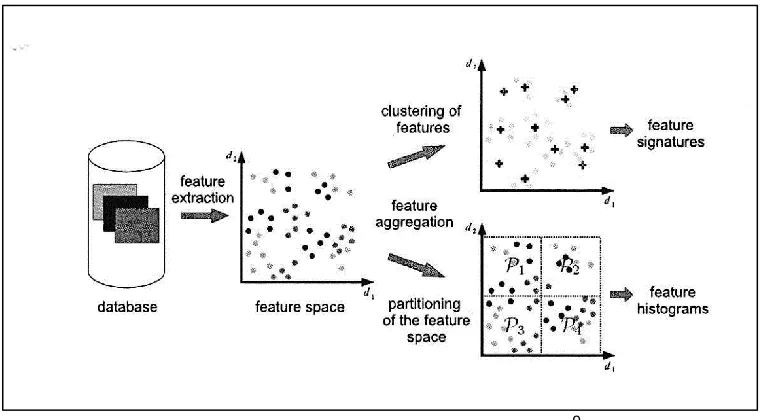
Figure 4. Feature extraction process.9
In CBIR, a primary challenge is express characteristics inherent to images as meaningful collections of features. Features are commonly represented as histograms and signatures. A histogram is derived from a fixed partitioning of the domain of the distribution. A single feature histogram is generated when each entry of the histogram corresponds to the number of its features located in the corresponding global partition and usually represent bins in a fixed partitioning of the region of the underlying space. Local clustering of features generates a signature, also called an adaptive binning histogram. Clusters of the objects’ features are included with the corresponding weights and centroids.9 Intuitively, a feature signature is then a set of centroids with a corresponding weight of the clusters. Each cluster is represented by a statistical measure such as mean and/or by the fraction of pixels within a spatial cluster. It is argued that each feature signature reflects the feature distribution more meaningfully than any feature histogram. Another critical pre-processing step is segmentation step that describes image content by focusing on regions of interest in an attempt to identify the core meaningful regions.4,10
components into a histogram or dividing the image into sub-blocks of which each is then attributed with the average color component vector in that block.4
Texture has also been used to separate and extract prominent regions of interest in an image and applies to the visual patterns that have properties of homogeneity independent of a single color or intensity.1 Commonly, standard analysis tools, such as wavelets, Gabor, or Stockwell filters, are used.10 Texture may also contain information about the structural orientation of surfaces and their relationship with the surroundings. Existing texture classification methods can be broadly divided into three categories: 1) statistical, 2) structural, and 3) model. Statistical methods depict texture as local measures, such as the six Tamura features, world features, grey level co-occurrence matrix or auto-correlation function. The Tamura features are coarseness, contrast, directionality, line-likeness, regularity, and roughness.12 World features are periodicity, randomness and directionality. In structural methods, texture is decomposed into many elements called texels that are arranged according to a pre-defined placement rule. Commonly used structural methods for texture classification are perimeter contribution and compactness, invariant histogram, topological texture descriptors, and morphological decomposition. Finally, in model-based techniques, texture is modeled as a probability model or as a linear combination of a set of basic functions. The coefficients of these models are used to characterize the texture images and may be transformed into different forms that are invariant to rotation, translation and scale.4,6
addition, shape can be often corrupted by noise, defects, arbitrary distortions and occlusion.8
Because these individual features are generally agreed to be low level in nature, investigators have proposed unique feature detection algorithms in an effort to bridge the semantic gap. Combinations of color, texture and shape have been examined. Yu et al suggest that the combination of color and texture may be useful as they represent distinctly different aspects of images.11 The authors note that some have suggested a set of covariance matrices between different color channels plus color histogram data to describe a color micro-texture. Others have proposed to combine the color and texture information together by defining hue and saturation as polar coordinates, which allow the direct use of HSV color space. However, none of these techniques are sufficiently powerful to represent image content for reasons that might also include a feature dimensionality that is too high or difficulty of algorithm implementation. The authors propose a “novel” feature termed color texture moments that integrates these properties into a compact form. There only 48 factors comprising dimensionality of this new feature. They test the new feature on an image library containing 10,000 Corel images with 200 queries and demonstrate that the precision of this feature to be better than other low level features such as color moments and color corelogram. But precision was only 30-35%. Nevertheless, the authors claim that their new feature achieves better performance than many existing low-level features. Again, the semantic gap remains rather large.
In a unique approach to bridging the semantic gap, Eidenberger and Breiteneder detail their semantic features (SFL) using the MPEG7 descriptor definition language (DDL).6 DDL is a schema language used to represent the results of modeling audio-visual data. Their feature is a combination of related feature classes based on lower levels while also including additional knowledge comprised of modeling information, domain knowledge, and statistical information. The authors identify three major properties of human objects: 1) geometry, 2) harmony, and 3) symmetry. They reason that humans create objects with the major properties of Euclidean geometry, straight lines and right angles. Humans are attracted to harmonic application of colors with matching and shades, harmonic textures, and the regular arrangement of objects and scenes. Finally, symmetry is the symmetric arrangement of objects that can be symmetric, mirrored or repetitive. Using a collection of 64 synthetic images, the recall and precision of SFL were 56% and 51%, respectively. These values are better than the combination of low level features previously described, but are certainly are not optimal.
into functionally similar boxels. To validate their VOI method in tumor detection, they constructed a feature index database of >300 unique VOIs from 13 dynamic PET scans of human brain studies. The authors indicate that similar images were retrieved, but as this was essentially a proof-of-concept study, comparisons were not made to other methodologies.
Lastly, other investigators have suggested mathematically based algorithms that abandon those characteristics commonly appreciated by the human eye. SIFT (Scale Invariant Feature Transform) is an algorithm that describes a specific region within an image as a feature which is invariant to both scale and rotation. The feature positions are determined by finding extremes of difference of Gaussian images. Regions are depicted by 128 element SIFT feature vectors.14 In their work describing a submission to the medical image retrieval tasks of the 2012 ImageCLEF competition, Collins and coauthors then included four additional parameters consisting of two spatial coordinates within the image, the scale parameter and the dominant orientation parameter.15 Another feature selection methodology, SURF (Speeded Up Robust Features) is a local feature descriptor in which points of interest in an image are specified using coordinates. It uses an integer approximation Hessian blob detector determinant computed using a pre-computed integral image.16 In 2009, Juan and colleagues compared the three feature detection methods: SIFT, Principal Component Analysis (PCA)–SIFT (SIFT performed using PCA instead of histogram approaches) and SURF to determine efficacy and efficiency in image recognition. KNN was used to find the matches. Using a standard image dataset, the authors compared scale changes, rotation, blur, illumination changes and affine transformations among the three techniques. SIFT was slow but was stable across most of the experimental variables. SURF was the fastest with performance equivalent to SIFT. Lastly, PCA-SIFT demonstrated superior performance in rotation and illumination changes.17
Clearly, based on the methodologies previously described, an optimal feature set or feature selection algorithm has yet to be developed to adequately and efficiently bridge the semantic gap.
Retrieving Similar Images
database consists of 7,200 images classified into 100 different classes, the MIR Flickr contains 25,000 images, while the 101 Objects Database contains 9,196 images classified into 101 categories. The authors then use themes, classes, textual annotations and categories to measure precision and recall values. The extracted feature signatures exist in feature spaces containing to seven dimensions. They then evaluate the performance of various similarity measures on color only, color plus texture, color plus position, and color plus position plus texture. Among the various databases queried, the precision varied between 0.315 and 0.790 and computation times range from 10,003 to 1329 msec. They conclude, in general, that the signature quadratic form distance exhibits the highest mean average precision values, while the Hausdorff distance and Perceptually Modified Hausdorff Distance (PMHD) exhibit the lowest computational time values.
Yet others have sought to have the distance measure reflect human perception.18 Zhang and Lu use Minkowski, cosine, histogram intersection and Mahalanobis distance measures among others to query two image datasets: the MPEG7 data set B which consists of 1,400 shapes of natural objects and the set is the MPEG7 region-shaped database which consists of 3,621 trademark shapes.
Figure 5. Performance of different distance measures on MPEG7 Set B.18
The authors found, that, in general, Euclidean distance, city block distance and Chi square statistics are the most desirable distance measurers in terms of retrieval effectiveness and efficiency. These two papers are a sample of the large number of papers that are representative of the high variability in functional accuracy of applying “standard” distance measures to the field of CBIR.
between two multidimensional histograms. As an alternative to vector space descriptions, graph-based representations or graph-matching of image features have also been implemented.14
In a graph representation, nodes represent objects or part of objects.19 Edges describe their relationships. If a graph is then rotated 180 deg and transformed into its “twin”, it is still the same graph. Determining similarity of graphs is labeled as graph matching. In the context of graph matching in CBIR, indexing is performed by qualitative spatial relationships. After desired objects have been extracted and annotated in the first image, an automatic ranking procedure is started. The assumption is made that objects change only slightly from one image to the next. Retrieval of images is made by pictorial example. The task of image retrieval is then formulated as a graph matching problem. Standard algorithms include maximum cliques and tree search. This methodology has been tested in a video database. Clips in this dataset vary from 4 to 20 seconds and contain between 12 and 19 objects each. Changes in object relationships vary from 71 to 402 changes. The time required was approximately 16 secs. The author summarizes that adapting a graph matching algorithm requires a solution of two concrete problems. First, an acceptable graphical representation of the image domain has to be found. Secondly, appropriate error correction has to be defined. As a result, graph matching is only applicable when image content is represented by a graph. In essence, a “cost” function is determined between the graph nodes. Combinatorial algorithms can be used to find a pair-wise matching of the nodes to minimize the total cost.
perception. The authors demonstrate that representing the content of an image database by signatures leads to better results for queries than with histograms. The EMD extends the notion of the distance between single elements to that of a distance between sets of elements.
Relevance Feedback
Conclusion
CBIR has arisen in response to the vastly increasing amounts of image data present in the Internet. A variety of features and similarity measures have been developed to enhance the query accuracy and overall functional utility. However, many of these are not sufficiently robust or specific to adequately capture the semantic aspects of the image. Termed the semantic gap, this chasm remains the single most challenging obstacle facing the field of CBIR. This perceptual subjectivity leads to difficulty in finding a single best representation of the query image. The contributions to image meaning of human perception, interpretation and meaning must ultimately be incorporated into CBIR algorithms to enhance overall utility.
References
1. Murala S, Maheshwari R, Balasubramanian R. Local tetra patterns: a new feature descriptor for content-based image retrieval. Image Processing, IEEE Transactions on. 2012;21(5):2874-2886. 2. Rafiee G, Dlay SS, Woo WL. A review of content-based image retrieval. Paper presented at:
Communication Systems Networks and Digital Signal Processing (CSNDSP), 2010 7th International Symposium on2010.
3. Müller H, Michoux N, Bandon D, Geissbuhler A. A review of content-based image retrieval systems in medical applications—clinical benefits and future directions. International journal of
medical informatics. 2004;73(1):1-23.
4. Akgül CB, Rubin DL, Napel S, Beaulieu CF, Greenspan H, Acar B. Content-based image retrieval in radiology: current status and future directions. Journal of Digital Imaging. 2011;24(2):208-222. 5. Rehman M, Iqbal M, Sharif M, Raza M. Content based image retrieval: survey. World Applied
Sciences Journal. 2012;19(3):404-412.
6. Eidenberger H, Breiteneder C. Semantic feature layers in content-based image retrieval: implementation of human world features. Paper presented at: Control, Automation, Robotics and Vision, 2002. ICARCV 2002. 7th International Conference on2002.
7. Smeulders AW, Worring M, Santini S, Gupta A, Jain R. Content-based image retrieval at the end of the early years. Pattern Analysis and Machine Intelligence, IEEE Transactions on. 2000;22(12):1349-1380.
8. Zhang D, Islam MM, Lu G. A review on automatic image annotation techniques. Pattern
Recognition. 2012;45(1):346-362.
9. Beecks C, Uysal MS, Seidl T. A comparative study of similarity measures for content-based multimedia retrieval. Paper presented at: Multimedia and Expo (ICME), 2010 IEEE International Conference on2010.
10. Rubner Y, Tomasi C, Guibas LJ. The earth mover's distance as a metric for image retrieval.
International journal of computer vision. 2000;40(2):99-121.
11. Yu H, Li M, Zhang H-J, Feng J. Color texture moments for content-based image retrieval. Paper presented at: Image Processing. 2002. Proceedings. 2002 International Conference on2002. 12. Tamura H, Mori S, Yamawaki T. Textural features corresponding to visual perception. Systems,
Man and Cybernetics, IEEE Transactions on. 1978;8(6):460-473.
14. Grigorova A, De Natale FG, Dagli C, Huang TS. Content-based image retrieval by feature adaptation and relevance feedback. Multimedia, IEEE Transactions on. 2007;9(6):1183-1192. 15. Collins J, Okada K. A Comparative Study of Similarity Measures for Content-Based Medical Image
Retrieval. Paper presented at: CLEF (Online Working Notes/Labs/Workshop)2012.
16. Bay H, Ess A, Tuytelaars T, Van Gool L. Speeded-up robust features (SURF). Computer vision and
image understanding. 2008;110(3):346-359.
17. Juan L, Gwun O. A comparison of sift, pca-sift and surf. International Journal of Image Processing
(IJIP). 2009;3(4):143-152.
18. Zhang D, Lu G. Evaluation of similarity measurement for image retrieval. Paper presented at: Neural Networks and Signal Processing, 2003. Proceedings of the 2003 International Conference on2003.
19. Bunke H. Graph matching: Theoretical foundations, algorithms, and applications. Paper presented at: Proc. Vision Interface2000.
20. Vailaya A, Figueiredo MA, Jain AK, Zhang H-J. Image classification for content-based indexing.